
Trading Charts: Types, Timeframes and How to Read Them


Contents
- Trading charts in 30 seconds
- What are trading charts?
- The basic chart types: line, bar, candlestick
- Charts without a time axis
- Timeframes: choosing the right one
- Trading charts by market
- Setting up trading charts in TradingView
- Chart patterns on trading charts
- Psychology: from chart to decision
- Conclusion: trading charts as the foundation
- Frequently asked questions about trading charts
- About the author
A trading chart turns a list of prices into a picture you can read in seconds. It shows where a market came from, where buyers and sellers met, and where the trend turned. Every chart answers the same three questions: what happened to price, over which period, and how it is drawn.
This guide walks through all three. You will learn the main chart types, from the simple line chart to charts that ignore time completely, how to pick a timeframe, how charts behave in different markets, and how to set them up in TradingView. All example charts use current data from November 2026.
Trading charts in 30 seconds
- What they show: price movements of a stock, currency, commodity or index over time, drawn as a line, bars or candles.
- Three basic types: the line chart shows only closes, the bar chart and the candlestick chart show open, high, low and close (OHLC) of every period.
- Charts without time: Renko, Kagi, point and figure, range bars, tick and volume charts draw a new element only when price or activity moves.
- Timeframe: scalpers use tick and 1-minute charts, day traders 5 to 60 minutes, swing traders 4 hours to daily, position traders daily to monthly.
- Platform: TradingView offers all common chart types in the browser and is my recommendation for beginners and professionals.
- The real edge: no chart and no indicator is perfect. What counts is reading the chart well and combining it with risk management and discipline.
What are trading charts?
Trading charts are graphical representations of the price movements of a financial instrument, such as a stock, a currency pair or a commodity, over a chosen period.
A chart works like a map of the market. A beginner may see only lines and bars. An experienced trader sees a story of supply and demand: where buyers stepped in, where sellers took over and where the market hesitated. Reading that story well is a skill that grows with practice, and it is the core skill of technical analysis.
The idea of charting prices is old, but its most popular form comes from Japan. Japanese rice traders developed an early tradition of price analysis, and candlestick charts grew out of it. The American analyst Steve Nison brought them to Western traders in the early 1990s. More on their history is in my guide on how to read candlestick charts. Once you can read a chart, the next step is the typical shapes on it, the chart patterns further down this page.
The basic chart types: line, bar, candlestick
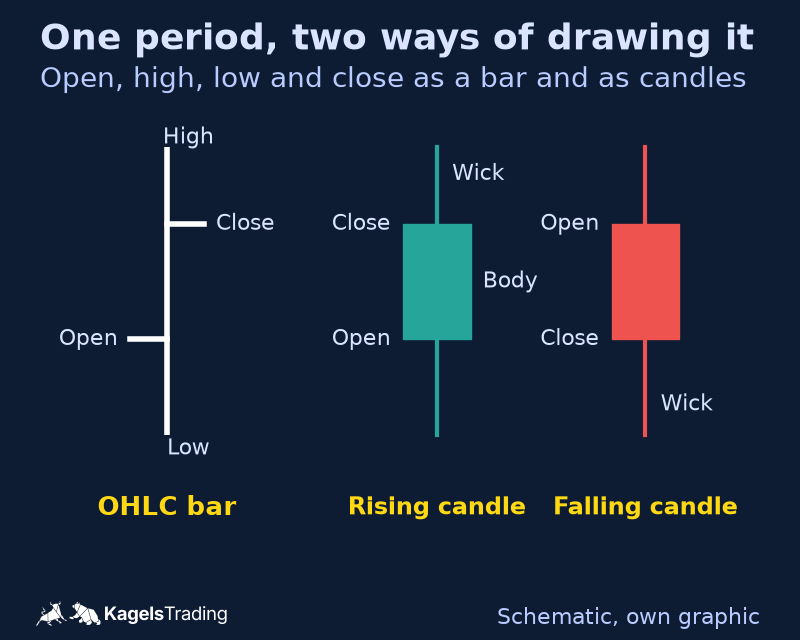
Three chart types cover most of what traders need. They differ in how much of each period they show. The line chart shows one price per period, the bar chart and the candlestick chart show four: open, high, low and close.
 Click to enlarge
Source: Schematic graphic by Kagels Trading.
Line charts: the simplest trading chart
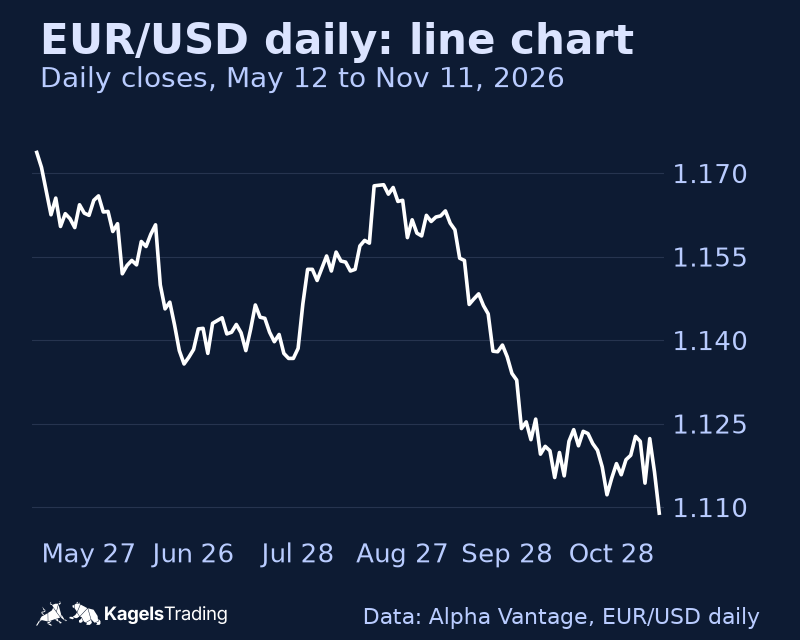
A line chart connects the closing prices of each period with one continuous line. That is all it shows. The simplicity is its strength: the line filters out the noise inside each period and makes the trend easy to see. For long-term trends and as a first step into charting, the line chart is hard to beat.
A daily EUR/USD line chart is a good example. It hides the intraday swings and shows the larger direction at a glance. In the chart below, the pair fell from a close of 1.1737 on May 12, 2026 to 1.1089 on November 11, with one clear rebound in August. On a line chart, I look mainly at the trend direction, support and resistance levels and classic shapes such as head and shoulders or triangles.
 Click to enlarge
Bar charts: four prices per period
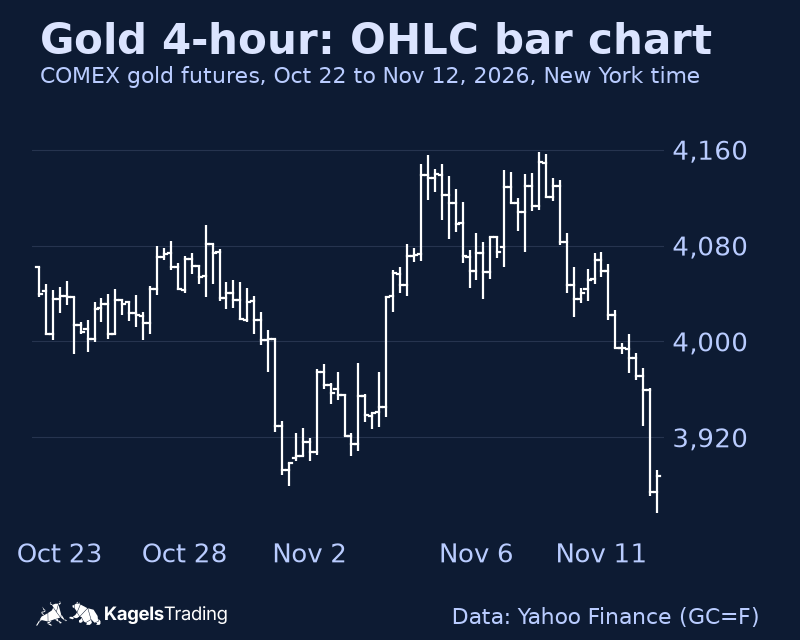
A bar chart, also called an OHLC chart, shows four prices for every period. The vertical bar runs from the high to the low. A small tick on the left marks the open, a tick on the right the close. Each bar is one period: one minute, four hours or one day.
That makes the bar chart much richer than a line chart. You see how far price moved inside each period, not only where it ended. A 4-hour gold chart, for example, shows both the short swings within the day and the larger move over several weeks. In the chart below, COMEX gold futures made two highs within $2 of each other, at $4,155.8 on November 4 and $4,157.7 on November 9, 2026, then fell to $3,856.7 by November 12. Shapes like this double top or an inside bar are easy to miss on a line chart.
 Click to enlarge
Candlestick charts: the most popular chart type
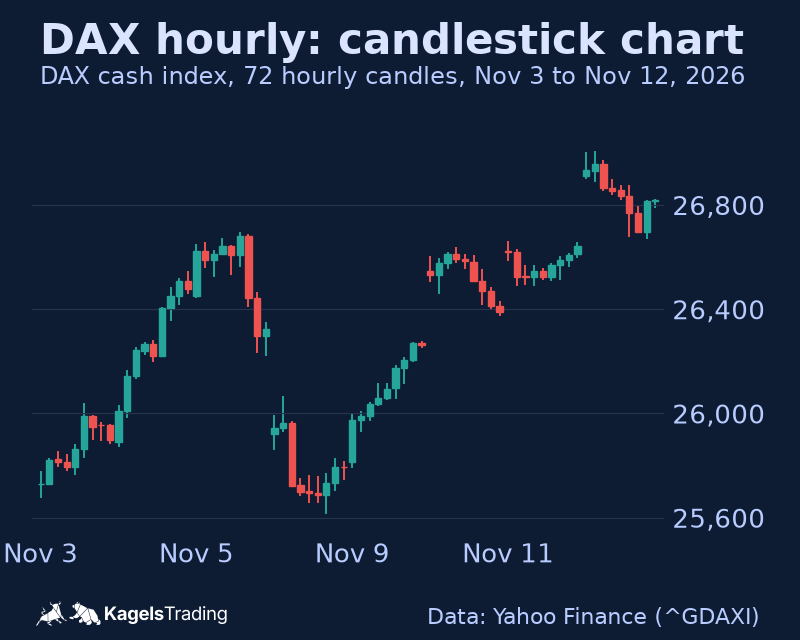
Candlestick charts carry the same four prices as bar charts, but in a form that is faster to read. The thick body spans the range between open and close. The thin wicks above and below show the high and the low. The colour shows the direction at once: usually green or white for a rising period and red or black for a falling one.
That is why most traders I know work with candles. A long body shows strong momentum, a long wick shows that price was rejected at that level. Individual shapes such as the doji, the hammer candlestick, the shooting star or the engulfing pattern can point to a possible turn. The full catalogue is in the guide to candlestick patterns. An hourly DAX chart like the one below is a typical tool for day trading and short swing trading.
 Click to enlarge
Heikin Ashi charts: smoothed candles
Heikin Ashi charts look like candlestick charts, but each candle is an average, not a real price. The Heikin Ashi close is the average of open, high, low and close. The Heikin Ashi open is the midpoint of the previous Heikin Ashi candle’s open and close. The high is the maximum of the real high, the Heikin Ashi open and close; the low is the minimum of the real low and these two values.
The result is a calmer chart with long runs of one colour in a trend. That makes trends easier to follow and helps against leaving a good trade too early. The price on the chart, however, is not the market price. For entries, stops and targets I always check the normal candlestick chart.
Charts without a time axis
On the charts above, a new bar starts when the clock says so. Many advanced traders use charts where a new bar starts only when something happens in the market: a number of trades, a certain volume or a certain price move. In quiet phases these charts draw almost nothing, in busy phases they draw a lot.
Volume and tick charts
A volume chart draws a new bar or candle once a set number of contracts or shares has traded. It follows real market activity instead of the clock and removes the many small, meaningless bars of quiet hours. The idea goes one step further in the footprint chart, which splits each candle into price levels and shows the volume traded at each one. TradingView’s version is described in the guide to the TradingView Volume Footprint.
A tick chart draws a new bar after a set number of transactions. It gives a direct view of trading activity and is popular for scalping and very short-term day trading. A 233-tick chart of the Dow Jones futures, for example, shows even small moves in detail. For reading volume itself, see the guide to volume analysis.
Range bars and point and figure
Range bar charts draw a new bar only when price has moved a set amount. With a range of $5 on a stock, a new bar appears only after a move of at least $5. That hides sideways phases with little movement and puts the focus on the moves that matter.
Point and figure charts are among the oldest chart types and also ignore time. They use columns of X for rising prices and O for falling prices and filter out small moves. A point and figure chart of gold futures with a box size of $5 and a 3-box reversal, for example, starts a new column only after a countermove of at least $15.
Renko, Kagi and three line break
Renko, Kagi and three line break charts come from the Japanese charting tradition. Renko, from the Japanese word for brick, sets equal bricks of a fixed size and ignores time. Each brick stands for a set price move, which gives a very clean picture of the trend.
Kagi and three line break charts follow the same idea in their own way. A Kagi chart draws one continuous line that changes direction only when price turns by a set amount, and it changes thickness only when it breaks the last peak or trough. It is explained in detail with DAX data in the guide to Kagi charts. A three line break chart adds a new block in the same direction when a period closes beyond the last block; a block in the other direction appears only when a close breaks the extreme of the last three blocks. These charts help to spot trend changes and are less distracted by noise. “No time axis” does not mean time plays no role: most platforms build them from an underlying data interval, such as hourly closes, and a different interval can change the picture.
The table sums up what triggers a new element on each chart type. The time-based charts are listed first, the activity-based and price-based ones after them.
| Chart type | A new bar or element starts when | Typical use |
|---|---|---|
| Line, bar, candlestick | The period ends (minute, hour, day) | All styles, the standard |
| Heikin Ashi | The period ends, values are averaged | Following trends |
| Tick chart | A set number of trades is reached | Scalping, day trading |
| Volume chart | A set volume is reached | Day trading, futures |
| Range bars | Price has moved a set amount | Day trading |
| Renko (fixed brick size) | Price moves one brick beyond the last brick, or two bricks for a reversal | Trend following |
| Kagi | Price turns by the reversal amount | Trend following |
| Point and figure | Price moves one box or reverses by several boxes | Breakouts, price targets |
| Three line break | A close beyond the last line, or beyond the last three lines for a reversal | Trend changes |
Timeframes: choosing the right one
The timeframe decides what a chart can show you. A 1-minute chart and a weekly chart of the same market can point in opposite directions, and both are right for their period. Choosing the right timeframe is therefore as important as choosing the chart type.
Matching the timeframe to your trading style
Each trading style has its typical timeframes. Scalpers use tick and 1-minute charts, active day traders 5 to 15 minutes, swing traders 4-hour and daily charts, and long-term position traders weekly and monthly charts.
| Trading style | Typical holding period | Typical chart timeframes |
|---|---|---|
| Scalping | Seconds to minutes | Tick, 1 minute, up to 5 minutes |
| Day trading | Minutes to hours, flat by the close | 5 to 60 minutes |
| Swing trading | Days to weeks | 4 hours to daily |
| Position trading | Weeks to months | Daily to monthly |
Your own situation matters as much as the style. Think about the time you have for chart work, your risk tolerance, your strategy and the markets you trade. A EUR/USD day trader, for example, might take entries on the 5-minute chart, read the trend on the 1-hour chart and mark the key support and resistance levels on the 4-hour chart.
Multi-timeframe analysis
Multi-timeframe analysis looks at the same market on several timeframes, from the top down. The long-term chart shows the main trend, the medium-term chart shows swing highs and lows and the support and resistance zones, and the short-term chart is used for the timing of entries and exits.
A gold trader could work like this. The weekly chart shows a long-term uptrend, the daily chart a bull flag, and the 1-hour chart a pullback into a support zone. A long entry then comes into question when a bullish reversal candle appears at that support on the 15-minute chart. The method does not guarantee a winning trade, but it keeps you on the side of the larger trend. The full method is in the guide to multi-timeframe analysis.
Trading charts by market
The same chart type behaves differently in every market. Trading hours, liquidity and the typical news all leave their marks. Three examples show what to watch for.
Currencies and gold
EUR/USD and gold show typical features on their charts. The two currencies behind EUR/USD are the most traded in the world: in the BIS Triennial Survey of April 2025, the US dollar was on one side of 89% of all FX trades and the euro came second with 28.9%. The forex market trades around the clock on weekdays, so the trading sessions in Asia, Europe and America change volatility through the day. Round numbers such as 1.1000 or 1.1500 often act as psychological levels. Current levels are in my EUR/USD forecast.
Gold often acts as a safe haven and can move against other markets in times of stress. Its volatility leads to fast and large moves, and round numbers matter here as well: in the 4-hour chart above, gold futures crossed $4,000 several times within three weeks. On gold charts I watch long-term trendlines, volume and the US dollar. Fibonacci retracement levels and round numbers help to find entries with a good risk/reward ratio. The current analysis is in my gold price forecast.
Stock indices: DAX and Dow Jones
The DAX and the Dow Jones each have their own character on a chart. The DAX cash index is calculated from Xetra prices from 9 am to 5:30 pm Frankfurt time (CET in winter, CEST in summer). The night in between often leaves a gap between the close and the next open. In the hourly chart above, three of the seven session opens in the chart came more than 250 points away from the previous close: down 404 points on November 6, up 287 points on November 10 and up 266 points on November 12, 2026. How to trade such moves is covered in the guide to gap trading.
The DAX also tends to react when US markets open in the afternoon, European time. The Dow Jones Industrial Average consists of 30 large US stocks and is price-weighted, so high-priced stocks move it more than cheap ones. Its stocks trade on the NYSE and Nasdaq from 9:30 am to 4:00 pm Eastern Time. The index reacts strongly to US economic data. On the DAX 15-minute chart and the Dow 1-hour chart I watch the session patterns, the key technical levels and how both indices move together. My views are in the DAX forecast and the Dow Jones forecast.
Single stocks: Tesla as an example
Tesla shows the chances and the risks of a very volatile single stock. Its large daily moves mean that stops and targets must be wider than on calmer stocks. Heavy options activity can affect the price near popular strike prices, and company news can move the stock at any time.
On a Tesla chart, I would always take the higher volatility into account. The ATR indicator measures it and helps to size stops. Volume tells you how strong a breakout really is. Earnings reports deserve special attention, because they often cause large moves and gaps that remain visible on the chart for a long time. Which indicators work well together on a chart is covered in the guide to moving averages and the other indicator guides in this blog.
Setting up trading charts in TradingView
TradingView is the platform I recommend for trading charts, for beginners and professionals alike. It runs in the browser and as a desktop app, offers all chart types from this guide and is free to start. A full review is in my guide to TradingView.
The basic setup
Start with three settings: chart type, timeframe and colours. Choose the chart type that suits your style, set the timeframe and adjust the colours so that rising and falling bars are easy to tell apart. Price and volume should be clearly visible; the grid and the scale can follow your taste. A step-by-step introduction is in the guide on how to use TradingView.
Experienced traders save different layouts for different strategies. A day trader might put several short-term charts side by side, while a swing trader prefers a layout with a 4-hour and a daily chart. Saved layouts save time every day and keep the analysis consistent.
Advanced features
TradingView offers a large toolbox for chart analysis. According to its own feature page, it has more than 110 drawing tools, more than 400 built-in indicators and strategies and more than 100,000 public indicators from the community. Drawing tools include trendlines and Fibonacci retracements; multi-chart layouts show several markets or timeframes at once.
Pine Script is one of TradingView’s biggest strengths. With Pine Script you can write your own indicators, and even without programming skills you can adapt existing scripts. An example setup for EUR/USD: a 1-hour candlestick chart with the 20 and 50-period EMAs, plus the RSI, the MACD and volume below it. In spot forex, “volume” depends on the data feed and is often tick volume, the number of price updates, not the total traded amount. Fibonacci retracements between the key swing highs and lows and alerts for breaks of important levels complete the setup.
Chart patterns on trading charts
Trading charts show recurring patterns that can hint at the next move. None of them is a certainty, but they help to sort the market into trend, reversal and consolidation.
Trend and reversal patterns
Continuation patterns suggest that the current trend is more likely to go on. In uptrends, typical shapes are ascending triangles, bull flags, pennants and the cup and handle. In downtrends, descending triangles, bear flags, pennants and falling rectangles are common.
Reversal patterns point to a possible change of trend. At the end of an uptrend, traders watch for the head and shoulders, double and triple tops, or a bearish engulfing candle. At the end of a downtrend, the inverse head and shoulders, double and triple bottoms or a bullish engulfing candle are the counterparts. The inverse head and shoulders, for example, consists of three lows, with the middle one the deepest. A break above the neckline on rising volume often signals a turn and gives a measurable price target. All shapes with examples are in the guide to chart patterns.
Consolidation patterns
Consolidation patterns are pauses in a trend, when buyers and sellers are in balance. The most important are symmetrical triangles with converging trendlines and falling volatility, rectangles between horizontal support and resistance, wedges with converging lines, and flags and pennants as short pauses after strong moves. Both wedges are explained in the guide to the wedge pattern.
These patterns can end with a breakout in the trend direction or with a reversal. Which one depends on the market context, volume and other indicators. The symmetrical triangle is a typical case: price swings in an ever narrower range between a falling resistance line and a rising support line, volatility drops, and then price breaks out. The direction is not known in advance. Traders use the pause to prepare clear entry and exit rules for both sides; more on this in the guides to consolidation trading and breakout trading.
Psychology: from chart to decision
The step from chart analysis to an actual trade is shaped by psychology. Good traders combine their reading of the chart with a fixed decision process, so that the chart, and not their mood, decides.
From chart reading to a trade decision
A structured process has five steps. First an objective chart analysis. Then the context: how does the picture fit the larger market? Then the risk assessment, weighing the possible loss against the possible gain. Then the check against your own trading plan. Last comes an honest look at your own state of mind, to catch distortions in how you read the chart.
Only after that comes the execution decision: entry, exit and position size. It is important to accept that not every pattern on a chart deserves a trade. The discipline to wait for the best setups and ignore the weaker ones is one of the clearest differences between experienced traders and beginners. More on this in the guide to the trading mindset.
Avoiding cognitive biases
Several mental shortcuts can distort how we read a chart. Confirmation bias makes us see only the signals that support our existing view. Hindsight bias makes past moves look more predictable than they were. The availability heuristic gives recent or emotional experiences too much weight, and anchoring fixes us on certain price levels.
Herd behaviour and the illusion of control complete the list. Following the crowd replaces our own analysis, and the illusion of control makes us believe we have more influence on the outcome than we do. Three habits help against all of them: a trading journal, a written trading plan and the active search for arguments against your own view. Discussing charts with other traders can reveal blind spots as well.
Conclusion: trading charts as the foundation
Trading charts are the main navigation tool of every serious trader. They show price movements, reveal trends, help to anticipate turning points and support better decisions. From the simple line chart to the Japanese charts without a time axis, each type offers its own view of the market.
The key is not the perfect chart type or the perfect indicator. What counts is understanding the different chart types and using each one where it fits. Combined with solid risk management and emotional discipline, that is a real advantage in the markets.
Charts are only as good as the trader who reads them. Try different chart types and timeframes, record your analyses in a journal and learn from both good and bad trades. A modern platform such as TradingView makes this easy. Trading charts show probabilities, not certainties; nothing in this guide is investment advice.
Frequently asked questions about trading charts
What are trading charts?
Trading charts are graphical representations of the price movements of a financial instrument, such as a stock, a currency or a commodity, over a chosen period.
Why are trading charts important for traders?
Charts help traders to analyse price history, recognise trends and find possible entries and exits. They show at a glance where the market stands, where support and resistance lie and how strong the current move is.
What is the best chart type for beginners?
For beginners I recommend candlestick charts, because they are intuitive and show open, close, high and low at a glance. The colours make the direction clear at once. Line charts are a useful addition to see the larger trend without noise. With more experience, beginners can move on to advanced chart types.
Which timeframe is best for my trading charts?
The best timeframe depends on your trading style. Scalpers use tick or 1 to 5-minute charts, day traders 5 to 60 minutes, swing traders 4 hours to daily and position traders daily to monthly charts. Combining several timeframes gives the most complete picture.
Which indicators should I use on my trading charts?
With indicators, less is more. A good basic setup combines one trend indicator such as a moving average, one momentum indicator such as the RSI or MACD, and one volume indicator. Too many indicators produce information overload and conflicting signals.
How do I find support and resistance levels on trading charts?
Support and resistance appear where the market has reacted several times in the past. Round numbers, Fibonacci levels, important moving averages and large gaps are further reference points. A level becomes more important the more often it is tested and the more volume trades there. Details are in the guide to support and resistance.
Can trading charts reliably predict future price moves?
No, trading charts are tools for weighing probabilities, not crystal balls. They show historical patterns from which future moves can be estimated with some probability. How reliable that is depends on liquidity, timeframe, market context and correct interpretation. Successful traders combine charts with risk management, psychology and often fundamental analysis.
Which trading charts suit volatile markets like crypto?
Heikin Ashi and Renko charts suit very volatile markets, because they reduce noise and show trends more clearly. Longer timeframes such as 4 hours or daily filter out the extreme short-term swings. The volume profile shows important price levels, and the ATR helps to set stops and targets that match the volatility.
How do I avoid overanalysis with trading charts?
Overanalysis, often called analysis paralysis, is a common problem in chart trading. Use a clear, rule-based strategy with defined entry and exit criteria. Limit yourself to three or four indicators and one or two main timeframes, set a time limit for your analysis and work with a checklist. If you feel stuck, step away from the screen and come back later.
How do I read volume together with a chart?
Volume is supporting evidence for the strength of a price move, not proof. Rising prices on rising volume point to a strong uptrend, rising prices on falling volume can show buying pressure fading. A breakout from a consolidation should come with clearly higher volume. Keep the daily rhythm in mind: volume is naturally higher around the open and the close and lower before holidays. In spot forex, most charts show only tick volume from one feed.
This English edition is based on our German edition on kagels-trading.de and has been adapted for international readers.
More Chart Techniques guides
- Draw key levels
Support and Resistance: How to Draw and Use Key Levels
Where useful levels come from, how to draw zones with a stated rule and how to turn a level into a trade plan.
- Read price action
Price Action Trading: How to Read Charts Without Indicators
Market structure, key zones and three bar patterns, with a core setup and a real SPY example where the signal failed.
- Read candlestick charts
How to Read Candlestick Charts: Body, Wicks and Context
Open, high, low and close in one candle, body and wicks, two real Gold candles read step by step and how often patterns really occur.
- Know candlestick patterns
Candlestick Patterns: 10 to Know, Tested on Real Data
Ten patterns with rules and a cheat sheet, counted on DAX, S&P 500, EUR/USD and Gold since 2014: most are rare, none is a signal on its own.
- Trade the hammer candle
Hammer Candlestick: Spot It, Trade It, Know Its Limits
Three features, the difference to inverted hammer and hanging man, entry and stop, and how rarely the hammer appeared in four markets since 2014.
- Spot a morning star
Morning Star Candlestick: Rules, Real Cases, Limits
Three measurable rules, every morning and evening star in four markets since 2014, and two real cases: one reached its target, one hit its stop.
- Spot a topping tail
Topping Tail Candlestick: Rules, Silver Example and Limits
Six measurable rules for the bearish rejection candle, a silver candle from January 2026 checked step by step, the difference from the shooting star and how to trade it with a stop.
- Combine timeframes
Multi-Timeframe Analysis: A Weekly and Daily Workflow
How to combine the weekly chart for context and the daily chart for entry under one stated rule, with a documented SPY case from June 2025.
- Trade pullbacks
Pullback Trading: Entries, Stops and Failed Setups
Pullback or reversal, limit against confirmation entry, and one fixed rule set on three real QQQ cases: a target, a stop and a cancelled setup.
- Trade sideways ranges
Range Trading: Boundaries, Orders and Two Documented Fades
A 14-session rule to draw horizontal boundaries, three order-type variants and two Alpaca-verified SPY fades, one that reached the target and one that was stopped out.
- Read a consolidation
Consolidation in Trading: What the Range Tells You
What a consolidation is, why 25 years of index data showed no stable direction edge from narrow ranges or the prior trend, and two DAX breakouts from 2026.
- Read chart formations
Chart Patterns: Reversals, Continuations and Failures
Reversal, continuation and bilateral formations with the measured-move convention per pattern and two documented SPY rectangle cases.
- Trade rising and falling wedges
Rising and Falling Wedge Patterns: How to Trade Them
How to spot both wedges, where to set entry, stop and target, and why Bulkowski ranks the rising wedge with a downward breakout last of 36 patterns.
- Trade breakouts
Breakout Trading Strategy: Entries and False Breakouts
How often breakouts fell back into the range in our count of 1,472, and how to plan entry, stop and position size.
- Draw and trade trendlines
Trendline Trading: How to Draw Trendlines and Trade Them
How to draw trendlines with a fixed rule, four strategies for bounces, breaks and retests, and a real SPY line break without a lasting reversal.
- Draw a pitchfork channel
Andrews Pitchfork: How to Draw It, Trade It and Test It
Three pivots, a median line and two parallels, Schiff variants, a trade plan and how often price reached the median line in 746 cases.
- Use Fibonacci levels
Fibonacci Retracement Levels: How to Draw and Trade Them
How to calculate and draw retracement levels, trade pullbacks with confluence and a stop at the structure, and what a ten-year test says about the levels.
- Set Fibonacci targets
Fibonacci Extension: Levels, How to Draw It and Calculator
Three-point extension targets from the end of a pullback, why they differ from levels beyond 100%, a free calculator and three SPY swings, one without a single target reached.
- Trade gaps
Gap Trading Strategy: How to Trade Gaps and When Gaps Fill
Opening and full gaps, the four classic gap types, how often SPY gaps filled in our count since 2001, and plans for gap fill and gap and go.
- Calculate pivot points
Pivot Points: Formulas, Types and How to Trade Them
Formulas for standard, Fibonacci, Woodie, Camarilla and DeMark pivots, a free calculator, which session counts and a real SPY day.
- Swing trade
Swing Trading: 4 Strategies, Risk and Real Examples
Four swing trading strategies on the daily chart, position size, gap risk and US rules, with two hypothetical SPY pullbacks: one hit its target, one was stopped out.
- Identify market stages
Stage Analysis: Stan Weinstein's Four Market Stages
Stan Weinstein's four stages on the weekly chart, a Stage 2 checklist and two TSMC breakouts: one ran for a year, one gapped through its stop.
- Read Kagi charts
Kagi Charts: Reversal Amount, Shoulders and Signals
One line, one reversal amount, thick yang and thin yin: tested on DAX hourly data and compared with Renko and point and figure.
- Screen for growth leaders
CAN SLIM: William O’Neil’s Seven Rules for Growth Stocks
William O'Neil's seven CAN SLIM criteria with thresholds, his selling rules, a free screen with real counts and what the tests really show.
- Read Wyckoff ranges
Wyckoff Method: Accumulation, Distribution and Springs
Accumulation and distribution with phases A to E, springs and upthrusts as optional tests, and two real TSMC ranges read with and without hindsight.
- Trade Darvas boxes
Darvas Box Strategy: Rules, Entries and Stop Losses
The box rules step by step, when the edges become known, where the stop goes, and a mechanical test on TSMC in 2024 with two honest results.
- Count Elliott waves
Elliott Wave Theory: Rules, Patterns and Fibonacci
The five-wave pattern, three hard rules, zigzags, flats and triangles, Fibonacci ratios and a real DAX count, from the first German translator of the standard work.
- Understand Smart Money Concepts
Smart Money Concepts (SMC): What They Are and What Holds Up
The seven SMC building blocks, BOS vs CHoCH vs MSS, one labeled SPY sequence that held, one that failed, and what a chart can and cannot show.
- Understand ICT trading
ICT Trading: Silver Bullet, Killzones and What Holds Up
Michael Huddleston's Inner Circle Trader method: Silver Bullet, Judas Swing, the 2022 model and killzones in New York time, with one SPY setup that worked and one that failed.
- Trade order blocks
Order Blocks: How to Spot, Draw and Trade the Zone
The three conditions behind a valid order block, entry and stop at the zone, two SPY cases from 2026 and a 25-year count where a fixed rule lost money.
- Trade fair value gaps
Fair Value Gap (FVG): How to Spot, Trade and Test It
The three-candle rule, bullish, bearish and inverse FVG, two SPY cases from 2026 and a 25-year count of how often gaps were revisited and traded.
- Trade inverse fair value gaps
Inverse Fair Value Gap (IFVG): Rules, Examples and a Test
When a broken gap counts as inverted, three entry styles, one SPY retest that held, one that failed, and a 25-year test with trend and sweep filters.
- Trade failed breakouts with Turtle Soup
Turtle Soup Trading: Raschke Rules, ICT Version and a Test
Linda Raschke's original rules, Turtle Soup Plus One and the ICT version side by side, two SPY examples and a 25-year test on SPY and QQQ.
- Read a break of structure
Break of Structure (BOS): Rules, CHoCH vs MSS and a Test
Which swing counts, BOS vs CHoCH vs MSS under one stated convention, two SPY breaks that won and lost, and a 25-year test against ordinary days.
- Read a change of character
Change of Character (CHoCH): Rules, BOS vs MSS and Data
The first close against the trend, close versus wick, CHoCH vs BOS vs MSS, two SPY cases and what the trend did next after 287 CHoCHs on SPY and QQQ.
- Read a market structure shift
Market Structure Shift (MSS): Rules, BOS vs CHoCH and Data
MSS as a CHoCH with a sweep and a fair value gap, the comparison with BOS and CHoCH, two 2021 cases and what 14 daily MSS on SPY and QQQ did next.
- Draw supply and demand zones
Supply and Demand Trading: Zones, Rules and Real Data
Base and departure rules, the four base patterns, how zones differ from order blocks and SMC, two SPY cases and a fixed test of 86 zone trades on SPY and QQQ.
- Read liquidity sweeps
Liquidity Sweep: How to Spot It and Trade the Reversal
Sweep or run, buy-side and sell-side liquidity, internal and external targets, SPY reversal, continuation and failed-reversal examples and a 25-year count of a fixed sweep rule.
- Spot bull and bear traps
Bull Trap vs Bear Trap: How to Spot a Trapped Market
What bull traps and bear traps are, the two signs of trapped traders, how to trade the reversal with a defined stop, and two real SPY examples from 2025.
- Interpret volume
Volume Analysis in Trading: How to Read Volume Honestly
What volume counts in stocks, futures, forex and crypto, how to read it against its own average, and our SPY test of high-volume days since 2001.