
Gap Trading Strategy: How to Trade Gaps and When Gaps Fill


Contents
- Gap trading in 30 seconds
- What is a gap in trading?
- The four types of gaps
- Do gaps always fill? Our SPY measurement
- Gap trading strategies
- A real SPY example: one gap filled, one did not
- Weekend gaps and overnight risk
- Common gap trading mistakes
- Gap measurement method
- Conclusion: name the gap before you trade it
- Frequently asked questions about gap trading
- About the author
Many gaps fill, not all of them, and the difference costs real money. A gap is a price range the chart jumps over between two bars: on a daily chart, the open is away from the prior close. Some traders bet that price comes back to close it. Others bet that it never will. Both can be right, which is why you need to know what kind of gap you are looking at before you trade it.
This guide starts with the definition and ends with numbers. You get the two kinds of gaps, the four classic gap types, our own count of 3,523 SPY gaps since 2001 with how often they filled, two trade plans for gap fill and gap and go, and a real SPY chart from April 2026 with one gap that filled and one that did not. This article follows our editorial policy.
Gap trading in 30 seconds
- A gap is a jump over a price range: the open is above or below the prior close. If even the low is above the prior high, it is a full gap.
- Four classic types: common, breakaway, runaway and exhaustion gaps. Each one calls for a different trade.
- Many SPY gaps filled, but not all: in our count since 2001, about half of all gaps of 0.25 % or more traded back to the prior close the same day. Larger gaps tended to fill less often.
- Gap fill and gap and go are opposite bets: one trades back into the gap, the other with it. Context, size and volume decide which bet fits.
- A stop does not protect you against a gap: if the market opens beyond a stop-market order, it fills at the next available price.
What is a gap in trading?
A gap is the difference between the prior close and the next open, so the chart jumps over a price range. On a daily chart, today’s open is above or below yesterday’s close. That does not prove that nobody ever traded those prices: the prior session may have traded there, and so may the extended hours. The news that caused the jump arrived while the regular session was closed: earnings before the open, economic data at 8:30 a.m. Eastern Time, or events over a weekend.
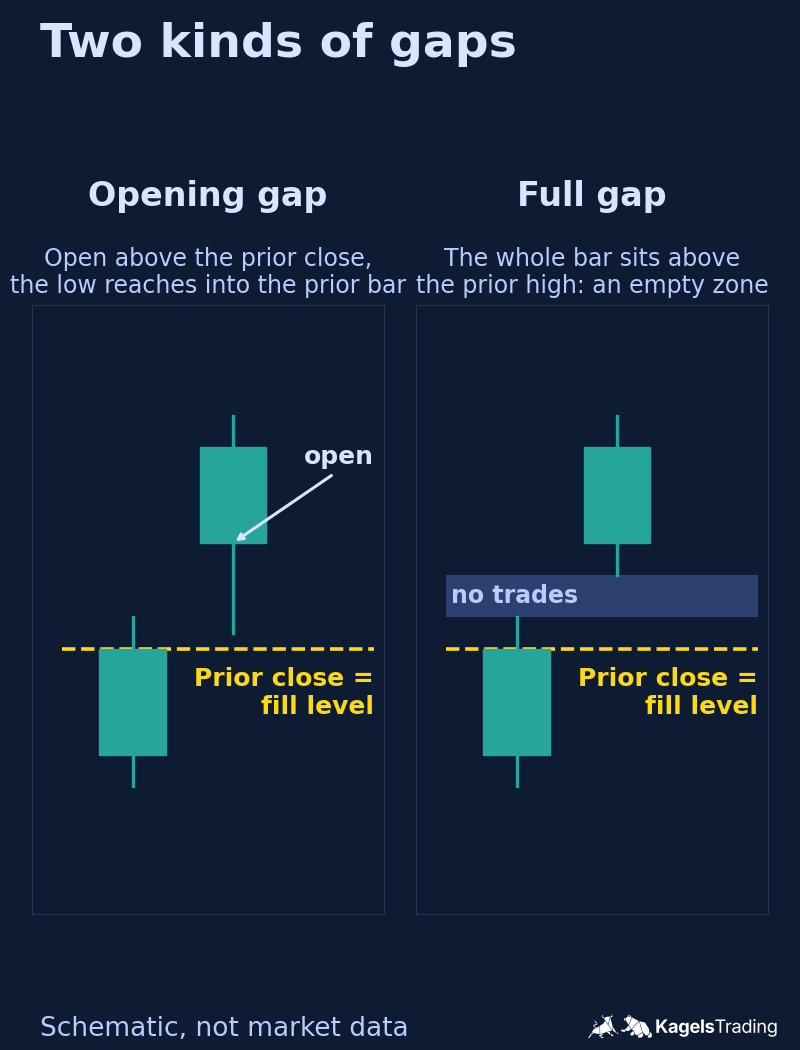
Two kinds of gaps are often mixed up. An opening gap only needs the open to be away from the prior close; the bar can still reach back into yesterday’s range. A full gap is stricter: the whole bar sits above the prior high or below the prior low, and the chart shows an empty zone between the two bars. Whether a gap is full is known only when the gap day has closed. Thomas Bulkowski uses the full gap as his definition on The Pattern Site, while many trading platforms count opening gaps. Both are fine as long as you know which one you are using.
 Click to enlarge
Source: Kagels Trading, own drawing.
When is a gap filled? A gap is filled when price trades back to where it started: for an opening gap that is the prior close. If price only reaches into the gap, the gap is partly filled. For a full gap, some traders use the prior high or low instead of the prior close. In this guide, filled always means back to the prior close.
A gap depends on the chart you use
The same market can show a gap on one chart and none on another. SPY trades before and after the regular session from 9:30 a.m. to 4:00 p.m. Eastern Time. A chart with extended hours shows those trades and may show no gap at all. The S&P 500 futures trade almost around the clock, so their daily bars rarely gap during the week. A gap tells you something about the instrument, data feed and session you are looking at. All numbers in this guide use SPY daily bars from the regular session.
Gap up and gap down: bullish or bearish?
A gap up is not automatically bullish, and a gap down is not automatically bearish. The direction shows where the news pushed the open. What happens next tells you more. A gap up that holds and keeps rising points to strong demand. A gap up that falls back into the gap within hours shows that the buyers at the open did not find follow through.
Context decides whether a gap starts a move or ends one. A gap down after a long decline on very high volume can mark the end of the selling. The same gap at the start of a decline, out of a sideways range, can mark its beginning. That is what the four gap types describe.
The four types of gaps
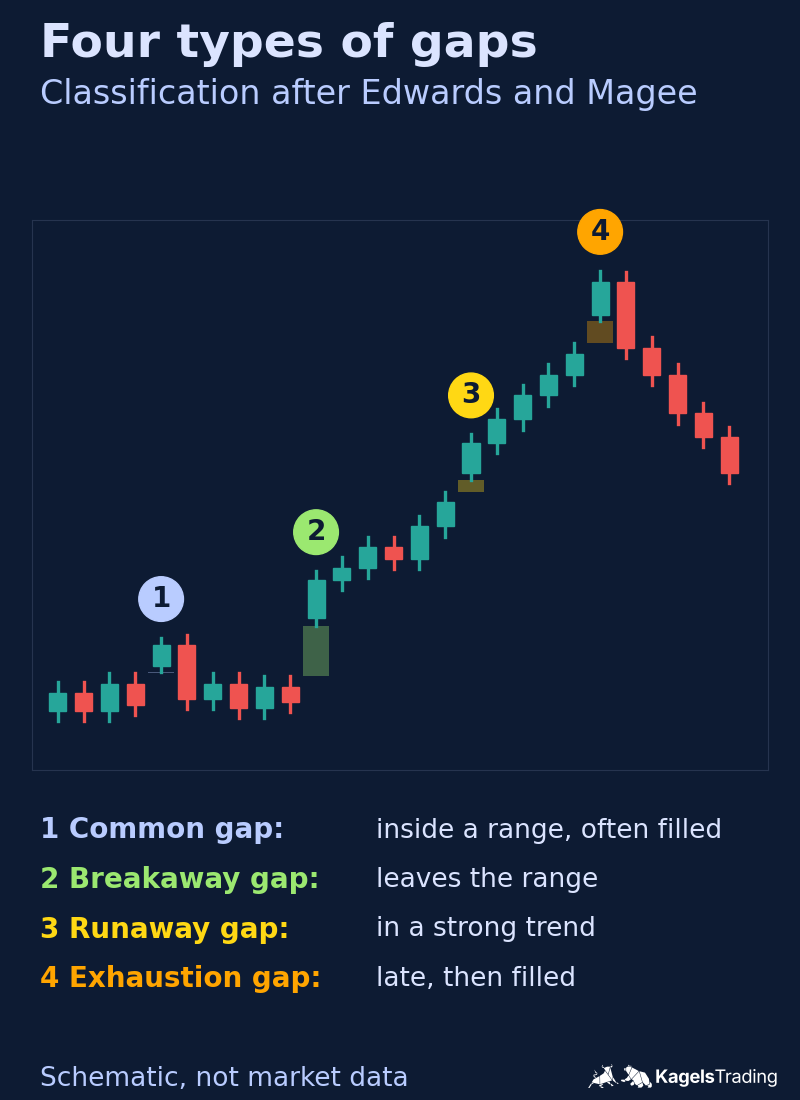
The classic classification goes back to Robert D. Edwards and John Magee, “Technical Analysis of Stock Trends” (1948). It sorts gaps by where they appear in the price structure, not by their size. Thomas Bulkowski later measured how long each type took to fill in stocks; the medians below are his figures for a bull market. The names are simple; recognizing the type in real time is the hard part.
 Click to enlarge
Source: Classification after Edwards and Magee, own drawing.
- Common gap: appears inside a trading range, often on no special news. It tends to fill soon. Bulkowski reports a median of 3 to 4 days until common gaps were closed.
- Breakaway gap: price jumps out of a consolidation and may start a new trend, often on news and high volume. Bulkowski’s median time to close is 84 to 89 days.
- Runaway gap: also called a continuation or measuring gap. It appears in the middle of a strong, fast trend in which pullbacks are small. Bulkowski’s median: 25 days for down gaps, 45 days for up gaps.
- Exhaustion gap: appears late in a trend, often on very high volume, and is filled quickly. Bulkowski’s median: 5 to 6 days. It can mark the end of a move.
The catch is that the type is often clear only afterward. A breakaway gap that fills within two days was perhaps a common gap. An exhaustion gap that keeps running was perhaps a runaway gap. Bulkowski puts it bluntly: by the time you can properly identify some gap types, the move is nearly over. So use the type as a working hypothesis and define in advance what would prove it wrong.
Do gaps always fill? Our SPY measurement
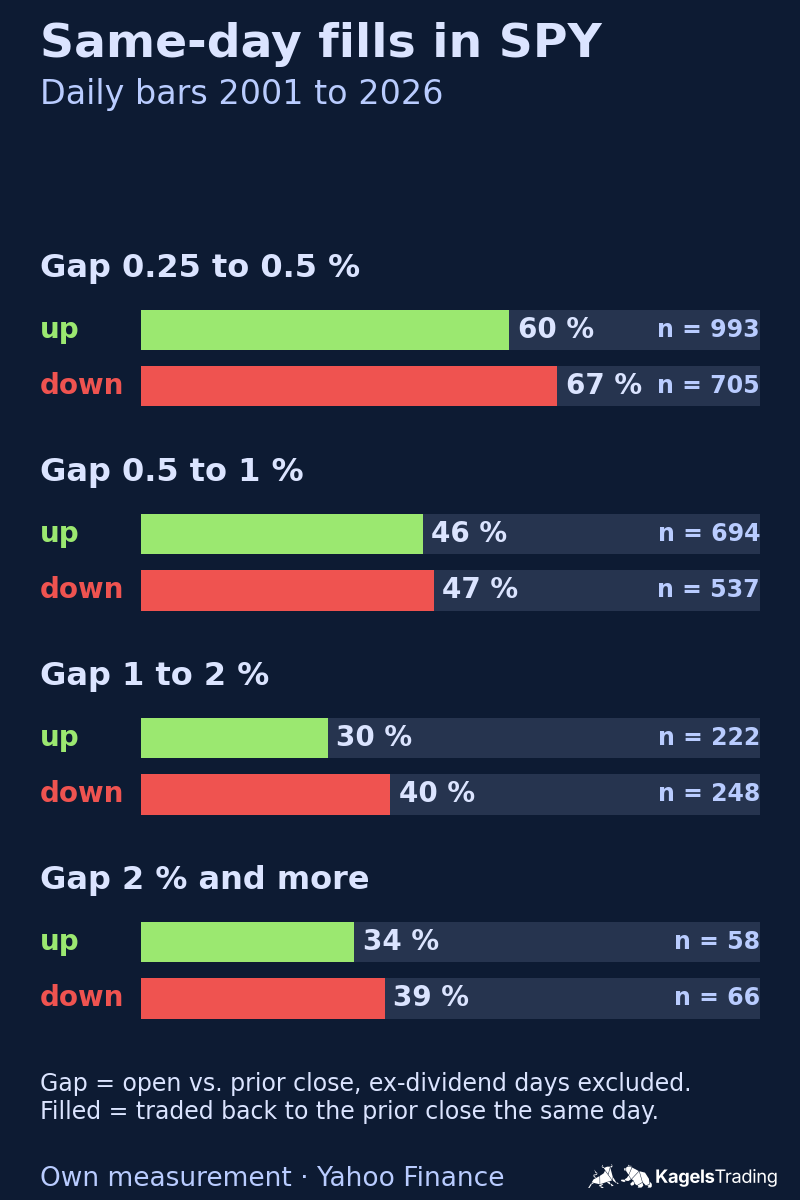
No, and the numbers show by how much. We counted every opening gap of at least 0.25 % in SPY daily bars from January 2001 to October 1, 2026, and checked whether price traded back to the prior close on the gap day, within 5 sessions and within 20 sessions. Of 6,474 sessions, 3,585 opened with such a gap. We excluded the 62 gaps that fell on ex-dividend days, because part of those down gaps is simply the dividend. That leaves 1,967 up gaps and 1,556 down gaps.
 Click to enlarge
Filled within 5 or 20 days means within the gap day plus the next 4 or 19 trading sessions. All shares are in percent of the gaps in each size group, the number in brackets is the count; the 20-day column leaves out a few gaps from the last weeks of the data.
| Up gap, % (count) | Same day | 5 days | 20 days |
|---|---|---|---|
| 0.25 to 0.5 (993) | 59.5 | 82.0 | 89.6 |
| 0.5 to 1 (694) | 45.5 | 71.9 | 84.2 |
| 1 to 2 (222) | 30.2 | 55.0 | 69.7 |
| 2 and more (58) | 34.5 | 58.6 | 63.8 |
| All (1,967) | 50.5 | 74.7 | 84.7 |
| Down gap, % (count) | Same day | 5 days | 20 days |
|---|---|---|---|
| 0.25 to 0.5 (705) | 67.2 | 90.1 | 96.7 |
| 0.5 to 1 (537) | 47.3 | 77.5 | 91.0 |
| 1 to 2 (248) | 40.3 | 73.4 | 89.9 |
| 2 and more (66) | 39.4 | 65.2 | 83.3 |
| All (1,556) | 54.9 | 82.0 | 93.1 |
Three findings stand out. First, small gaps filled most often: about 60 % of up gaps and 67 % of down gaps between 0.25 and 0.5 % traded back to the prior close the same day. Second, the share tends to fall as the gap size grows, though not in every step: up gaps of 2 % and more filled slightly more often than those between 1 and 2 %, in a much smaller group. Third, full gaps filled less often later on: 42.1 % of full up gaps within 5 sessions and 62.7 % within 20.
Down gaps filled more often over 20 sessions than up gaps: 93.1 % against 84.7 %. One possible contributor is a market that rose over most of the period: SPY went from about 129 at the start of 2001 to about 763 at the end of September 2026. The count itself does not prove the cause. It is a property of this sample, not a law of gaps.
The share also changed over time. Up gaps filled on the same day in 58.1 % of cases from 2001 to 2013, but only in 43.1 % from 2014 to 2026; for down gaps the shares were 60.9 % and 47.7 %. Up gaps when the prior close was above its 200-day average filled the same day less often (45.0 %) than up gaps below it (60.4 %).
What the measurement does not show
The full-gap figures describe a group you cannot know at the open. A gap is full only if the whole gap day stayed beyond the prior high or low, so these gaps had already survived one complete session without a fill. That they cannot fill the same day is true by definition. Use the full-gap numbers as a description of completed sessions, not as a filter for an entry at the open.
A fill rate is not a win rate. The table says how often price reached the prior close. It does not say how far price moved against a fade trade before it got there, because daily bars do not show the order of the high and the low within the day. A gap that runs another 1 % before it fills can still stop you out first. Costs, slippage at the open and your exact stop rule are not included either.
The sample is one instrument in one market. SPY is a very liquid ETF that tracks a broad index. Single stocks, especially around earnings, often gap further, and their fill rates can differ; we did not measure them. Futures and forex hardly show weekday gaps at all. Count again for your own market before you trust any number, including ours. The full rules of the count are in the measurement method near the end of this guide.
Gap trading strategies
Every gap trade is one of two bets: the gap fills, or it keeps going. The gap fill trade, also called fading the gap, trades back toward the prior close. The gap and go trade trades in the direction of the gap. Galen Woods, a price action trader and author from Singapore, describes on Trading Setups Review separate rules for breakaway, runaway and exhaustion gaps. The plans below follow that idea and adapt it.
Two execution facts apply to every plan. An order placed for the open fills at a price you do not know in advance; in a fast open it can be far from the last quote. And a stop order does not protect you against a gap: if the market opens beyond a stop-market order, it becomes a market order and fills at the next available price; a stop-limit order may not fill at all.
Gap fill: fading a common gap
Our numbers point to small gaps; the other filters are my proposal, not something the count tested. The count shows higher fill rates for small gaps. It did not classify news or trading ranges, so the extra conditions below are a setup to test on your own data, not a measured edge. A 0.4 % gap up after a quiet night has much less behind it than a 4 % gap on earnings.
- Classify first: gap size in percent, the news behind it, and where the open sits in the recent range. Skip gaps on earnings or major news.
- Wait for the first reaction: many traders wait for the first 15 or 30 minutes. A failed attempt to extend the gap is the signal; for a gap up that is a break below the low of that opening range.
- Target: the prior close, the fill level. Partial exits inside the gap are a matter of your plan.
- Stop: beyond the high of the opening range for a gap up, beyond its low for a gap down.
- Check the ratio before you enter: the distance to the prior close should be at least 1.5 times the distance to the stop. That threshold is my editorial rule for this guide, not evidence of profitability. If it is not met, skip the trade.
If price keeps running in the gap direction, the fade is wrong. Do not move the stop to give the trade “more room”. In the measurement, gaps of 1 % and more filled the same day in only about a third of up gaps and 40 % of down gaps.
Gap and go: trading a breakaway gap
A breakaway gap is the gap you do not want to fade. Three clues help: price gaps out of a consolidation, the gap day has clearly higher volume than the bars before it, and the gap does not fill in the next sessions. The third clue only arrives later, so it confirms rather than triggers. Bulkowski advises trading high-volume breakaway gaps in the direction of the trend; in his data they performed best in a bull market near the yearly high.
There are two ways in: right after the gap day, or on a pullback. The aggressive one, for a gap up: the gap day closes near its high and outside the range; that close is the signal. The initial stop goes below the consolidation, or below the gap day’s low for a tighter but more fragile stop. The conservative one: wait for a pullback toward the gap and a bar that turns up again, then place a buy stop above that bar with a stop below its low. You get a tighter stop, but strong breakaways often do not pull back.
The opening check decides whether the planned trade still exists. This is my adaptation of the source rules, which enter at the close of the gap day. Plan entry, stop and the most you will pay before the next session. Then watch the opening print and only after that submit your order; the fill can still differ from that print. For a long trade, skip if the open is below the gap day’s low or at or below your stop, or if it is so far above the signal close that the planned risk per share is exceeded. Otherwise use a limit order at your maximum price. For a short trade, mirror it: skip if the open is above the gap day’s high or at or above your stop, or far below the signal close. A pullback order is valid for one session only and is cancelled if price trades through the planned stop before it fills.
How big a gap is matters in relative terms, not in dollars. A gap in dollars says little. Galen Woods suggests three ratios: the gap in percent of price, the gap in multiples of the average true range (ATR), and the gap relative to the height of the consolidation. The larger the ratio, the more significant the gap.
Where to take profits: a trailing stop below swing lows lets a new trend run; a target from the height of the consolidation gives you a fixed number in advance. Decide before the entry.
Runaway gap: the measuring rule
A runaway gap often appears near the middle of a move, which is why it is also called a measuring gap. Bulkowski’s rule: measure from the swing low where the move started to the middle of the gap, then project the same distance from the middle of the gap. He reports that the middle of the gap sat between 50 and 52 % of the short-term move in his sample.
Galen Woods’s conditions for a bullish runaway gap are strict. The trend rises steeply with few pullbacks, then gaps again on increased volume, but not on exceptionally high volume, which can point to an exhaustion gap instead. He buys on the close of the gap day; here the close is the signal and the entry follows the opening check above. His initial stop goes at the low of the gap. The weak point: if no gap forms, there is no target, and runaway gaps do fill. Galen Woods’s own losing example in AXP filled the gap within eight sessions.
Exhaustion gap: a reversal setup
An exhaustion gap is the last burst of a trend. In an uptrend it is a gap up on extreme volume after a long run; then price turns and fills the gap within a few bars. In his exhaustion gap strategy, Galen Woods measures “extreme” with a 233-period Bollinger Band with three standard deviations on the volume bars and requires the gap to be filled within five bars.
The rules for a bearish reversal, adapted from Galen Woods: a short entry or an exit from a long position.
- An uptrend with a gap up on volume above that band.
- The fill: within five bars, a close below the last close before the gap. That close is the signal.
- Entry after the opening check at the next session: plan the stop and the lowest price you will sell at, watch the opening print, then submit a limit order. Skip if the open is at or above the planned stop, or so far below the signal close that the planned risk is exceeded. The fill can differ from the opening print.
- Stop above the extreme high of the trend, not just above the last bar, because the first days after an exhaustion gap often move sideways.
For a bullish reversal, mirror everything. The trade fails when the gap was only a common gap: Galen Woods shows a ZION example in which the down gap filled on the fifth day and price still made a new low afterward.
Plan the loss before the entry
Gaps are the reason why the planned loss and the real loss can differ. The formula is: planned loss = shares × stop distance × point value. For stocks the point value is 1. With 100 shares and a stop $3.00 away, the planned loss is 100 × $3.00 × 1 = $300. If the stock opens $5.00 beyond your stop the next morning, the real loss is about $800 before costs. Keep each planned loss to a small, fixed share of your account, and hold fewer shares through earnings, data releases and weekends.
A real SPY example: one gap filled, one did not
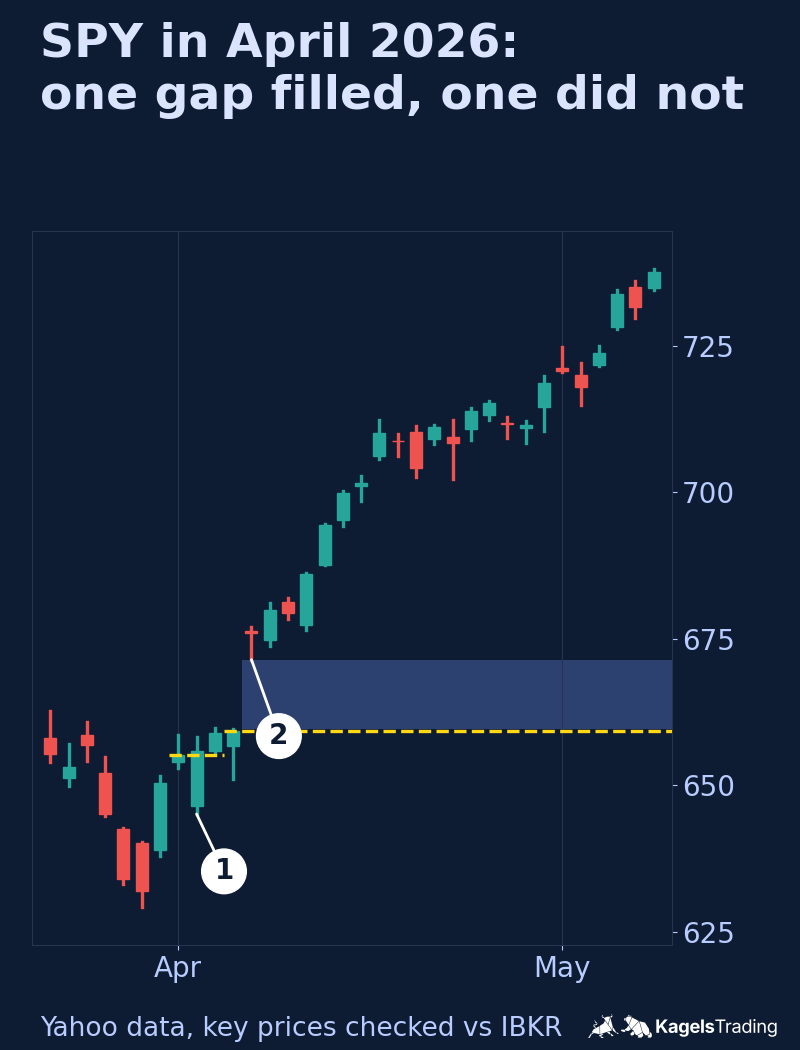
Two gaps within four trading days in April 2026 show both sides of gap trading. SPY had fallen to a low of 629.28 on March 30 and recovered in the following days. On April 2 it opened 1.35 % lower, on April 8 it opened 2.60 % higher.
 Click to enlarge
Gap 1, April 2: a gap down that filled the same day. The April 1 close was 655.24. SPY opened at 646.42, traded up to 658.20 and closed at 655.83, slightly above the prior close. In our measurement this was a gap of 1 to 2 %, a size at which 40.3 % of down gaps filled the same day. It was not a full gap, because the April 2 high of 658.20 reached above the April 1 low of 653.00, so the two bars overlapped.
Gap 2, April 8: a full gap that stayed open. The April 7 close was 659.22 and its high 659.61. SPY opened at 676.39 and its low of 671.46 stayed above the April 7 high. In the 20 sessions after the gap day the lowest low was 673.77, on April 9. On May 8 SPY closed at 737.62, and through October 1, 2026, it had not traded back to 659.22. Whoever faded this gap at the open needed a stop.
What does the example teach? First: the larger gap was also the full gap, and it stayed open, which fits the lower fill rates for large and full gaps in the table. Second: gap 2 had the features of a breakaway gap: it jumped out of the late March and early April range and above its recent highs. Whether it was one was clear only days later. Third: I chose the two gaps because they show both outcomes side by side. It is one selected case, not a statistic; the statistic is the table above.
Weekend gaps and overnight risk
Between the Friday close and the Monday open, news keeps coming but the regular session does not. That is why weekend and holiday gaps exist. In our SPY count, gaps after a weekend or holiday did not behave very differently: 45.2 % of up gaps and 47.8 % of down gaps filled the same day, against 50.5 % and 54.9 % for all gaps.
The risk is the same as with every gap: you cannot react while the market is closed. If you hold a position over the weekend, plan the worst open you can accept, not just your stop. Some traders reduce position size before weekends and scheduled events, others hedge with options. Ex-dividend days create mechanical down gaps in ETFs and dividend stocks; they are not a signal. Our guide to swing trading explains how stop-market and stop-limit orders behave at such gaps, and the guide to risk management in trading shows how one shock in 2015 jumped over stops in EUR/CHF.
Common gap trading mistakes
Most gap mistakes come from treating every gap the same way. Here are the ones I see most often, each with a correction you can apply to your next gap:
- “Gaps always fill”: they do not do so on any schedule. In our count, 15.3 % of SPY up gaps had not filled within the 20-session window.
- Fading big news: a 5 % gap on earnings is not a common gap. Check the reason before you trade against it.
- Ignoring the data source: a gap on a regular-session chart may not exist on an extended-hours or futures chart. Know which chart your levels come from.
- Entering at the open blind: a market order at the open fills at an unknown price. Wait for the first bars or use limits.
- Trusting a stop through the night: a stop limits the loss only while the market trades through it. Size for the gap, not only for the stop.
- Deciding the type after the entry: label the gap before the trade and write down what would prove you wrong.
Gap measurement method
These are the full rules of our count, so you can repeat it. Data: SPY daily bars from Yahoo Finance, regular session, raw prices without dividend adjustment, January 2, 2001 to October 1, 2026 (6,474 sessions with a prior close); key prices of the example checked against Interactive Brokers. A gap is an open at least 0.25 % above or below the prior close. Size groups include the lower bound and exclude the upper one, so a gap of exactly 1.00 % counts as 1 to 2 %. Filled means the gap day’s low (up gap) or high (down gap) reached the prior close, or the same within the gap day plus the next 4 or 19 sessions. Full gap means the gap day’s low was above the prior high, or its high below the prior low, which is known only after the close. We excluded the 62 qualifying gaps that fell on SPY ex-dividend days (the data contain 104 dividend dates in total). Gaps too close to the end of the data for a full window are left out of that column: of 1,967 up gaps, 1,966 count for 5 days and 1,962 for 20 days; of 1,556 down gaps, 1,555 and 1,552. “After a weekend or holiday” means more than one calendar day between the two sessions, which also includes rare exceptional closures. The 200-day average is the mean of the 200 closes before the gap day.
Conclusion: name the gap before you trade it
A gap is a question, not a signal. Did the market jump on noise that will fade, or on news that starts a new trend? Our SPY count shows that small gaps filled most often, larger gaps and full gaps less often, and that no rule held in every period.
The type gives you the trade, the open gives you the risk. A common gap can be faded toward the prior close, a breakaway gap traded with the move, a runaway gap used for a target, an exhaustion gap used for a reversal. In each case the plan needs an invalidation level and a position size that survives the next gap against you.
In my more than 45 years in the markets, gaps have been among the most honest pieces of the chart. They show where the market jumped instead of trading step by step in the regular session. What they do not show is whether it will come back, and that is the part you have to plan for.
Frequently asked questions about gap trading
What is gap trading?
Gap trading means trading the move after a price gap, either back into the gap or in the direction of the gap. A gap is a jump between the prior close and the next open. Gap fill traders expect price to return to the prior close; gap and go traders expect the move to continue.
Do gaps always fill?
No, gaps do not always fill, and many take longer than traders expect. In our count of SPY daily bars since 2001, about half of all gaps of 0.25 % or more filled the same day and about 85 % of up gaps and 93 % of down gaps within 20 sessions. Large gaps and full gaps filled less often, and some had not filled within the 20-session window.
Is a gap down bullish or bearish?
It depends on where it happens. A gap down out of a range at the start of a decline is bearish. A gap down after a long decline on extreme volume that fills within a few days can be an exhaustion gap and mark a low. The following bars decide.
Is gap trading profitable?
This guide has not shown that gap trading is profitable. Some rule sets may have had a positive result in the past; our count measures fill rates, not trade results. Price can move far against a fade before the gap fills, and costs and slippage at the open add up. Test your exact rules, including losing trades, before you risk money.
What is a gap and go strategy?
Gap and go means buying a gap up, or selling a gap down, that keeps moving in the direction of the gap. It works best with breakaway gaps: a gap out of a range on high volume, often on news. The risk is that the gap fills and the trade reverses at once.
What is the difference between a gap and a fair value gap?
A price gap is a jump between two bars: the open is away from the prior close. A fair value gap is a three-bar pattern from the Smart Money Concepts vocabulary: the ranges of the first and third bar do not overlap, and the middle bar is usually the fast move between them. Related idea, different definition. Our guide to the fair value gap shows how the two overlap on daily SPY charts.
Can you trade gaps on all time frames?
Gaps appear mostly on daily and higher charts, between two sessions. On intraday charts of liquid markets they are rare inside the session and appear mainly at the open. Weekly charts show weekend gaps between the Friday close and the Monday open.
Is gap trading illegal?
Trading a price gap is not prohibited in itself. Gap trading is a chart-based method: gaps form because news arrives while the regular session is closed. The ordinary rules for the instrument, the account and the transaction still apply, as with every other trade. This is not legal advice.
This US edition is based on our German edition on kagels-trading.de and has been adapted for US readers.
More Chart Techniques guides
- Draw key levels
Support and Resistance: How to Draw and Use Key Levels
Where useful levels come from, how to draw zones with a stated rule and how to turn a level into a trade plan.
- Read price action
Price Action Trading: How to Read Charts Without Indicators
Market structure, key zones and three bar patterns, with a core setup and a real SPY example where the signal failed.
- Read candlestick charts
How to Read Candlestick Charts: Body, Wicks and Context
Open, high, low and close in one candle, body and wicks, two real Gold candles read step by step and how often patterns really occur.
- Know candlestick patterns
Candlestick Patterns: 10 to Know, Tested on Real Data
Ten patterns with rules and a cheat sheet, counted on DAX, S&P 500, EUR/USD and Gold since 2014: most are rare, none is a signal on its own.
- Trade breakouts
Breakout Trading Strategy: Entries and False Breakouts
How often breakouts fell back into the range in our count of 1,472, and how to plan entry, stop and position size.
- Draw and trade trendlines
Trendline Trading: How to Draw Trendlines and Trade Them
How to draw trendlines with a fixed rule, four strategies for bounces, breaks and retests, and a real SPY line break without a lasting reversal.
- Use Fibonacci levels
Fibonacci Retracement Levels: How to Draw and Trade Them
How to calculate and draw retracement levels, trade pullbacks with confluence and a stop at the structure, and what a ten-year test says about the levels.
- Set Fibonacci targets
Fibonacci Extension: Levels, How to Draw It and Calculator
Three-point extension targets from the end of a pullback, why they differ from levels beyond 100%, a free calculator and three SPY swings, one without a single target reached.
- Calculate pivot points
Pivot Points: Formulas, Types and How to Trade Them
Formulas for standard, Fibonacci, Woodie, Camarilla and DeMark pivots, a free calculator, which session counts and a real SPY day.
- Swing trade
Swing Trading: 4 Strategies, Risk and Real Examples
Four swing trading strategies on the daily chart, position size, gap risk and US rules, with two hypothetical SPY pullbacks: one hit its target, one was stopped out.
- Identify market stages
Stage Analysis: Stan Weinstein's Four Market Stages
Stan Weinstein's four stages on the weekly chart, a Stage 2 checklist and two TSMC breakouts: one ran for a year, one gapped through its stop.
- Read Wyckoff ranges
Wyckoff Method: Accumulation, Distribution and Springs
Accumulation and distribution with phases A to E, springs and upthrusts as optional tests, and two real TSMC ranges read with and without hindsight.
- Trade Darvas boxes
Darvas Box Strategy: Rules, Entries and Stop Losses
The box rules step by step, when the edges become known, where the stop goes, and a mechanical test on TSMC in 2024 with two honest results.
- Count Elliott waves
Elliott Wave Theory: Rules, Patterns and Fibonacci
The five-wave pattern, three hard rules, zigzags, flats and triangles, Fibonacci ratios and a real DAX count, from the first German translator of the standard work.
- Trade order blocks
Order Blocks: How to Spot, Draw and Trade the Zone
The three conditions behind a valid order block, entry and stop at the zone, two SPY cases from 2026 and a 25-year count where a fixed rule lost money.
- Trade fair value gaps
Fair Value Gap (FVG): How to Spot, Trade and Test It
The three-candle rule, bullish, bearish and inverse FVG, two SPY cases from 2026 and a 25-year count of how often gaps were revisited and traded.
- Read liquidity sweeps
Liquidity Sweep: How to Spot It and Trade the Reversal
Sweep or run, buy-side and sell-side liquidity, internal and external targets, SPY reversal, continuation and failed-reversal examples and a 25-year count of a fixed sweep rule.
- Interpret volume
Volume Analysis in Trading: How to Read Volume Honestly
What volume counts in stocks, futures, forex and crypto, how to read it against its own average, and our SPY test of high-volume days since 2001.