
EUR/USD Forecast Today: Euro to Dollar Outlook


EUR/USD closed the week at 1.1239, above the 2024 high at 1.1214 and above the 1.12 level. The week opened at 1.1186. On Wednesday the dip was caught just before 1.1100 and bought back at once, which left a long bar on the weekly chart. The 1.12 level supports a positive outlook: prices above it point to a recovery into the 1.1350 area.
EUR/USD forecast in 30 seconds
Short term
Above the 2024 high, weekly close 1.1239 (FXCM). Above 1.12, a recovery into the 1.1350 area is expected.
Medium term
Seven weeks down since the August high, then a recovery from 1.1113. A clear drop below 1.1113 leaves room to 1.1065.
Long term
The rising trend channel on the monthly chart since 2022 is intact. The support zone is 1.1214 to 1.1276.
Super long term
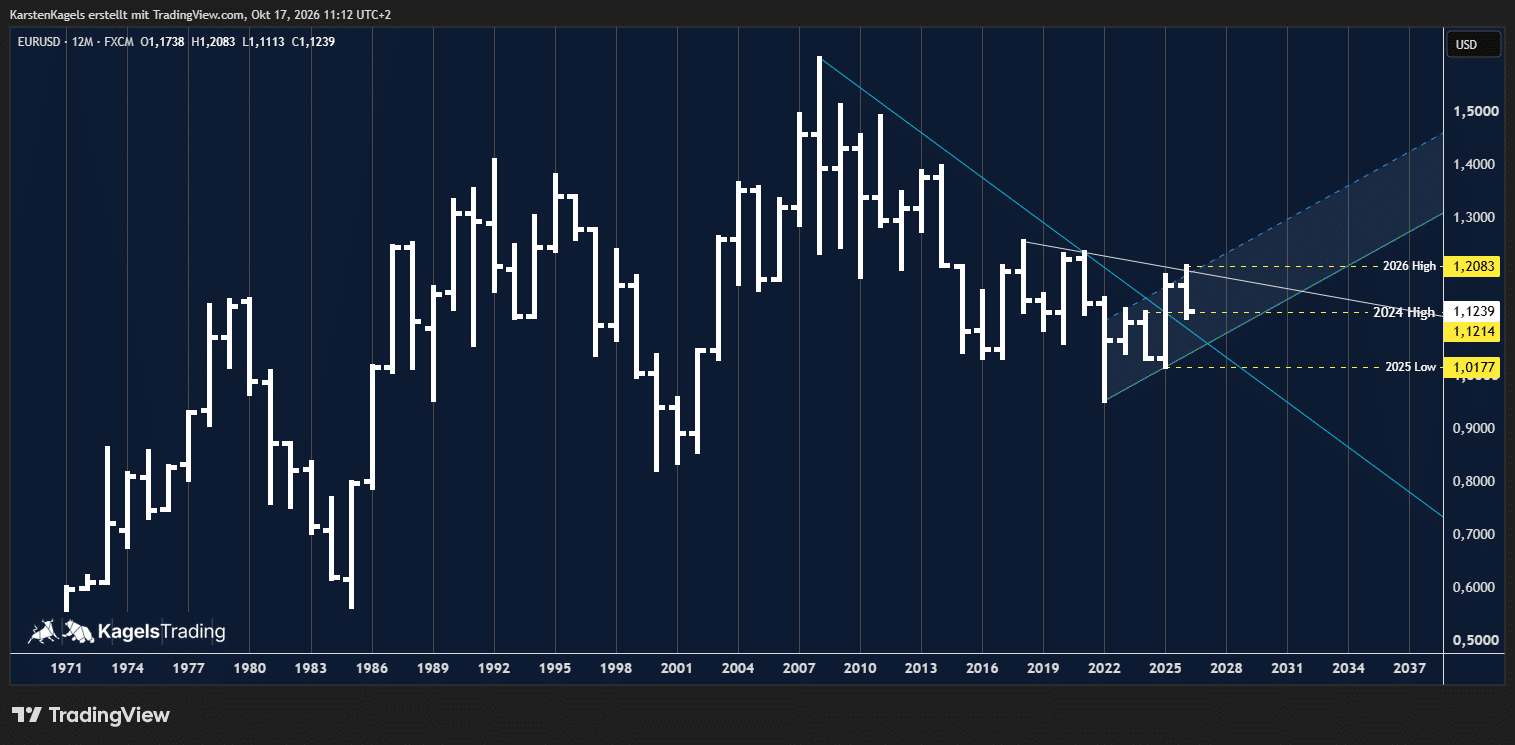
The downtrend line since 2008 is broken. A new uptrend needs a high above 1.2083.
On this page
- EUR/USD forecast in 30 seconds
- EUR/USD forecast today: the 1.12 level at the 2024 high
- Daily chart: the 1.12 level decides
- EUR/USD forecast 2026, medium term: a long bar and a firm weekly close
- What can move EUR/USD next: three dates
- Three scenarios: which level decides
- EUR/USD forecast 2027: the monthly chart and the trend channel
- EUR/USD forecast 2028 to 2050: the broken downtrend line
- Dollar to euro forecast: what the levels mean for the dollar
- How this forecast is made
- Conclusion: assessment by Karsten Kagels
- Frequently asked questions
- Please note
EUR/USD forecast today: the 1.12 level at the 2024 high
For Monday, 19 October 2026
 Click to enlarge
All charts on this page are by Karsten Kagels, with FXCM prices. All five charts were exported on 17 October 2026 between 10:57 and 11:12 CEST and show the Friday close of 16 October at 1.1239. On the yearly chart the assessment has not changed.
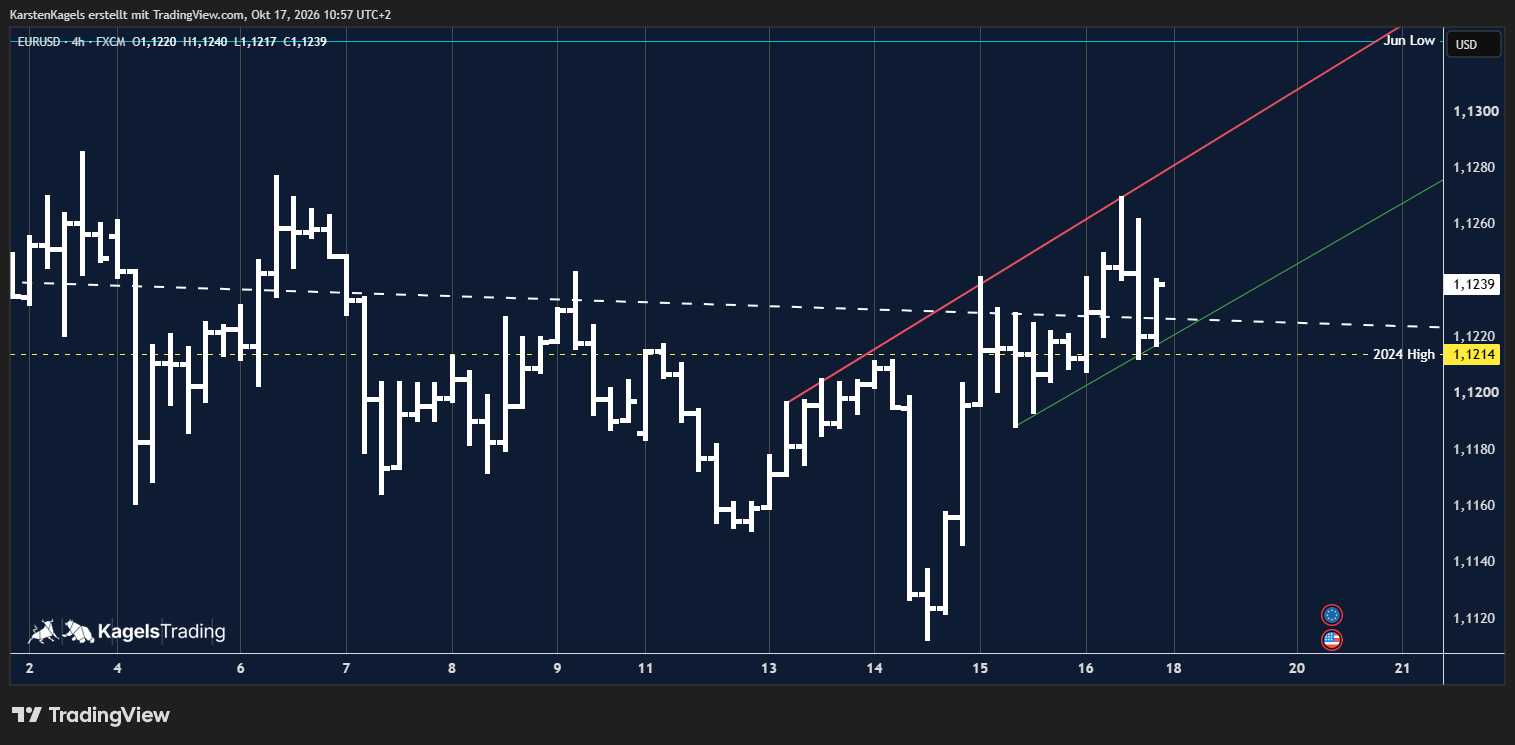
On the 4-hour chart the price has moved above the 2024 high. The red line is now a rising resistance line, and the green rising line forms the support. A trend channel could form between the two.
On Wednesday the drop to 1.1113 was caught just before the 1.1100 level and bought back at once. On Friday EUR/USD closed at 1.1239, above the 2024 high at 1.1214.
Only a return below 1.12 would point to a broader sideways phase. As long as EUR/USD stays above 1.12, the channel takes priority. If the price falls back below it, that would suggest a broader sideways phase between 1.11 and 1.13. This short-term reading is separate from the bearish weekly-close condition in the scenarios below.
Resistance
- 1.1325
Price at analysis1.1239
Support
- 1.1214
- 1.1200
Daily chart: the 1.12 level decides
For Monday, 19 October 2026
 Click to enlarge
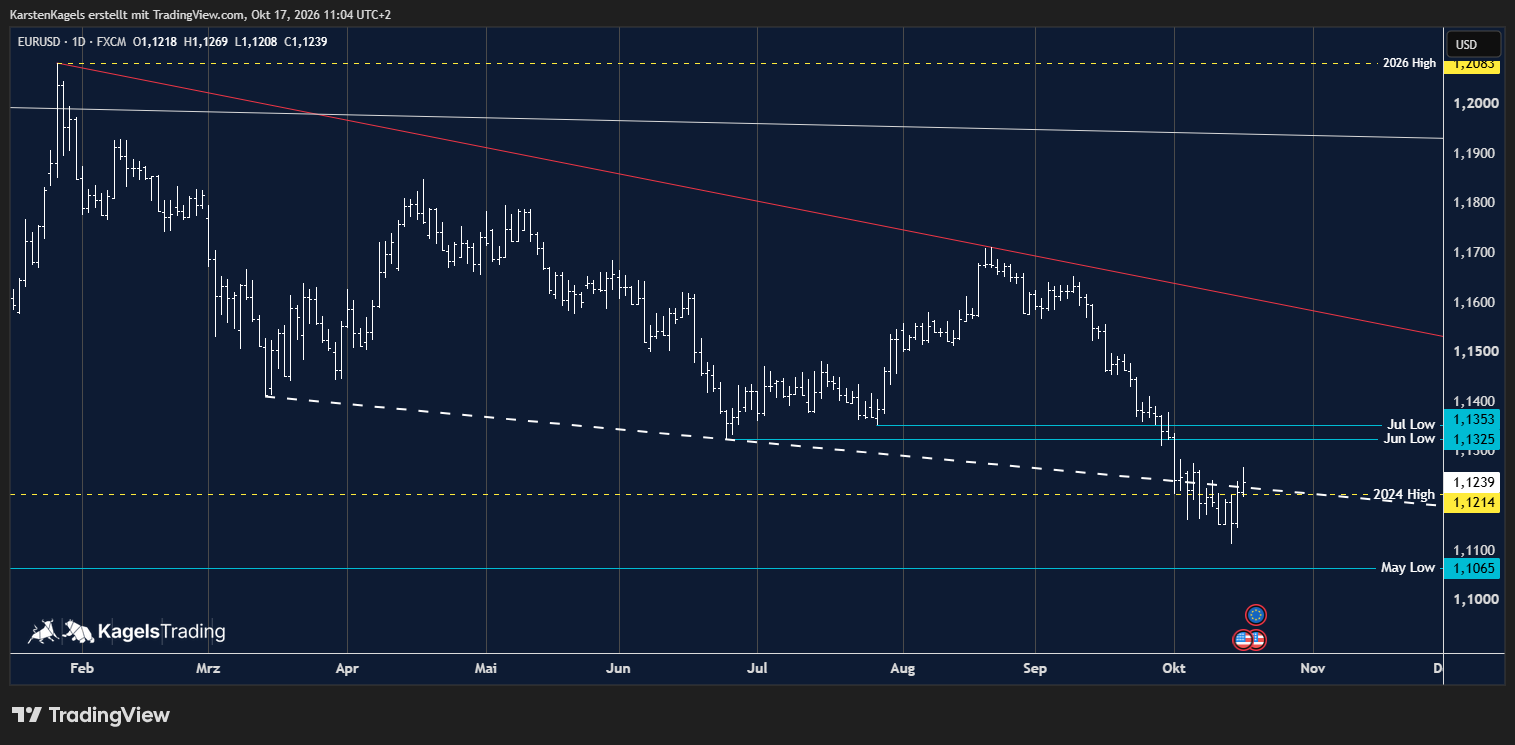
On the daily chart EUR/USD is trying to push back against the recent downward tendency. The price is above the 2024 high at 1.1214 and just above the white dashed line. Here the 1.12 level remains the deciding factor.
The week opened at 1.1186 and fell to 1.1113 on Wednesday. On Friday EUR/USD opened at 1.1218, rose to 1.1269, fell to 1.1208 and closed at 1.1239.
Prices above 1.12 point to a recovery into the 1.1350 area. The white dashed line connects the March low with the June low, and the price is just above it. Up there the broken lows wait as resistance: the June low at 1.1325 and the July low at 1.1353, 86 and 114 pips above the weekly close. Next comes the 2022 high at 1.1492. If the price falls back below 1.12, the recovery attempt has failed for now.
Resistance
- 1.1492
- 1.1353
- 1.1325
Support
- 1.1214
- 1.1200
- 1.1113
- 1.1065
EUR/USD forecast 2026, medium term: a long bar and a firm weekly close
Week of 19 October 2026
 Click to enlarge
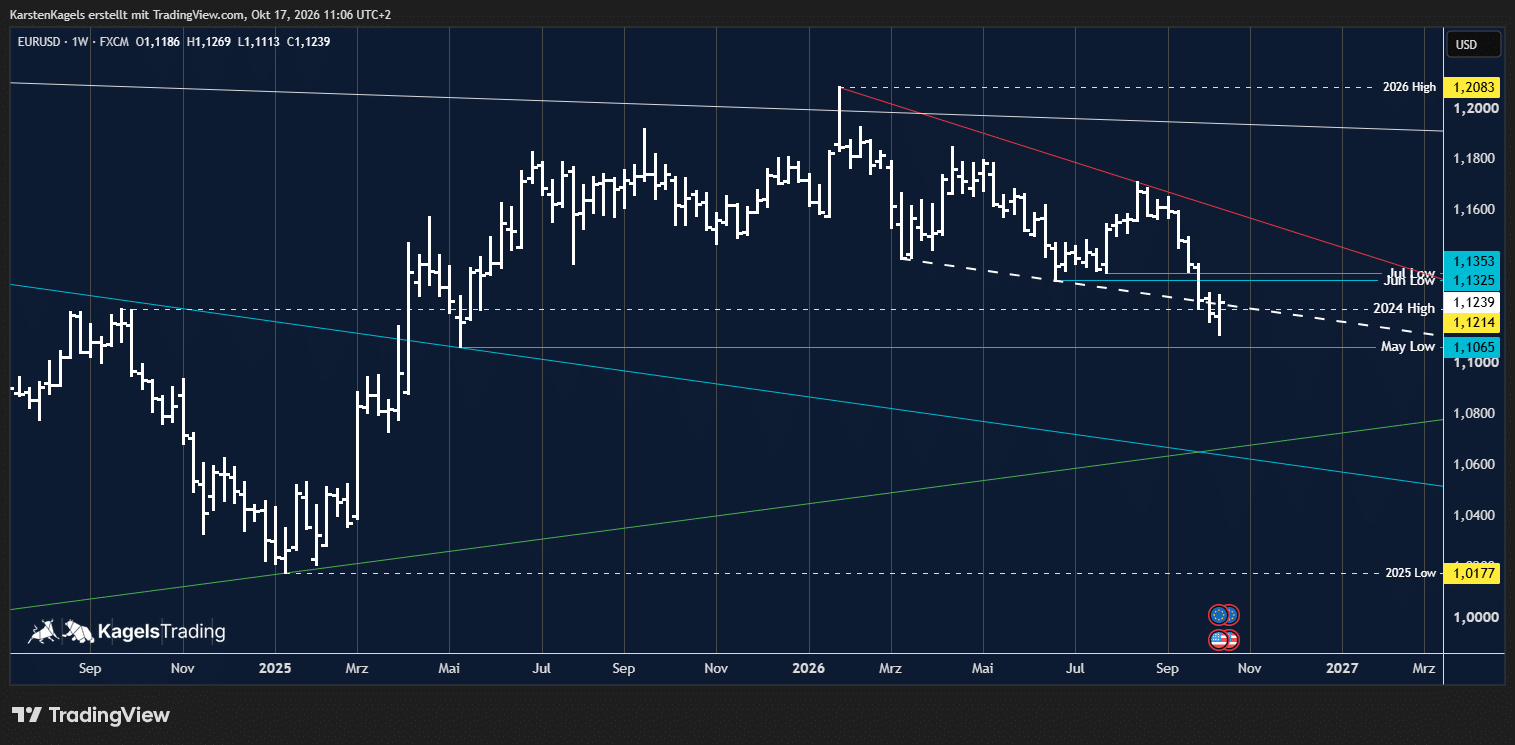
The weekly chart shows the bigger picture. It includes the 2024 high at 1.1214, the May 2025 low at 1.1065 and the lines from the daily chart: the white dashed line, the red falling line from the 2026 high and the July and June lows.
Last week's bar shows a recovery from 1.1113, above the May 2025 low at 1.1065. Before that, EUR/USD had fallen for seven weeks, since the high in August, down to the 2024 high. Last week opened at 1.1186, reached a high of 1.1269 and a low of 1.1113, and closed at 1.1239.
The firm close gives a positive outlook for the coming week. If the zone around the 2024 high and the 1.12 level holds, the broken lows at 1.1325 and 1.1353 remain the first resistance levels. If the price drops clearly below the weekly low at 1.1113, there is further room toward the May 2025 low at 1.1065.
Resistance
- 1.1492
- 1.1353
- 1.1325
Support
- 1.1214
- 1.1113
- 1.1065
- 1.0177
What can move EUR/USD next: three dates
Three dates are coming up in the next few weeks. They are reasons to read the chart again, not a forecast of a particular reaction. US dates are in Eastern Time with central European time in brackets, the ECB date in Frankfurt time. Europe switches to winter time on 25 October, the US on 1 November.
28 October, usually 2:00 p.m. ET (19:00 CET): Fed rate decision after the meeting of 27 and 28 October (FOMC calendar).
29 October, 14:15 CET (9:15 a.m. ET): ECB rate decision after the meeting of 28 and 29 October (ECB calendar).
6 November, 8:30 a.m. ET (14:30 CET): US jobs report for October (BLS schedule).
The background is the rate gap. The Fed raised its target range to 3.75 to 4.00 percent on 16 September, and the ECB deposit rate has been 2.50 percent since 16 September. The dollar's rate lead is therefore 1.25 to 1.50 percentage points. More in our articles on the Fed rate decision and the ECB rate decision.
Three scenarios: which level decides
Two conditions describe the next big move; the third scenario is waiting in between. What counts in each case is the weekly close on the FXCM chart shown here; moves within the week do not count. These are reference levels, not order rules, and the chart picture has to be reassessed after every weekly close.
Bullish: weekly close above 1.19
A weekly close above 1.19 opens targets in the 1.24 area. Before that, EUR/USD would first have to rise back above the broken lows at 1.1325 and 1.1353 and the 2022 high at 1.1492.
Wait: between 1.12 and 1.19
Between 1.12 and 1.19, neither of the two conditions is active. The weekly close of 16 October was 1.1239, inside this range and above the 1.12 level. Until the next weekly close, the 1.12 level on the daily chart counts in the short term. The break of the old range below 1.1325 is not affected by this.
Bearish: weekly close below 1.12
A weekly close below 1.12 breaks the zone of the 2023 and 2024 highs. Then the pair could fall significantly further; below that there are still some yearly highs as support, but the chart picture becomes clearly weaker. The weekly close of 16 October was 1.1239, above it, so the zone has held.
Resistance
- 1.2083
- 1.1918
- 1.1492
- 1.1353
- 1.1325
Support
- 1.1214
- 1.1113
- 1.1065
EUR/USD forecast 2027: the monthly chart and the trend channel
 Click to enlarge
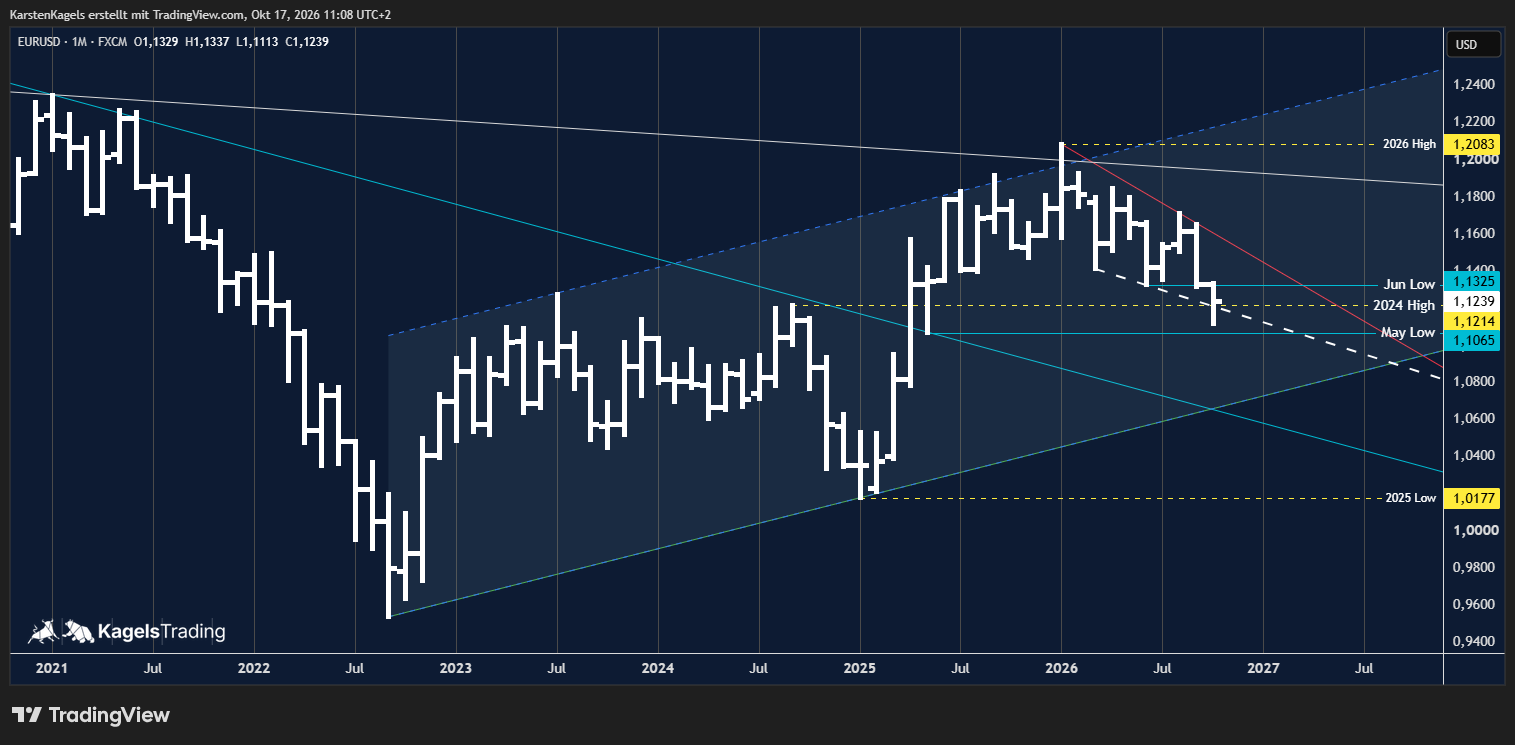
The long-term monthly chart shows the rising trend channel. It starts at the 2022 low and is drawn as a shaded area. If the market keeps moving inside this trend channel, upside potential can be derived. The recent downward tendency is the correction of the rise in 2025.
The monthly snapshot of 17 October shows EUR/USD back above the 2024 high. The 2024 high at 1.1214 is drawn on the chart and, together with the 2023 high, forms the important support zone. The 2023 high at 1.1276 is not labeled here; the value comes from Karsten's chart of 1 October 2026. October opened at 1.1329, has reached a low of 1.1113 so far and stands at 1.1239. The long-term assessment stands.
For 2027, what matters is whether this zone holds. A weekly close below 1.12 counts as a break, and then the pair could fall significantly further. The close of 16 October was 1.1239, above it, so the zone has held. Below that there are still some yearly highs as support, but the chart picture would then become clearly weaker.
A return above the red resistance line would be the signal for a possible second move with targets above 1.22. A breakout above the June low at 1.1325 would be an earlier recovery milestone. A weekly close above 1.19, on the other hand, would open targets in the 1.24 area.
Resistance
- 1.2083
- 1.1492
- 1.1325
Support
- 1.1214
- 1.0177
EUR/USD forecast 2028 to 2050: the broken downtrend line
 Click to enlarge
The super long-term yearly chart shows the break of the long-term downtrend line. The turquoise line falls from the 2008 high. At the current reading, EUR/USD is above this downtrend line.
For a new long-term uptrend, the 2026 high has to be cleared. It lies at 1.2083 and was set in January. EUR/USD opened 2026 at 1.1738 and has fallen back clearly on the yearly chart since then.
No chart delivers a reliable number for 2030 or 2050. One can only name the levels that shape the big picture: the 2026 high at 1.2083 above and the 2022 low at 0.9535 below. Only a sustained break below 1.10 would bring parity back into play.
Resistance
- 1.2083
Support
- 1.1214
- 1.0177
Dollar to euro forecast: what the levels mean for the dollar
The dollar to euro rate is the inverse of EUR/USD. It shows how many euros one US dollar costs, and it equals 1 divided by the EUR/USD rate.
If EUR/USD falls, the dollar gets more expensive, and if EUR/USD rises, it gets cheaper. As long as EUR/USD stays between the 2024 high at 1.1214 and the 2025 high at 1.1918, one dollar costs about 0.84 to 0.89 euros, and below 1.1214 it costs more than 0.8917 euros. The major banks expect EUR/USD at 1.16 on average in six months, about 0.862 euros per dollar (Bloomberg survey in the Deutsche Bank currency bulletin, as of 23 September 2026).
| Level | EUR/USD | 1 US dollar in euros |
|---|---|---|
| 2026 high | 1.2083 | 0.8276 |
| 2025 high | 1.1918 | 0.8391 |
| June 2026 low | 1.1325 | 0.8830 |
| 2024 high | 1.1214 | 0.8917 |
| 2025 low | 1.0177 | 0.9826 |
How this forecast is made
The charts are my own, with FXCM price data, sorted by horizon. The 4-hour, daily, weekly, monthly and yearly charts each show the trend lines, channels and highs and lows of previous years that matter for that horizon. How such levels work is explained in our guide to support and resistance. The charts were made with TradingView, and this page follows our editorial policy.
Conclusion: assessment by Karsten Kagels
As an active trader since 1980, I see EUR/USD at a clear decision level. EUR/USD has left the sideways range that held since June 2025 to the downside, and since the high in August the price fell for seven weeks. At the 2024 high it found its way back after a dip to 1.1113 and closed the week at 1.1239. On the 4-hour chart a trend channel could form, and the long bar on the weekly chart shows a recovery from the low. In the long term the rising trend channel from 2022 is intact, and on the yearly chart the downtrend line from the 2008 high is broken.
My assessment for the coming weeks: what matters is the zone of the 2023 and 2024 highs at 1.1214 to 1.1276. For me a weekly close below 1.12 counts as a break. The close of 16 October was 1.1239, above it; the 1.12 level supports the positive outlook, and prices above it point to a recovery into the 1.1350 area. If EUR/USD falls clearly below the weekly low at 1.1113, there is room down to the May 2025 low at 1.1065. Only a weekly close above 1.19 would be my signal for targets in the 1.24 area, and for a new long-term uptrend the 2026 high at 1.2083 has to be cleared.
Frequently asked questions
Will the dollar rise or fall?
On the chart, the dollar has recently gained. The weekly close on 2 October 2026 below the June low at 1.1325 confirmed the break of the sideways range. The dollar would gain further above all with a weekly close below 1.12, which would break the zone of the 2023 and 2024 highs. The weekly close of 16 October was 1.1239, above it, so the zone has held. A clear signal of dollar weakness would only be a weekly close above 1.19. On average the banks expect slight dollar weakness: their mean for six months is 1.16 (as of 23 September 2026).
Where will the dollar be at the end of 2026?
Neither the chart nor the bank survey gives a target for 31 December. For the end of 2026, the conditions from the chart count: as long as EUR/USD stays between the 2024 high at 1.1214 and the 2025 high at 1.1918, one dollar costs about 0.84 to 0.89 euros. A weekly close below 1.12 would strengthen the dollar further, and only a weekly close above 1.19 would weaken it clearly.
What is the EUR/USD forecast for 2027?
For 2027, what matters most is whether the 2023 and 2024 highs hold. A weekly close below 1.12 counts as a break of the zone, and then the chart picture becomes clearly weaker. The close of 16 October was 1.1239, above it, so the zone has held. A weekly close above 1.19 would activate targets in the 1.24 area, and in the long term the rising trend channel from 2022 is intact.
What does 1 euro cost in dollars right now?
The latest weekly close is in the summary near the top of this page. The chart export time is shown just above it. The rate shows how many US dollars one euro is worth. In reverse: 1 US dollar in euros equals 1 divided by the EUR/USD rate. At a rate of 1.13, one dollar costs about 0.885 euros.
Please note
The scenarios are a personal assessment based on experience. They summarize possible price developments for each time frame and are not a certainty. This is market analysis, not investment advice. Keep your position sizes in line with your own risk management.
This forecast is translated from the German edition on kagels-trading.de.
How our forecasts are made and reviewed: How we work.