
Inverse Fair Value Gap (IFVG): Rules, Examples and a Test


Contents
- IFVG in 30 seconds
- What is an inverse fair value gap?
- IFVG, FVG and a violated gap: the difference
- How to spot a bullish and a bearish IFVG
- How to trade an IFVG: three entries, one stop, one target
- Two SPY examples: one retest held, one failed
- IFVG test: 25 years of SPY with fixed rules
- A practical example: the IFVG as an entry in a scalping model
- Combining the IFVG with structure, order blocks and SMT
- Common IFVG mistakes
- Pros and cons of the IFVG
- Conclusion: signal or label?
- Frequently asked questions about the IFVG
- About the author
A bullish fair value gap is supposed to catch price, but price falls straight through it on a clear close. For many traders that zone is now finished. For ICT traders it has just started. They read the same gap as resistance from now on and wait for the first return from below. That broken and reinterpreted gap is called an inverse fair value gap, or IFVG.
This guide shows how to tell an IFVG from a gap that was only touched, and what fixed rules did with it. You get the exact close-through rule, three common entries, one SPY example that worked and one that failed, and a 25-year count on SPY daily bars with and without a trend filter and a simplified sweep filter. The numbers are sobering, which is why they are worth a look. This article follows our editorial policy.
IFVG in 30 seconds
- Meaning: an IFVG is a fair value gap that price has closed through. Traders then read the zone with the opposite role.
- Role reversal: a broken bullish gap counts as resistance, a broken bearish gap as support.
- Recognition: what counts is a close beyond the far edge. A wick through the zone is not enough.
- Entries: three styles are common: at the gap midpoint before the close, after the close, or on the retest.
- Our test: on SPY daily bars since 2001, a fixed IFVG rule averaged −0.10R per trade. A trend filter brought it to about zero; no variant showed a demonstrable edge.
What is an inverse fair value gap?
An inverse fair value gap (IFVG) is a fair value gap that price has closed through beyond its far edge, and that traders then read with the opposite role: as resistance instead of support, or the other way round.
The starting point is an ordinary fair value gap. It comes from three candles whose first and third ranges do not overlap. In a bullish gap, the zone runs from the high of candle one to the low of candle three. In a bearish gap, it runs from the low of candle one to the high of candle three. Our guide to the fair value gap explains the construction, its own IFVG rule and a failed SPY example from February 2026.
The IFVG is the second reading of the same zone. While a bullish gap holds, traders expect buyers there. If price closes below it, that expectation was wrong. In the vocabulary of Smart Money Concepts, the zone now marks an area where sellers may appear on the return. That is a convention, not a law: the chart shows only that price broke the zone, not who will trade there next time.
The principle is older than the abbreviation. That broken support becomes resistance is classic support and resistance thinking. The IFVG applies this role reversal to gap zones. The term spread through the ICT trading community and is often called an inversion fair value gap in videos. In a search of the Inner Circle Trader’s YouTube channel on November 7, 2026, we found no lesson with that phrase in its title, so we treat it as a reading built on his FVG, not as his own definition.
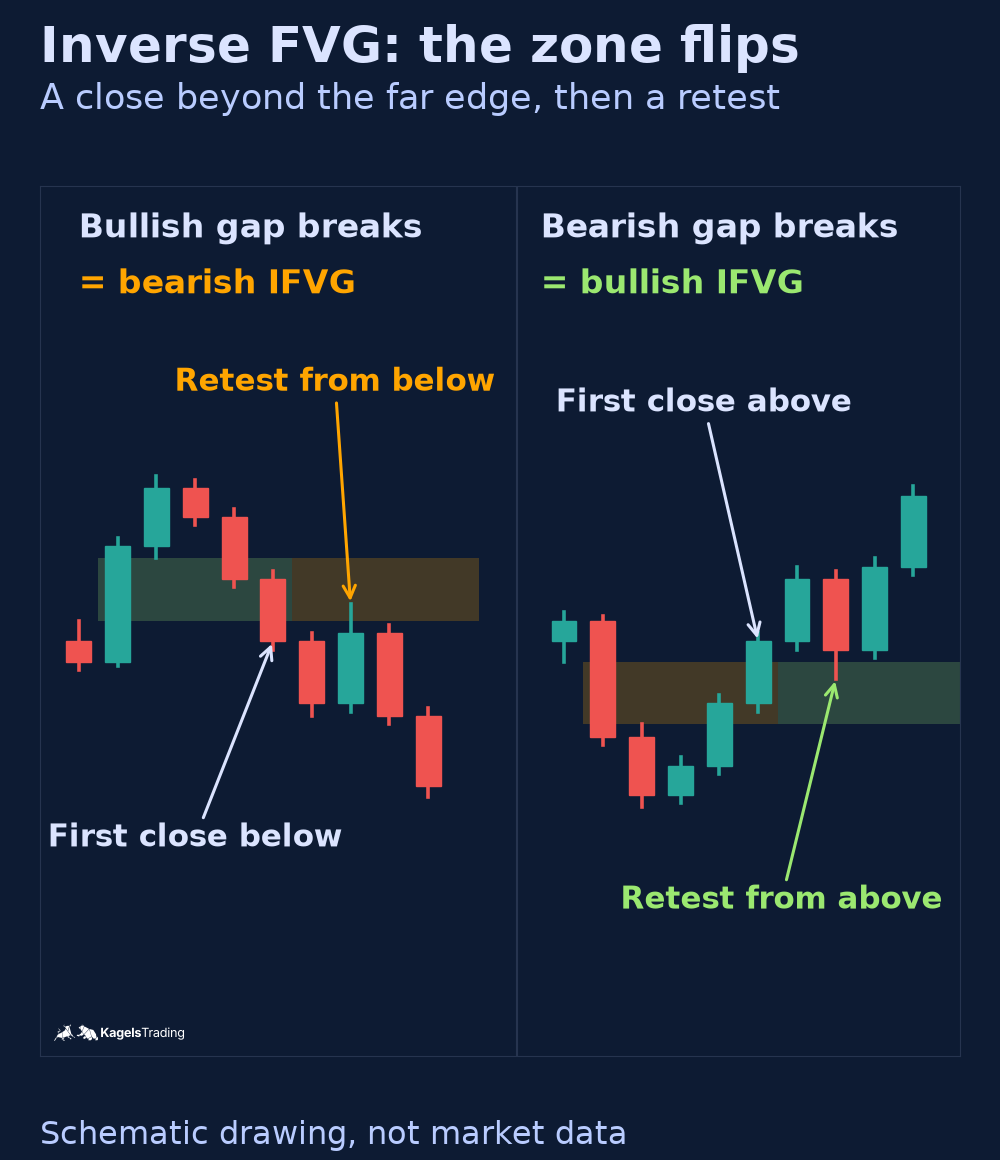 Click to enlarge
Source: Kagels Trading, own drawing.
IFVG, FVG and a violated gap: the difference
Not every broken gap is an IFVG. Videos and forums often mix up three cases. The difference lies in how price deals with the zone and in what you do with it. The table keeps them apart with one observable criterion each.
| Case | On the chart | Reading |
|---|---|---|
| Fair value gap | Three candles whose first and third ranges do not overlap; no close beyond the far edge yet | Original role; a later return may hold or fail |
| Violated gap | A wick goes through the zone, the close stays inside | Role unchanged |
| Inverse FVG | A close beyond the far edge | Opposite role |
The violated gap is the most common thinking error. If you flip every zone a wick has poked through, you trade gaps that were only scratched. The inversion itself comes from the close beyond the far edge. Many traders also want the break to come with a large candle, called displacement. If price drifts through over many small candles, they skip the IFVG. That is a quality filter, not part of the definition, and our test below does not use it.
How to spot a bullish and a bearish IFVG
The check takes four steps, and you can read each one off the chart. It separates an IFVG from a gap that was only touched, and it tells you which direction the new setup has.
- Mark the gap: draw the upper and lower edge of the original fair value gap.
- Check the close: for a bullish gap, a candle must close below the lower edge. For a bearish gap, a candle must close above the upper edge. A wick alone does not count.
- Check the speed (optional): many traders accept only breaks that come quickly with a clearly larger candle.
- Flip the role: the broken bullish gap is now a bearish IFVG (resistance). The broken bearish gap is now a bullish IFVG (support).
A bullish IFVG is a bearish fair value gap that price has closed above, and that is then read as support for long entries.
A bearish IFVG is a bullish fair value gap that price has closed below, and that is then read as resistance for short entries.
The names confuse many readers at first, because they refer to the new role. A bullish gap becomes a bearish IFVG. It is easier to ask one question instead: from which side does price come back? If it returns from below, the zone is resistance. If it returns from above, it is support.
How to trade an IFVG: three entries, one stop, one target
The three common entries differ mainly in how much confirmation you wait for. An early entry waits for less. Which price and which hit rate follow depends on the exact rule, so none of the three is better by definition.
- Aggressive: enter as soon as price breaks through the middle of the gap, before the candle closes. ICT calls the midpoint consequent encroachment.
- Conservative: enter only after the close beyond the far edge, when the inversion is confirmed.
- Retest: wait for price to return to the broken zone and enter there with a limit order. This is the version our test uses.
A common stop rule places the stop beyond the other edge of the zone. For a short at a broken bullish gap, that is above its upper edge. For a long at a broken bearish gap, it is below the lower edge. Some traders put it beyond the extreme of the break candle instead. If price runs back through the whole zone, the idea is wrong.
Most sources name a target of at least twice the risk, or the next obvious level in the new direction. With a fixed win of +2R and a fixed loss of −1R, the break-even hit rate before costs is one trade in three. Costs push it higher. So a rule that reaches its target in about 29% of trades, like ours below, loses money before fees are even counted.
Two SPY examples: one retest held, one failed
Both examples come from the fixed rule tested below, so the zones were not drawn by hand. They use SPY daily bars from Yahoo Finance. We took the last winner and the last loser of the rule in a sample that ends on October 16, 2026, so we did not search for a pretty chart. Two cases prove nothing about the next one.
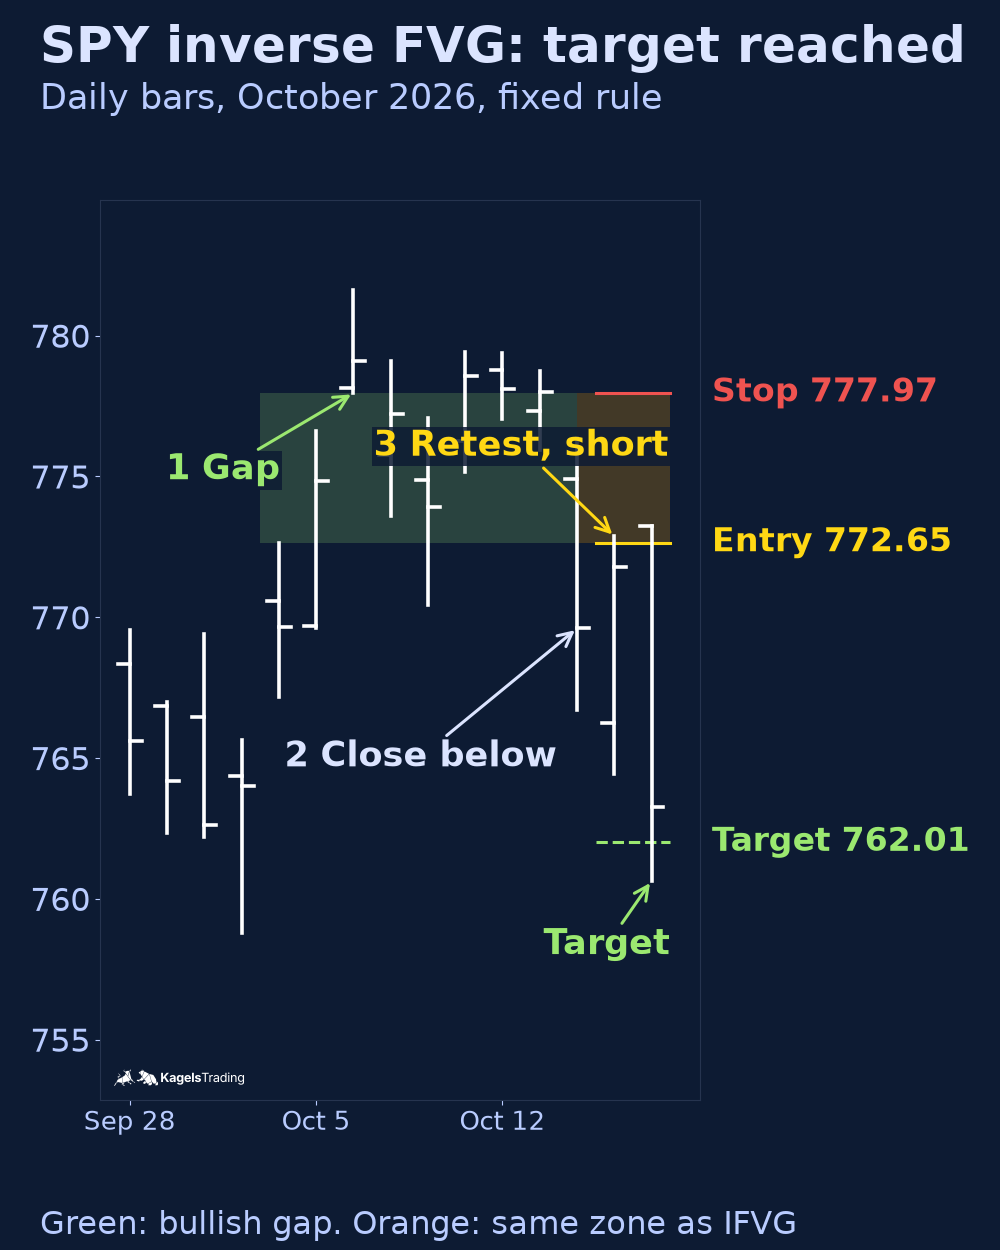
The retest held: a short in October 2026
This bullish gap had already failed once as support before it worked as an IFVG. It formed between the October 2 high of 772.65 and the October 6 low of 777.96. Our Smart Money Concepts guide uses the same zone in its failed long example. The numbers below match the markers in the chart.
- Gap: a bullish fair value gap from 772.65 to 777.96, between October 2 and October 6.
- Inversion: on October 14, SPY closed at 769.60, below the lower edge.
- Retest: on October 15, the high of 772.87 reached back into the zone. The short filled at 772.65, with a stop at 777.97 and a target at 762.01, twice the risk.
- Exit: on October 16, the low of 760.64 reached the target.
 Click to enlarge
The same prices first stopped out a long and then paid a short. That is what the IFVG reading predicts, and it is also exactly the kind of example that looks convincing after the fact. The chart shows a sequence of prices, not that sellers were waiting in the zone. Only the count over many cases says whether the reading adds anything.
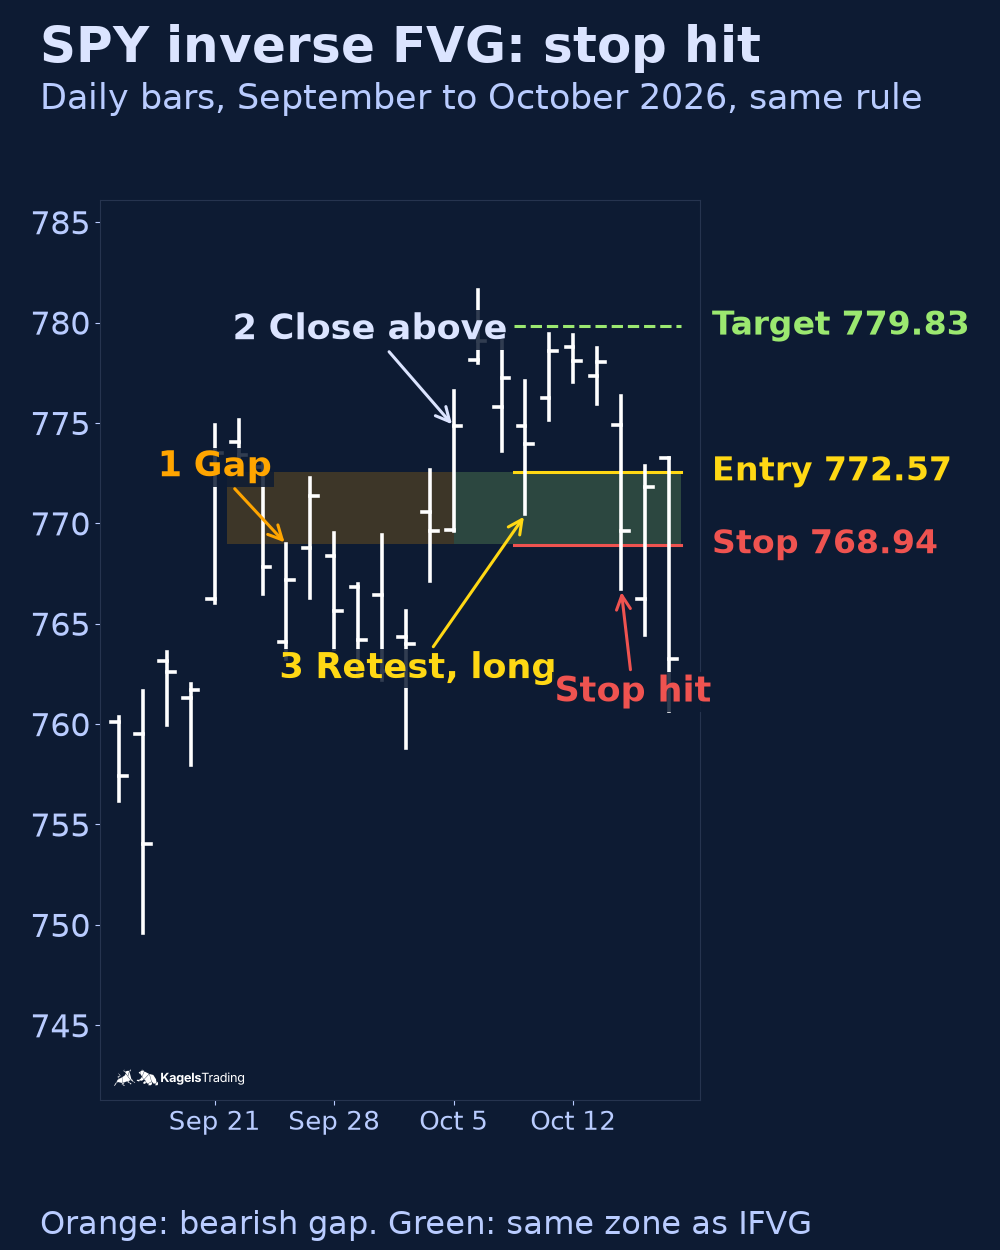
The retest failed: a long in October 2026
The last loser came from a bearish gap that price had closed above. The gap ran from the September 24 high of 768.95 to the September 22 low of 772.57. On October 5, SPY closed at 774.83, above the zone, which turned it into a bullish IFVG.
On paper, this setup was as clean as the winner. On October 8, SPY traded back down to 770.44 and filled the long at 772.57, with a stop at 768.94 and a target at 779.83. The target never came. On October 14, the low of 766.71 hit the stop. The zone was read as support and did not hold.
 Click to enlarge
Notice that both trades shared the same days. The long stopped out on October 14, the same bar that inverted the bullish gap for the short. One sharp down day decided both trades. If you trade several overlapping zones on one market, they are not independent bets.
IFVG test: 25 years of SPY with fixed rules
Whether a broken gap works as a signal can be counted. We used every SPY daily bar from January 2, 2001 to October 16, 2026, from Yahoo Finance, adjusted for splits but not for dividends. The base rule is the same one our fair value gap guide tests, on the same data, so both pages show the same base result:
- Gap: a bullish or bearish fair value gap at least a quarter of the 14-day average true range high, measured on candle three. The ATR here is the simple average of the last 14 true ranges, not Wilder’s smoothed version.
- Inversion: within 20 trading days after candle three, a close beyond the far edge.
- Entry: in the new direction, a limit order at the broken edge, on the first return within 20 days after the inversion day. If that bar opens beyond the edge, the fill is at the open.
- Exit: stop one cent beyond the other edge, target at twice the risk (2R), otherwise the close of the 40th day, counting the entry day as day one.
- One position per direction: while an order or trade is open, new inversions in that direction are ignored. Setups are handled in the order of their inversion day.
The execution details matter for the result. If stop and target are both touched on the same day, we count the stop. If the limit order fills during the day, a target touch on the entry day does not count. Opening gaps beyond the stop or target fill at the open, so some results fall outside −1R and +2R. Fees and slippage are not deducted.
Three variants add one filter each. The sweep variant is a simplified filter: between the first gap candle and the inversion, price must have traded beyond the highest high (for shorts) or the lowest low (for longs) of the 20 bars before candle one. It does not check whether price closed back inside, so it is not a full Turtle Soup sequence. The trend variant allows shorts only below and longs only above the 200-day moving average, measured at the inversion close. The last variant requires both. The filters apply before the one-position rule.
| Variant | Trades | Target reached | Average per trade | 95% range of the average |
|---|---|---|---|---|
| Base rule | 449 | 29.2% | −0.10R | −0.25R to +0.04R |
| With sweep | 262 | 28.6% | −0.09R | −0.29R to +0.10R |
| With trend filter | 195 | 32.3% | 0.00R | −0.22R to +0.22R |
| Sweep and trend | 78 | 33.3% | +0.05R | −0.32R to +0.41R |
The base rule lost money. Of 449 trades, 131 reached the target. The total was −46.8R. Shorts at broken bullish gaps cost the most, with −35.4R over 250 trades in a market that mostly rose. Longs at broken bearish gaps lost 11.5R over 199 trades.
The sweep filter barely changed anything, and the trend filter brought the average to about zero. With both filters, 78 trades averaged +0.05R, far too few for a conclusion. The 95% range is a normal approximation that assumes independent trades, and as the October example shows, trades can overlap. Every range runs from clearly negative to positive, so no variant shows a demonstrable edge.
Read the test for what it covers. It is one ETF, on daily bars, with one definition of gap, trend and exit. Many traders who use IFVGs work on 1- to 5-minute charts or faster, and this test says nothing about those. If you want to use an IFVG model on another timeframe, test it there yourself, for example with our guide to backtesting. Trying many filters on the same data invites curve fitting.
A practical example: the IFVG as an entry in a scalping model
How the IFVG is used in practice shows in a video by the prop firm IQ Capital from October 27, 2026. In the video, the scalper Candace Lau explains her two ICT-based models while trading Nasdaq 100 futures live. The channel introduces her with $2.5 million in “verified” payouts; we could not check that figure.
In her Turtle Soup model, the IFVG is the entry. Price first runs an outside liquidity pool, such as a cluster of highs, and turns. A fair value gap that formed just before then breaks. She enters aggressively when price crosses the midpoint of the gap, without waiting for the candle close, using a bracket order with a 25-point stop and a 50-point target in NQ.
She also names the limits herself. If the pattern unfolds slowly over many candles, she skips it. She calls her approach an advanced method. The live trade in the video lost $656 on two contracts, after which she did not force a second trade.
The video is marketing by a firm that sells funded accounts. How the firm itself compares is covered in our IQ Capital review. The Turtle Soup idea is older than ICT: Linda Bradford Raschke described it in “Street Smarts” (1995), written with Laurence Connors, as a fade of the breakout rules of the Turtle traders.
Combining the IFVG with structure, order blocks and SMT
Few ICT traders trade an IFVG on its own. It usually appears as one building block in a larger model. Three combinations come up most often, and each one has a counting trap.
IFVG after a market structure shift
The IFVG often appears exactly where structure turns. If price breaks a last low and closes through a bullish gap in the same move, SMC traders see both a market structure shift and an IFVG for the entry. Both labels then describe the same candle from two angles, so they are not two independent confirmations.
IFVG and order blocks
If an IFVG and a broken order block overlap, many traders mark both as one zone. An order block is the last opposite candle before a strong move. In simple terms, a broken order block read with the opposite role is called a breaker block. Stricter versions also require a sweep and a structure break before it.
IFVG and SMT divergence
SMT divergence is a difference between two closely related markets, where only one of them takes out a high or a low. ICT traders read it as a hint of a reversal. If, say, the E-mini Nasdaq 100 future makes a new low and the E-mini S&P 500 future does not, they see a possible turn. We have not tested this combination.
Common IFVG mistakes
Most mistakes come from counting IFVGs too generously. These four cost the most money, and each one has a simple fix:
- Wick instead of close: a candle pokes through the zone but closes inside. That is not an IFVG.
- Flipping every gap: small, old or repeatedly tested gaps are usually used up. Our test sets a minimum height and a 20-day window.
- Against the trend: shorts at broken bullish gaps cost the most in a rising market.
- Counting confirmations twice: structure break, IFVG and displacement are often the same candle. Three labels do not make three pieces of evidence.
Pros and cons of the IFVG
Whether the IFVG is worth your time depends mostly on how strictly you define it. These strengths and weaknesses apply to any version you trade.
Pros:
- A clear zone: upper and lower edges are fixed, so entry and stop can be planned in advance.
- A fast change of mind: you notice early when an expectation was wrong, instead of staying on the wrong side.
- Easy to combine: the IFVG fits into existing models with structure, sweeps and trend filters.
Cons:
- No demonstrated edge: in our SPY test, no variant was clearly positive.
- Much room for interpretation: what counts as displacement, how large a gap must be and which wick matters differ from trader to trader.
- Fast markets: on short timeframes, execution decides, for example slippage on market orders.
Conclusion: signal or label?
The IFVG is a clean name for an old observation: broken zones often change roles. As a tool, it helps you drop a wrong expectation quickly and read the zone again. As a signal on its own, it did not hold up in our 25-year SPY test, not even with a simplified sweep filter.
If you want to trade IFVGs, set three selection rules first. Take only a clear close beyond the zone, only trades in the direction of the higher-timeframe trend, and only a version you have tested on your own market and timeframe. Record every trade in a trading journal, including the losers.
This guide is education, not investment advice. Trading futures, options or leveraged products can lose more money than you expect, and past examples do not predict future results. Decide your risk per trade before you enter.
Frequently asked questions about the IFVG
What is an IFVG in trading?
An IFVG (inverse fair value gap) is a fair value gap that price has closed through. Traders then read the zone with the opposite role: a broken bullish gap as resistance, a broken bearish gap as support.
What is the difference between an FVG and an IFVG?
An FVG is traded in its original direction, while an IFVG is traded in the opposite one. An FVG exists as soon as the three-candle condition forms, and traders expect a reaction there in the original direction. An IFVG forms only when price instead closes beyond the zone. Then the same zone is traded the other way.
When does a fair value gap count as inverted?
In the common reading, only when a candle closes beyond the far edge. For a bullish gap, that means a close below its lower edge. A wick through the zone with a close inside does not count. Some traders also require a fast break with a large candle.
Does the IFVG strategy work?
In our test on SPY daily bars from 2001 to 2026, a fixed IFVG rule averaged −0.10R per trade. With a trend filter it was about zero, and a simplified sweep filter barely helped. The test says nothing about intraday charts.
What timeframe is best for an IFVG?
The pattern appears on every timeframe, and no timeframe is proven best. ICT scalpers mostly use it on minute or second charts around the open. The shorter the timeframe, the more signals you get and the more spread and slippage weigh on the result.
What does Turtle Soup have to do with the IFVG?
In the ICT version of Turtle Soup, price first runs an obvious high or low and turns, and an IFVG often serves as the entry. The idea itself goes back to Linda Bradford Raschke, who described a Turtle Soup setup in 1995 as a fade of failed breakouts.
This English edition is based on our German edition on kagels-trading.de and has been adapted for international readers.
More Chart Techniques guides
- Draw key levels
Support and Resistance: How to Draw and Use Key Levels
Where useful levels come from, how to draw zones with a stated rule and how to turn a level into a trade plan.
- Read price action
Price Action Trading: How to Read Charts Without Indicators
Market structure, key zones and three bar patterns, with a core setup and a real SPY example where the signal failed.
- Read candlestick charts
How to Read Candlestick Charts: Body, Wicks and Context
Open, high, low and close in one candle, body and wicks, two real Gold candles read step by step and how often patterns really occur.
- Know candlestick patterns
Candlestick Patterns: 10 to Know, Tested on Real Data
Ten patterns with rules and a cheat sheet, counted on DAX, S&P 500, EUR/USD and Gold since 2014: most are rare, none is a signal on its own.
- Combine timeframes
Multi-Timeframe Analysis: A Weekly and Daily Workflow
How to combine the weekly chart for context and the daily chart for entry under one stated rule, with a documented SPY case from June 2025.
- Trade pullbacks
Pullback Trading: Entries, Stops and Failed Setups
Pullback or reversal, limit against confirmation entry, and one fixed rule set on three real QQQ cases: a target, a stop and a cancelled setup.
- Trade sideways ranges
Range Trading: Boundaries, Orders and Two Documented Fades
A 14-session rule to draw horizontal boundaries, three order-type variants and two Alpaca-verified SPY fades, one that reached the target and one that was stopped out.
- Read chart formations
Chart Patterns: Reversals, Continuations and Failures
Reversal, continuation and bilateral formations with the measured-move convention per pattern and two documented SPY rectangle cases.
- Trade breakouts
Breakout Trading Strategy: Entries and False Breakouts
How often breakouts fell back into the range in our count of 1,472, and how to plan entry, stop and position size.
- Draw and trade trendlines
Trendline Trading: How to Draw Trendlines and Trade Them
How to draw trendlines with a fixed rule, four strategies for bounces, breaks and retests, and a real SPY line break without a lasting reversal.
- Use Fibonacci levels
Fibonacci Retracement Levels: How to Draw and Trade Them
How to calculate and draw retracement levels, trade pullbacks with confluence and a stop at the structure, and what a ten-year test says about the levels.
- Set Fibonacci targets
Fibonacci Extension: Levels, How to Draw It and Calculator
Three-point extension targets from the end of a pullback, why they differ from levels beyond 100%, a free calculator and three SPY swings, one without a single target reached.
- Trade gaps
Gap Trading Strategy: How to Trade Gaps and When Gaps Fill
Opening and full gaps, the four classic gap types, how often SPY gaps filled in our count since 2001, and plans for gap fill and gap and go.
- Calculate pivot points
Pivot Points: Formulas, Types and How to Trade Them
Formulas for standard, Fibonacci, Woodie, Camarilla and DeMark pivots, a free calculator, which session counts and a real SPY day.
- Swing trade
Swing Trading: 4 Strategies, Risk and Real Examples
Four swing trading strategies on the daily chart, position size, gap risk and US rules, with two hypothetical SPY pullbacks: one hit its target, one was stopped out.
- Identify market stages
Stage Analysis: Stan Weinstein's Four Market Stages
Stan Weinstein's four stages on the weekly chart, a Stage 2 checklist and two TSMC breakouts: one ran for a year, one gapped through its stop.
- Screen for growth leaders
CAN SLIM: William O’Neil’s Seven Rules for Growth Stocks
William O'Neil's seven CAN SLIM criteria with thresholds, his selling rules, a free screen with real counts and what the tests really show.
- Read Wyckoff ranges
Wyckoff Method: Accumulation, Distribution and Springs
Accumulation and distribution with phases A to E, springs and upthrusts as optional tests, and two real TSMC ranges read with and without hindsight.
- Trade Darvas boxes
Darvas Box Strategy: Rules, Entries and Stop Losses
The box rules step by step, when the edges become known, where the stop goes, and a mechanical test on TSMC in 2024 with two honest results.
- Count Elliott waves
Elliott Wave Theory: Rules, Patterns and Fibonacci
The five-wave pattern, three hard rules, zigzags, flats and triangles, Fibonacci ratios and a real DAX count, from the first German translator of the standard work.
- Understand Smart Money Concepts
Smart Money Concepts (SMC): What They Are and What Holds Up
The seven SMC building blocks, BOS vs CHoCH vs MSS, one labeled SPY sequence that held, one that failed, and what a chart can and cannot show.
- Understand ICT trading
ICT Trading: Silver Bullet, Killzones and What Holds Up
Michael Huddleston's Inner Circle Trader method: Silver Bullet, Judas Swing, the 2022 model and killzones in New York time, with one SPY setup that worked and one that failed.
- Trade order blocks
Order Blocks: How to Spot, Draw and Trade the Zone
The three conditions behind a valid order block, entry and stop at the zone, two SPY cases from 2026 and a 25-year count where a fixed rule lost money.
- Trade fair value gaps
Fair Value Gap (FVG): How to Spot, Trade and Test It
The three-candle rule, bullish, bearish and inverse FVG, two SPY cases from 2026 and a 25-year count of how often gaps were revisited and traded.
- Trade failed breakouts with Turtle Soup
Turtle Soup Trading: Raschke Rules, ICT Version and a Test
Linda Raschke's original rules, Turtle Soup Plus One and the ICT version side by side, two SPY examples and a 25-year test on SPY and QQQ.
- Read a break of structure
Break of Structure (BOS): Rules, CHoCH vs MSS and a Test
Which swing counts, BOS vs CHoCH vs MSS under one stated convention, two SPY breaks that won and lost, and a 25-year test against ordinary days.
- Read a change of character
Change of Character (CHoCH): Rules, BOS vs MSS and Data
The first close against the trend, close versus wick, CHoCH vs BOS vs MSS, two SPY cases and what the trend did next after 287 CHoCHs on SPY and QQQ.
- Read liquidity sweeps
Liquidity Sweep: How to Spot It and Trade the Reversal
Sweep or run, buy-side and sell-side liquidity, internal and external targets, SPY reversal, continuation and failed-reversal examples and a 25-year count of a fixed sweep rule.
- Interpret volume
Volume Analysis in Trading: How to Read Volume Honestly
What volume counts in stocks, futures, forex and crypto, how to read it against its own average, and our SPY test of high-volume days since 2001.