
Consolidation in Trading: What the Range Tells You


Contents
- Consolidation in trading in 30 seconds
- What is consolidation in trading?
- How to spot a consolidation: five features
- What our count says about consolidations
- Why consolidations form
- Consolidation in different markets
- How to trade a consolidation
- Tools to measure a consolidation
- Two DAX cases from 2026
- The psychology of trading a consolidation
- Conclusion: the range gives you levels, not direction
- Frequently asked questions about consolidation in trading
- About the author
Many trading books say that a consolidation usually breaks out in the direction of the previous trend. We tested that on 25 years of daily data from the DAX, Nasdaq 100 and S&P 500, with one fixed rule for a narrow range. About 6 in 10 first breaks went up, after uptrends and after downtrends alike, and narrow ranges did not do clearly better than wider ones. In our data neither the sideways phase nor the prior trend gave a stable hint about the next direction.
What a consolidation does give you is price levels. It shows two lines where supply and demand were actually tested, and from those lines you can build an entry with a clear risk. This guide explains how to spot a consolidation, why it forms, what our count found about breakouts and false breakouts, and how to trade both sides. This article follows our editorial policy.
Consolidation in trading in 30 seconds
- A consolidation is a pause, not a signal. Price moves sideways in a narrow range for days or weeks because buyers and sellers are in balance.
- Most first breaks went up, whatever came before. After an uptrend, 62.8% of narrow ten-day windows first closed above the range; after a downtrend it was 63.1%.
- Narrow ranges were not a better direction signal. Wider windows broke up first in 60.2% and 63.5% of cases, and the gap after uptrends changed sign across our 27 variants.
- Most first closes outside the range did not stay outside. Of 1,472 such breakouts, 68.4% closed back inside the range within ten trading days.
- The range gives you the risk. The range high and range low are tested turning points, which makes them usable reference levels for a stop.
- Rectangle, flag, pennant and triangle are all consolidations. They differ only in how the two boundaries run.
What is consolidation in trading?
A consolidation in trading is a phase in which price moves sideways within a narrow range for several periods after a strong move, because supply and demand are temporarily in balance.
Two levels set by the market itself mark the range. At the top is resistance, at the bottom support. Both form because price has reached them several times and turned away each time. That is what makes them useful: they are not drawn lines but prices where someone demonstrably sold or bought. Our guide to support and resistance shows how such levels form in general.
The term describes a state, not a forecast. A consolidation tells you that the market has no direction right now. It does not tell you where price goes next. Many beginners miss this because much of the literature sells the formation as a continuation pattern.
Consolidations appear in every liquid market and on every time frame. You find them in stocks, currency pairs, commodities and crypto, from the five-minute chart to the monthly chart. The rules stay the same, only the holding time changes.
Consolidation or sideways market: the difference
The two terms are often mixed up, and the difference matters in practice. A consolidation follows a trend. It has a history, usually a strong move whose energy is being absorbed. A sideways market is a lasting state without a prior direction, as thinly traded small caps often show for months.
The two lead to different expectations. After a consolidation, a breakout with follow-through is plausible because there was momentum before. In a real sideways market that momentum is missing, and many traders expect breakouts there to fizzle and the range to keep trading. We did not measure this difference. Our guide to range trading covers that case in detail.
A quick check on the chart helps to tell them apart. Look at the 20 bars before the range. If you see a clear move of several percent, you are looking at a consolidation. If price was already drifting without direction, it is a sideways market.
How to spot a consolidation: five features
You can recognize a consolidation by five features that appear together. None of them says much on its own. Only the combination of a narrow range, falling volatility and drying volume turns a quiet week into a formation you can plan a trade around.
First, clear price boundaries. Price moves between an upper level and a lower level that it touches several times without closing through. The more often a boundary was tested, the more traders watch it.
Second, the size of the bars shrinks. The distance between the daily high and low gets smaller. You can measure this with the Average True Range, which visibly falls during a consolidation.
Third, volume dries up. Less volume means that active traders are stepping back. A typical picture is falling volume during the range and a clear rise on the day price leaves it. In spot forex this filter works differently, because chart volume there is only the broker’s tick volume.
Fourth, the boundaries are tested more than once. One high and one low do not make a range. A common rule of thumb is about three touches per side, because only then do the levels look like more than chance.
Fifth, the range runs flat or only slightly tilted. If the range slopes steeply, it is no longer a consolidation but a trend channel, which you trade differently.
Common consolidation patterns
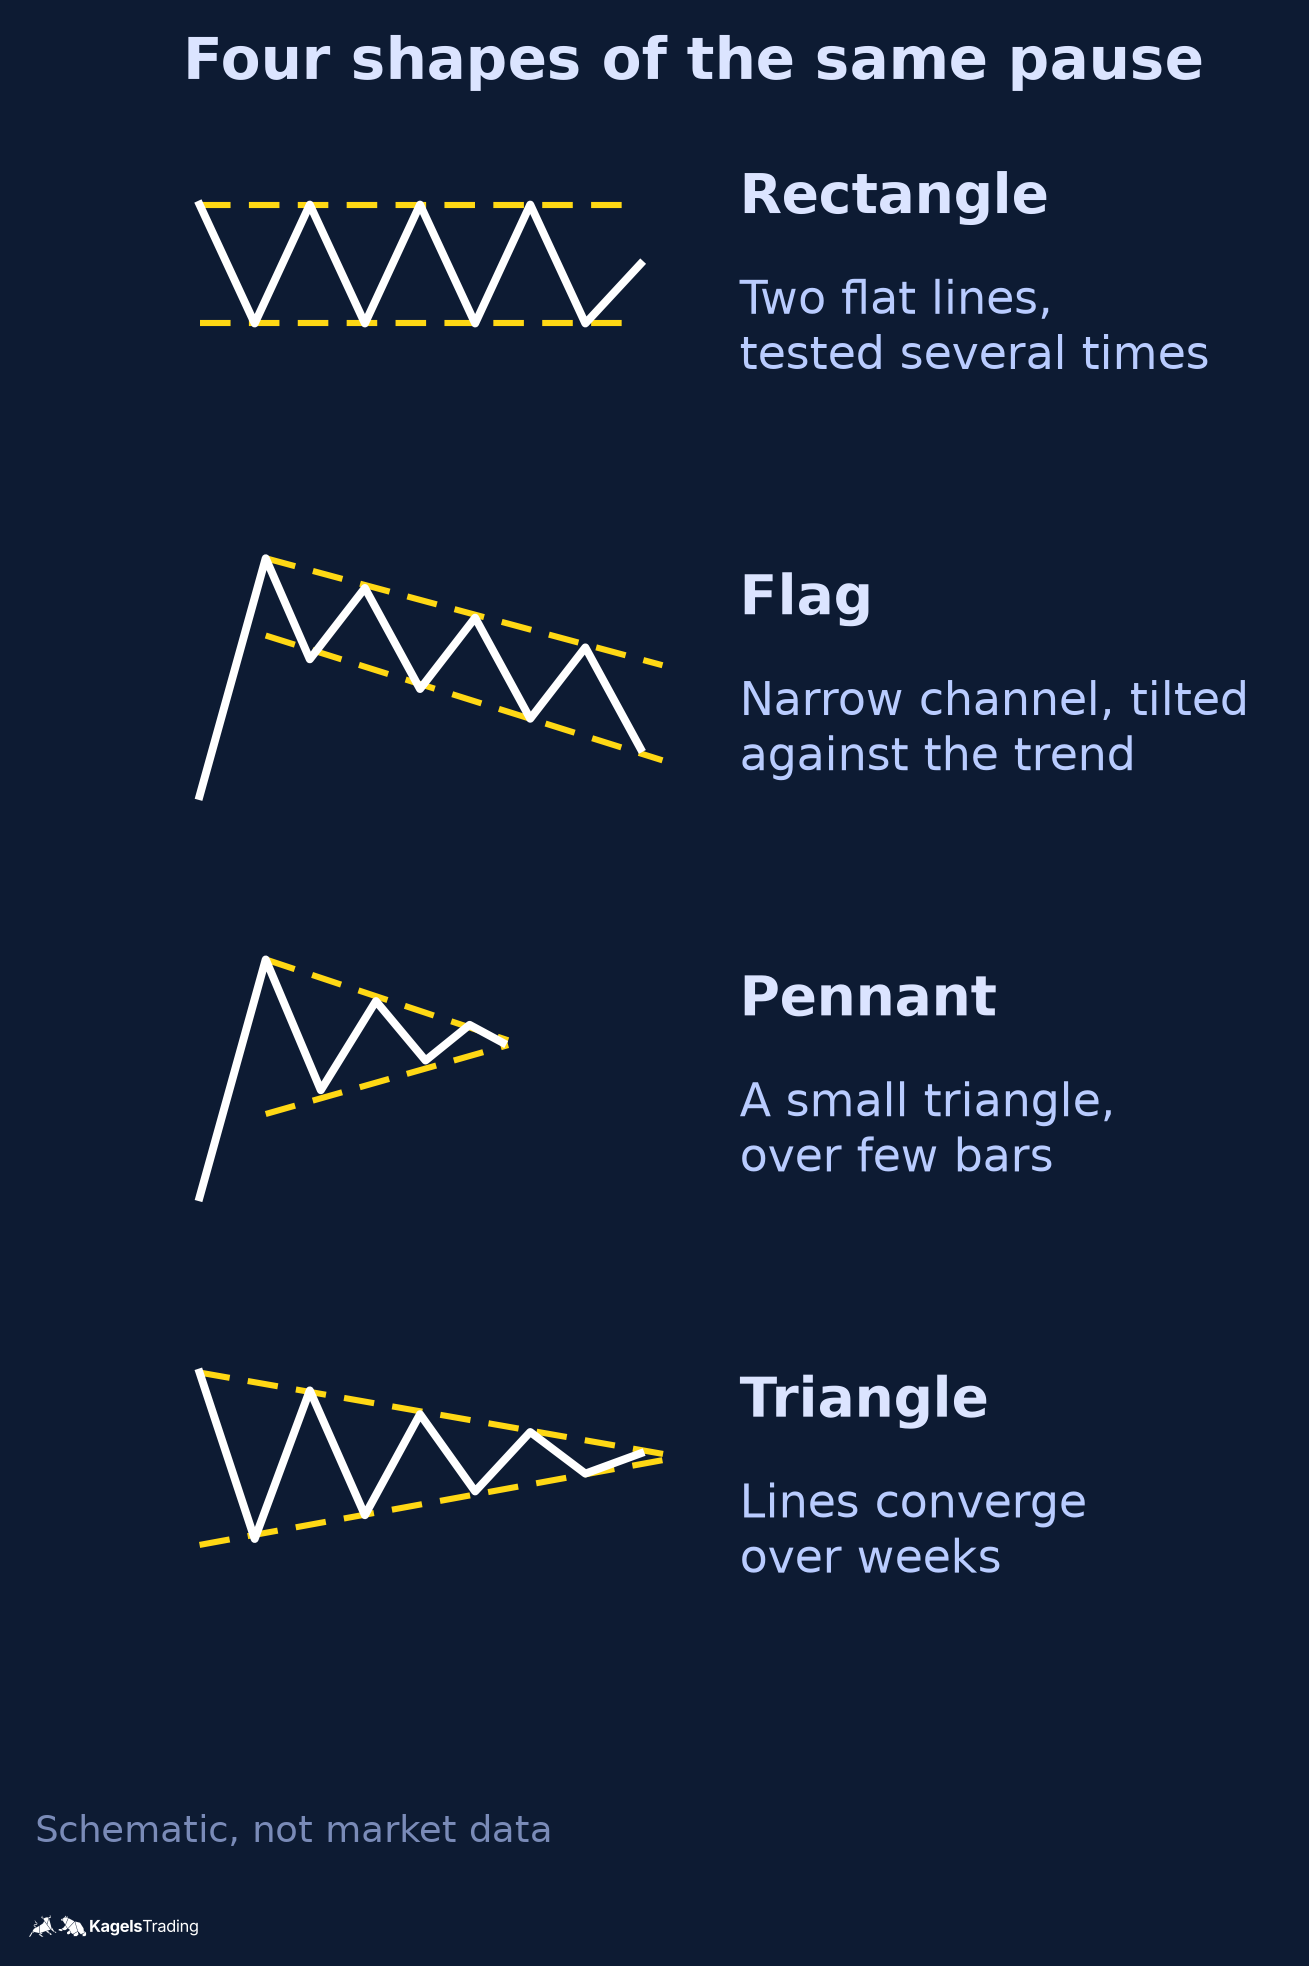 Click to enlarge
Source: Kagels Trading, own drawing.
All four common patterns describe the same market situation. They differ only in how the boundary lines run. This is worth knowing because books often give them very different success rates, and those rates rarely survive a recount. Our overview of chart patterns covers each shape in more detail.
The rectangle is the clearest form. It has two horizontal boundaries, tested several times, without a slope. It is the easiest form to trade because entry and exit are easy to read.
The flag follows a steep move. Price drifts back in a narrow channel, slightly against the prior trend. The two mirror images are called bull flag and bear flag.
The pennant is the compact sister of the flag. Instead of a channel, the range narrows into a small symmetrical triangle, usually over far fewer bars.
The triangle takes longer and gets tighter. Its boundaries converge over weeks until price has almost no room left. A wedge also converges, but both of its lines point the same way.
The smallest consolidation of all lasts one day. If a day’s whole range sits inside the range of the previous day, traders call it an inside day or inside bar. It follows the same logic on a daily chart.
What our count says about consolidations
For this guide we recounted instead of copying from the literature. We used daily bars of the DAX, Nasdaq 100 and S&P 500 from August 2001 to August 2026, about 18,900 trading days in total, from Yahoo Finance. The rule is a mechanical proxy for a consolidation, not the full picture from the section above.
The rules were fixed before we looked at the results. A consolidation was any window of ten trading days whose total range, highest high minus lowest low, was at most four times the average daily range of the previous 50 days. It measures one feature, a narrow range relative to recent swings. It does not check for a strong prior move, shrinking bars inside the window, falling volume or repeated touches of the boundaries. The prior trend was the close before the window compared with the close 20 trading days earlier, so any rise counts as an uptrend. The breakout was the first daily close above the window high or below the window low within the next 40 trading days.
We used two samples. For the breakout counts, the scan moved on by ten sessions after each narrow window, which gave 1,473 narrow ranges and 1,472 breakouts. For the direction comparison, a window started on every trading day, narrow or not, so both groups were counted the same way. Different windows can share a breakout date and the three indexes move together, so treat all counts as a description of price behavior, not as independent events or trading results.
Direction: no stable edge from the range or the trend
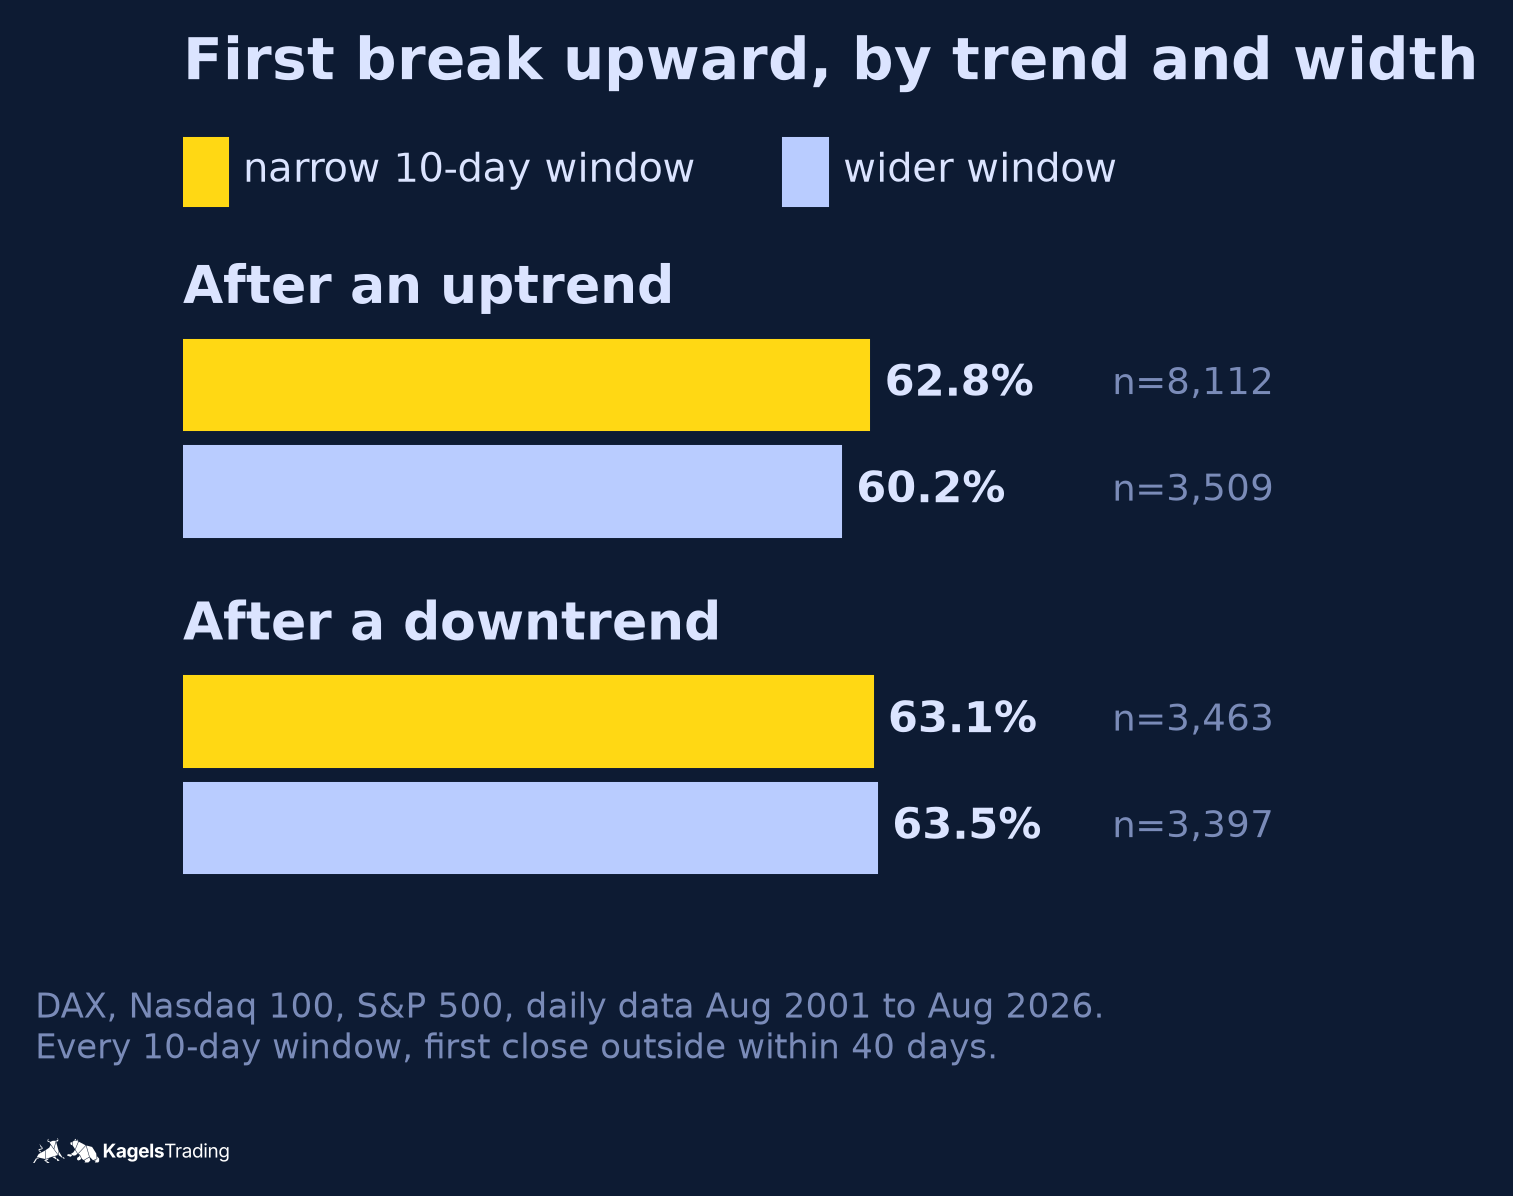 Click to enlarge
Source: Kagels Trading, own measurement.
After an uptrend, 62.8% of narrow ten-day windows first closed above the range. That sounds like support for the textbook rule. The comparison that is usually missing uses the same question for wider windows in the same trend: there the first close outside went up in 60.2% of cases. Both groups used the same outcome, the first close outside the window within 40 trading days. The shares count only windows with such a close; that left out 4 of 11,579 narrow windows and 129 of 7,035 wider ones, under 2% in each group.
After a downtrend the picture was almost the same. Narrow windows first broke up in 63.1% of cases and wider windows in 63.5%. Only about 37% continued down, so the rule “the breakout follows the trend” failed after downtrends. The prior trend made almost no difference to the share of upward breaks in our data.
| First break upward | Narrow, after uptrend | Wider, after uptrend | Narrow, after downtrend | Wider, after downtrend |
|---|---|---|---|---|
| DAX | 59.5% | 57.5% | 59.4% | 65.9% |
| Nasdaq 100 | 64.1% | 61.9% | 65.6% | 61.3% |
| S&P 500 | 64.4% | 61.2% | 65.1% | 63.0% |
| All three | 62.8% | 60.2% | 63.1% | 63.5% |
We checked the comparison across 27 parameter variants. We used windows of 8, 10 and 15 days, a maximum width of three, four or five average daily ranges, and horizons of 30, 40 and 60 days. After an uptrend, the difference between narrow and wider windows ran from 4.8 points below to 14.9 points above and was positive in 15 of 27 variants; the large gaps came from variants in which the “wider” group held only very wide windows. After a downtrend it ran from 3.4 points below to 2.1 points above. We see no stable edge in either case.
In practice this means: use the consolidation for levels, not for a direction forecast. The formation gives you the lines. One possible reason why about six in ten first breaks went up is the long upward drift of these three indexes over 25 years; our count does not isolate that cause, and other markets or periods can look different. The same caution applies to other patterns: Thomas Bulkowski’s statistics show that even the bearish rising wedge breaks down in only about 60% of cases, as our wedge pattern guide explains.
Breakouts: two out of three closed back inside
The finding with the most practical weight concerns the first close outside the range. We counted every first daily close beyond the range as a breakout, as many entry rules do. Of 1,472 breakouts, 1,007 closed back inside the range within ten trading days, which is 68.4%. In the DAX it was 71.2%. Our breakout trading guide shows the full method and a trend filter on the same list.
Where a breakout held, the move that followed was sizable. At its furthest point, measured from the breakout day through up to 40 trading days, price reached a median of about 1.7 range widths beyond the range. That is the best point reached, not a realistic exit. A close back inside is not the same as a losing trade either: our count has no entry, stop, target or costs, so it does not show which entry method works better.
The wait was short. Counted from the end of the ten-day window, the breakout came on the third or fourth trading day in the median (two to three days with no close outside the range in between). Many consolidations on the daily chart therefore resolve quickly.
Why consolidations form
Consolidations form when two groups with opposite interests are about equally strong. After a strong move, early buyers take profits, while new buyers are no longer willing to pay higher prices. Together, both slow the price without turning it. That is the sideways range.
The market psychology behind consolidations
After a strong trend, buying power simply runs low. Whoever wanted to buy is already in. New buyers need either lower prices or a new reason. Until one of them arrives, price swings between those who take profits and those who buy the dip.
Large traders can use these phases. Whoever wants to build or reduce a large position cannot do it in one go without moving the price against themselves. Spreading orders over days within a narrow range is one way to do it, and it can help to hold the range in place. The usual terms are accumulation and distribution, as in the Wyckoff method.
The longer the range holds, the more traders watch it. Many stop orders are likely to sit just outside both boundaries, because that is the obvious place for them. That is one common explanation for false breakouts: price runs those orders and returns. Our count cannot see orders, so it does not test this. Traders who use smart money concepts call this a liquidity sweep at the range boundary.
Scheduled events as drivers
Markets often move sideways ahead of known dates. Before central bank decisions, economic data or quarterly earnings, many traders hold back because the result can move price more than any chart level. Such quiet phases often end with the release. Our economic calendar guide shows where to find the dates.
The calendar itself can hold price in place. Options expiries, index rebalancing and quarter ends bring position changes that can keep price in a range for a while. Holiday periods with thin trading can have a similar effect.
Technical levels as drivers
Consolidations tend to form at levels that mattered before. These include old highs and lows, round numbers and common Fibonacci retracement levels. The reason is simple: many traders expect a reaction there and act on it.
Consolidations get especially stubborn where several levels meet. If an old high lines up with a moving average and a trendline, a zone forms in which price spends longer. Many traders treat such confluence zones as stronger range boundaries; we have not measured that.
Consolidation in different markets
The basic pattern is the same everywhere, but the triggers differ. If you know what typically causes a consolidation in a given market, you can better judge when it might end. That is the practical value of this section.
Consolidation in stocks
In single stocks, the quarterly report is a typical trigger. After the numbers, price often jumps, and a phase can follow in which the market digests the new information. Such consolidations may last a few weeks and end with the next impulse from the company or from the broad market.
The second typical place is the all-time high. When a stock nears its record high, two groups meet: long-term holders who are finally in profit and sell, and buyers who hesitate at record prices. Such consolidations can last months, and their boundaries are often easy to see.
Indexes behave more calmly than single stocks. An index averages many individual moves, so its ranges tend to be narrower and its breakouts less explosive. Our count above uses index data; single stocks can behave quite differently, and we did not measure them.
Forex consolidations
In forex, the time of day explains many quiet ranges. Pairs such as EUR/USD often move less during the Asian session than during London and New York hours, when European and US traders are active; OANDA’s session overview describes the overlaps. A narrow range in those hours can reflect lower activity rather than a balance after a trend. Session times shift with daylight saving; our guide to trading sessions shows the hours.
Currency pairs also contract before central bank meetings. Ahead of dates such as a Fed interest rate decision, the ranges of the major pairs often narrow for days and then resolve in one move. These consolidations have a known end date, which makes them easier to plan.
Round numbers have a strong pull in forex. Levels such as 1.1000 in EUR/USD or 150.00 in USD/JPY often draw attention, and traders commonly assume that option barriers and stop orders cluster there. Ranges around such levels have messy edges, and short pokes beyond the boundary are normal.
Crypto consolidations
Crypto ranges can last a long time. After its big cycle highs, Bitcoin has spent many months without a clear direction. We did not measure crypto, so compare its ranges with those in stock indexes with care.
False breakouts may be common there too. The market trades around the clock, many positions use leverage, and a short poke beyond the range can trigger a chain of liquidations that pulls price back just as fast. We did not count crypto, so our 68.4% from the index data is a reference point, not a crypto statistic.
How to trade a consolidation
You can trade a consolidation in two ways, and they exclude each other. Either you trade inside the range against the boundaries, or you wait for the breakout. Both at once does not work, because one strategy enters exactly where the other exits.
Trading inside the range
The rule is simple: buy near support, sell near resistance. The hard part is not the rule but the timing. Right at the boundary is also where false breakouts happen, so an entry there needs a clear stop.
Wait for a reaction before you enter. Useful confirmations are a reversal candle at the boundary, a second failed test of the same level or a visible rise in volume on the bounce. Our guide to candlestick patterns explains the candles.
Do not put your target at the far side of the range. Price rarely runs from one boundary to the other in one go. A target at about two thirds of the range width is reached more often than the far boundary, simply because it is closer, and it leaves room for the costs of the trade.
Range trading has better conditions when these four points apply:
- The range is confirmed. It was tested about three times per side and held each time.
- The market is liquid. The range is wide enough that spread and fees do not eat the profit.
- The range is young. It has run for only a few weeks, so the boundaries are still fresh.
- The calendar is clear. No central bank decision and no earnings report are due in the next few days.
Stay out of the range when one of these four points applies:
- The range is too narrow. If it is barely wider than the usual daily swing, you are trading noise.
- The edges are crumbling. Price has already poked through one boundary several times without holding.
- A scheduled event is due. Ahead of rate decisions and earnings, range boundaries lose much of their meaning.
- The range is old. After many weeks, more traders wait for the break, and the next test may become the breakout.
Trading the breakout
When you trade the breakout, you need a plan for the many breaks that do not stay outside. In our count about two thirds of first breakouts closed back inside within ten days. Whether that turns into a loss depends on your stop, target and costs, which our count does not include. A plan only works if the winners are large enough for the breakout strategy you use.
A single close beyond the boundary is a weak signal on its own. Common extra filters are clearly higher volume on the breakout day, a bar larger than average and a breakout in the direction of the higher trend. Each filter costs you signals and is meant to improve the rest; our breakout guide shows how much a trend filter changed the share of breaks that closed back inside.
The retest entry is one common alternative. Instead of buying the break, you wait until price comes back to the broken boundary from the outside and holds. You miss the breakouts that never come back, and in return the stop can sit closer to your entry. We did not test which entry works better.
Place the stop beyond the last swing point, not just beyond the boundary. Right behind the range boundary is where many traders place their stops, and that area is easily reached in a false breakout. Our guide to position sizing shows how to size the trade from the stop distance.
The length of a consolidation is no reason to trade bigger. Your position size follows from the distance to the stop and your risk per trade, not from how long the range lasted. That also applies when the range held for an unusually long time.
Tools to measure a consolidation
The eye is good at spotting a range but poor at judging it. Whether a range is really narrow is hard to see because every chart scales the price axis differently. The following tools turn the impression into a number.
Technical indicators
The Average True Range measures how much the market is moving. If the ATR falls clearly over several days, that is objective evidence of the shrinking moves. Our ATR guide, linked above, shows how it is calculated.
Bollinger Bands show the same information as a picture. When the bands contract sharply, traders call it a squeeze. It only says that volatility was low, not which way the next move goes. More on this in our guide to Bollinger Bands.
The RSI tends to swing around its middle in a consolidation. Readings between 40 and 60 for a longer period are one more sign of missing direction. That is not an entry signal, but it can serve as confirmation. Our RSI guide explains the details.
Trend-following tools suffer most in these phases. Moving average crossovers and similar signals flip back and forth inside a range. A low ADX reading is a common way to flag a market without a trend; many traders treat readings below 20 as weak and 20 to 25 as unclear, as a convention rather than a tested rule.
Volume analysis
Volume is a common filter for breakouts. Many traders read a break of the range boundary without rising volume as a sign that few traders are behind the move. Our guide to volume analysis shows how to read volume against its own average.
In spot forex you lack this filter. The spot currency market is decentralized, so there is no complete volume figure. What platforms show as volume is the tick count of the provider’s own feed. It works as a rough activity gauge, but only to a limited degree as a breakout filter.
Multiple time frames
A consolidation on the hourly chart can be a single bar on the daily chart. That is why every trade starts with a look at the next higher time frame. There you see whether your range sits in the middle of a trend or at an important level of the bigger picture.
The order is always the same: the higher time frame for direction, the middle one for the range, the lower one for the entry. Whoever turns this around and starts on the five-minute chart finds consolidations everywhere and overtrades. Our guide to multi-timeframe analysis shows one fixed workflow.
Two DAX cases from 2026
Both cases come from the same count and lie only three months apart. On the daily chart they look almost the same, and they ended very differently. They show what the statistics mean in a single trade.
The breakout that held
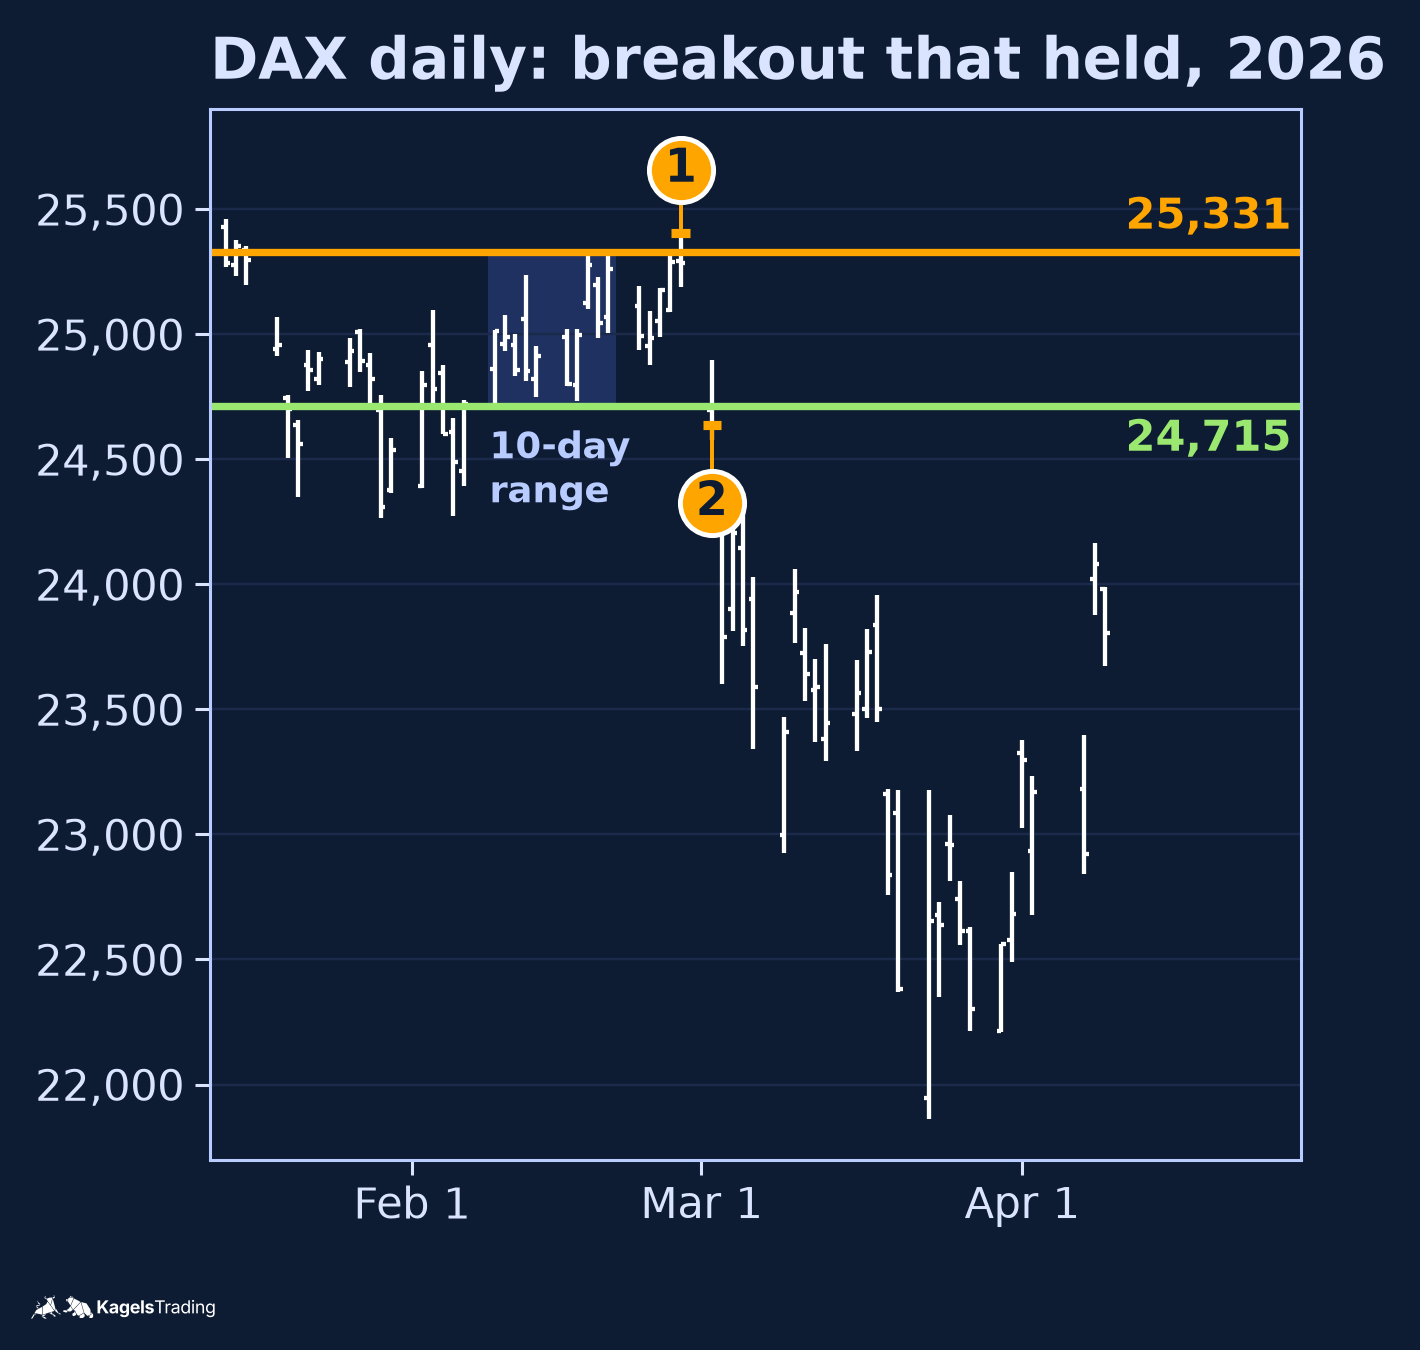 Click to enlarge
From 9 to 20 February 2026, the DAX traded in a range from 24,715 to 25,331 points. That is about 2.5% of width over ten trading days. By the rule of our count the prior trend was down: the close on 6 February, 24,721, was below the close of 9 January, 25,262.
The break came on the downside. On 2 March 2026 the index closed at 24,638, below the range low. One trading day earlier, on 27 February, price had reached 25,406 intraday, above the range high, but it did not close there. Whoever had traded that poke as a breakout would have been on the wrong side.
The downside breakout then ran about 4.6 range widths at its furthest point. That is a large maximum excursion, far more than the median of 1.7 range widths, and not a realized trade result. In this case the breakout went in the direction of the 20-day trend.
Same setup, different result
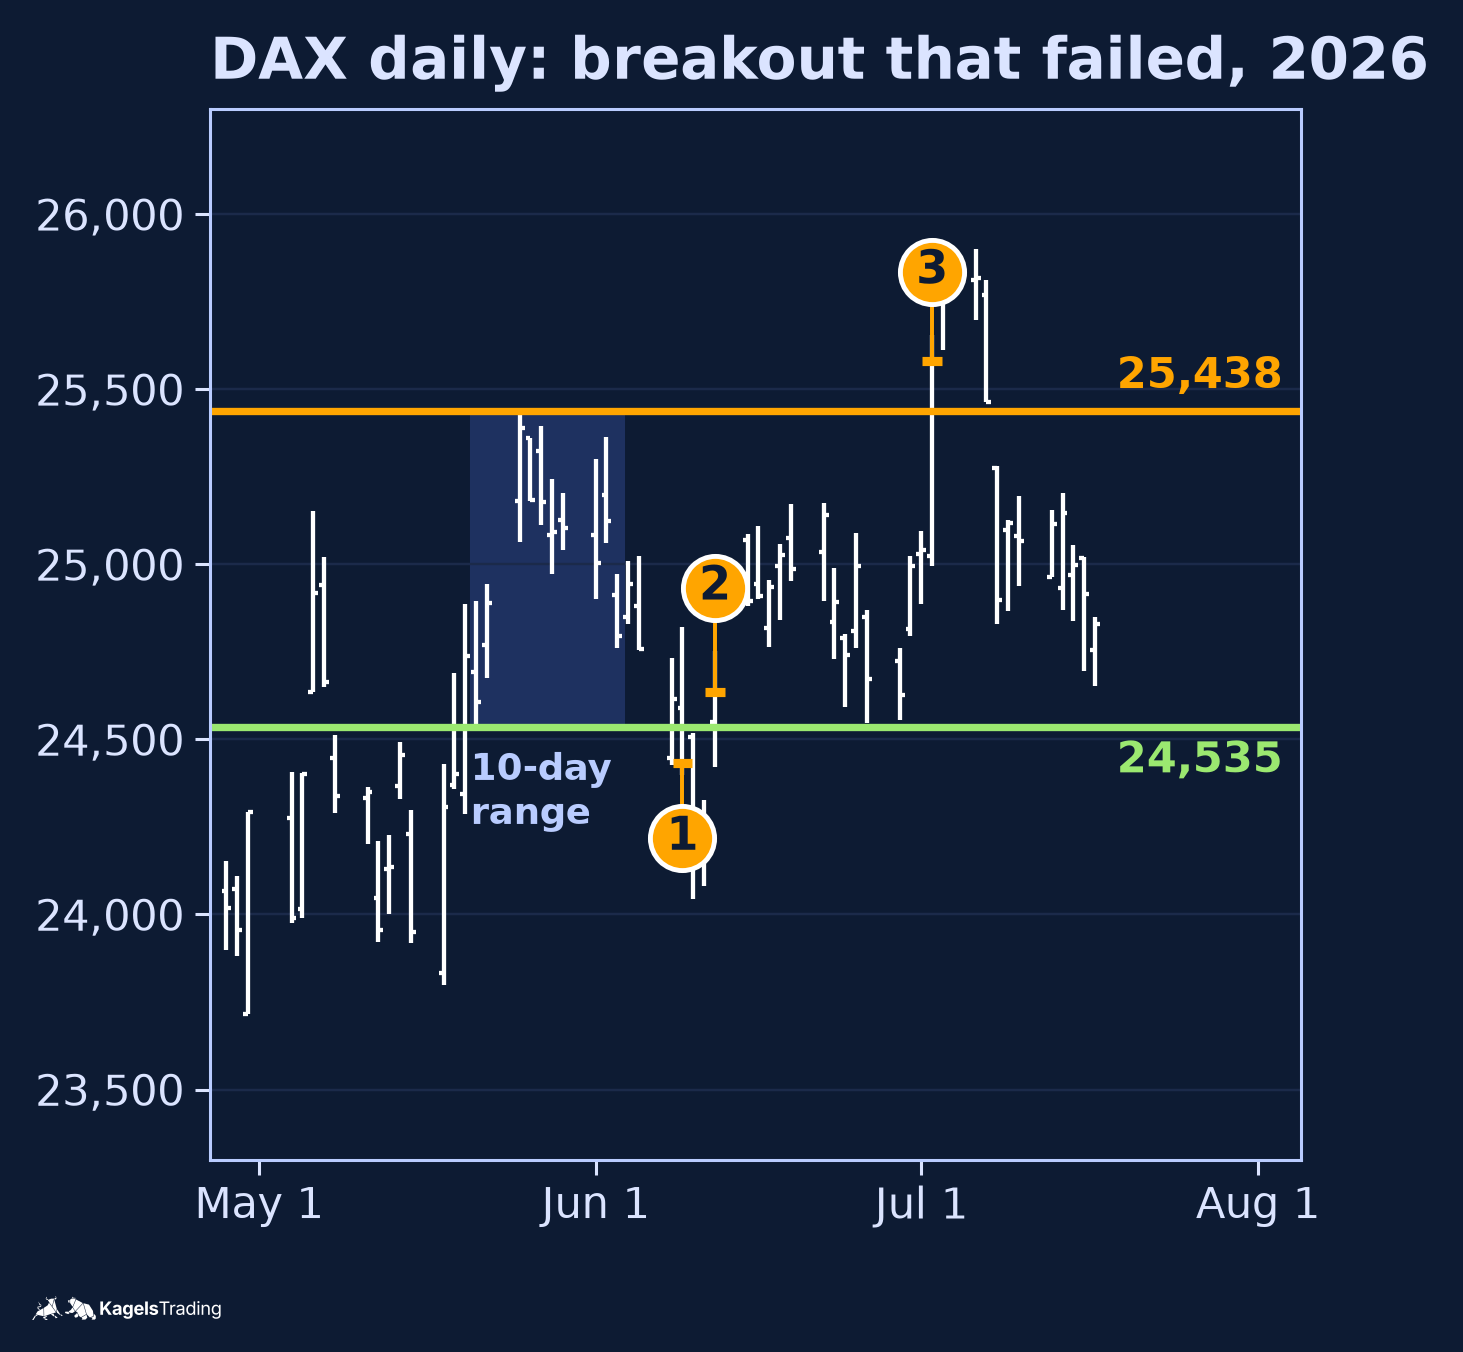 Click to enlarge
Three months later, from 21 May to 3 June 2026, the DAX formed a very similar range. It ran from 24,535 to 25,438 points and was a little wider at about 3.7%. This time the prior trend was up: the close on 20 May, 24,737, was above the close of 21 April, 24,271. On 9 June the index closed at 24,433, below the range, a breakout by the same rules.
This breakout did not last. On 12 June the index closed at 24,635, back inside the range. On 2 July it closed above the range high at 25,581 and reached a close of 25,818 on 6 July. From 8 July it traded back inside the range. Take a short entered at the 9 June close of 24,433 with an illustrative stop at 25,030, just above the last swing high before the breakout, 25,024 on 5 June. On 15 June the index opened at about 25,068, above that stop, so the stop would have been hit at the open with a worse fill than planned. Daily index prices are not fills; the real result depends on the instrument you trade and its prices.
One difference was visible at the time of the breakout: the first break went with the 20-day trend, the second against it. Two cases prove nothing, and in our count the 20-day trend did not shift the odds of the first break. Both ranges looked clean, and both had a clear close beyond the boundary. That is why position size and the stop decide the result more than the hit rate.
The psychology of trading a consolidation
Consolidations cost most traders money not through bad analysis but through boredom. A range that holds for three weeks creates the urge to do something. That urge leads to too many trades in a market that offers little.
The second typical mistake is the fear of missing the breakout. It leads to trading every small poke beyond the boundary. With about two thirds of first breakouts closing back inside in our count, that means many premature entries, each of which needs its own stop and costs.
A rule written before the range helps. Write down under which conditions you enter before price reaches the boundary. Whoever writes the rule at the moment of decision tends to write it so that it allows the entry.
Trade smaller in a consolidation, not bigger. Breaks that do not hold are common in these phases, and that belongs on the risk side of your plan. Our risk management guide shows how to set the risk per trade.
Keep a log just for range trades. Note the range width, the number of tests per side and whether the breakout held. After twenty entries you see which kind of range works for you. That is more relevant to you than any textbook statistic, because it contains your own executions; our trading journal guide shows how to set one up.
Conclusion: the range gives you levels, not direction
The main finding from 25 years of index data is a disappointment. Narrow ranges did not give a stable hint about the breakout direction, and neither did the 20-day trend. About six in ten first breaks went up in all groups, so the often quoted two thirds of continuation after an uptrend say more about these rising indexes than about the pattern.
The practical value of a consolidation lies elsewhere. It gives you two tested price levels where the market has reacted before. From them you can build an entry with defined risk, and that is worth more than any forecast of direction.
Expect most first breakouts to close back inside. In our count 68.4% did so within ten trading days. Whoever trades the first close beyond the boundary needs a stop and a position size that fit that rate. The retest entry is one alternative, which we did not test against the direct entry.
A consolidation is no reason to trade. It is a reason to be prepared. If you find no trade in a range that fits your rules, the right decision is to take no trade. This is market education, not investment advice.
Frequently asked questions about consolidation in trading
What does consolidation mean in stocks?
In stocks, a consolidation is a phase in which price moves sideways in a narrow range for days or weeks after a strong move. Typical triggers are quarterly earnings that the market first has to digest, or the approach to an all-time high, where long-term holders sell and new buyers hesitate. The phase ends when a new impulse tips the balance.
Is a consolidation a sign of a coming trend reversal?
No, and it is not a reliable sign of continuation either. In our index data, 62.8% of narrow ten-day windows first broke upward after an uptrend and 63.1% after a downtrend. Wider windows did about the same. Neither the range nor the 20-day trend gave a stable hint about the direction.
How long does a consolidation last?
It depends on the time frame. In our count on daily bars, the median breakout came on the third or fourth trading day after the ten-day window ended. On an hourly chart you are talking about hours, on a weekly chart about months. Our count did not test the common rule of thumb that a longer prior move leads to a longer pause.
What is the difference between consolidation and a sideways market?
A consolidation follows a clear trend and is a pause within a move. A sideways market is a lasting state without a prior direction. In practice, a move after a consolidation is plausible because there was momentum before. In a real sideways market that momentum is missing, and many traders expect breakouts there to fizzle; we did not measure that difference.
How do I spot a consolidation on a chart?
Look for three things at once: a range with two boundaries tested about three times each, shrinking bars and falling volume. You can measure it objectively with the Average True Range, which falls during the phase. None of the features says much alone; only the combination makes the formation tradable.
How do you trade a breakout from a consolidation?
Do not rely on the first close beyond the boundary alone. In our count, 68.4% of those breakouts closed back inside within ten trading days, which is a count of price behavior, not of losing trades. Common extra filters are higher volume and a larger than average bar. One alternative is the retest: you enter only when price comes back to the broken boundary from the outside and holds. The stop goes beyond the last swing point, not just beyond the range boundary.
This English edition is based on our German edition on kagels-trading.de and has been adapted for international readers.
More Chart Techniques guides
- Draw key levels
Support and Resistance: How to Draw and Use Key Levels
Where useful levels come from, how to draw zones with a stated rule and how to turn a level into a trade plan.
- Read price action
Price Action Trading: How to Read Charts Without Indicators
Market structure, key zones and three bar patterns, with a core setup and a real SPY example where the signal failed.
- Read candlestick charts
How to Read Candlestick Charts: Body, Wicks and Context
Open, high, low and close in one candle, body and wicks, two real Gold candles read step by step and how often patterns really occur.
- Know candlestick patterns
Candlestick Patterns: 10 to Know, Tested on Real Data
Ten patterns with rules and a cheat sheet, counted on DAX, S&P 500, EUR/USD and Gold since 2014: most are rare, none is a signal on its own.
- Trade the hammer candle
Hammer Candlestick: Spot It, Trade It, Know Its Limits
Three features, the difference to inverted hammer and hanging man, entry and stop, and how rarely the hammer appeared in four markets since 2014.
- Spot a morning star
Morning Star Candlestick: Rules, Real Cases, Limits
Three measurable rules, every morning and evening star in four markets since 2014, and two real cases: one reached its target, one hit its stop.
- Spot a topping tail
Topping Tail Candlestick: Rules, Silver Example and Limits
Six measurable rules for the bearish rejection candle, a silver candle from January 2026 checked step by step, the difference from the shooting star and how to trade it with a stop.
- Combine timeframes
Multi-Timeframe Analysis: A Weekly and Daily Workflow
How to combine the weekly chart for context and the daily chart for entry under one stated rule, with a documented SPY case from June 2025.
- Trade pullbacks
Pullback Trading: Entries, Stops and Failed Setups
Pullback or reversal, limit against confirmation entry, and one fixed rule set on three real QQQ cases: a target, a stop and a cancelled setup.
- Trade sideways ranges
Range Trading: Boundaries, Orders and Two Documented Fades
A 14-session rule to draw horizontal boundaries, three order-type variants and two Alpaca-verified SPY fades, one that reached the target and one that was stopped out.
- Read chart formations
Chart Patterns: Reversals, Continuations and Failures
Reversal, continuation and bilateral formations with the measured-move convention per pattern and two documented SPY rectangle cases.
- Trade rising and falling wedges
Rising and Falling Wedge Patterns: How to Trade Them
How to spot both wedges, where to set entry, stop and target, and why Bulkowski ranks the rising wedge with a downward breakout last of 36 patterns.
- Trade breakouts
Breakout Trading Strategy: Entries and False Breakouts
How often breakouts fell back into the range in our count of 1,472, and how to plan entry, stop and position size.
- Draw and trade trendlines
Trendline Trading: How to Draw Trendlines and Trade Them
How to draw trendlines with a fixed rule, four strategies for bounces, breaks and retests, and a real SPY line break without a lasting reversal.
- Draw a pitchfork channel
Andrews Pitchfork: How to Draw It, Trade It and Test It
Three pivots, a median line and two parallels, Schiff variants, a trade plan and how often price reached the median line in 746 cases.
- Use Fibonacci levels
Fibonacci Retracement Levels: How to Draw and Trade Them
How to calculate and draw retracement levels, trade pullbacks with confluence and a stop at the structure, and what a ten-year test says about the levels.
- Set Fibonacci targets
Fibonacci Extension: Levels, How to Draw It and Calculator
Three-point extension targets from the end of a pullback, why they differ from levels beyond 100%, a free calculator and three SPY swings, one without a single target reached.
- Trade gaps
Gap Trading Strategy: How to Trade Gaps and When Gaps Fill
Opening and full gaps, the four classic gap types, how often SPY gaps filled in our count since 2001, and plans for gap fill and gap and go.
- Calculate pivot points
Pivot Points: Formulas, Types and How to Trade Them
Formulas for standard, Fibonacci, Woodie, Camarilla and DeMark pivots, a free calculator, which session counts and a real SPY day.
- Swing trade
Swing Trading: 4 Strategies, Risk and Real Examples
Four swing trading strategies on the daily chart, position size, gap risk and US rules, with two hypothetical SPY pullbacks: one hit its target, one was stopped out.
- Identify market stages
Stage Analysis: Stan Weinstein's Four Market Stages
Stan Weinstein's four stages on the weekly chart, a Stage 2 checklist and two TSMC breakouts: one ran for a year, one gapped through its stop.
- Read Kagi charts
Kagi Charts: Reversal Amount, Shoulders and Signals
One line, one reversal amount, thick yang and thin yin: tested on DAX hourly data and compared with Renko and point and figure.
- Screen for growth leaders
CAN SLIM: William O’Neil’s Seven Rules for Growth Stocks
William O'Neil's seven CAN SLIM criteria with thresholds, his selling rules, a free screen with real counts and what the tests really show.
- Read Wyckoff ranges
Wyckoff Method: Accumulation, Distribution and Springs
Accumulation and distribution with phases A to E, springs and upthrusts as optional tests, and two real TSMC ranges read with and without hindsight.
- Trade Darvas boxes
Darvas Box Strategy: Rules, Entries and Stop Losses
The box rules step by step, when the edges become known, where the stop goes, and a mechanical test on TSMC in 2024 with two honest results.
- Count Elliott waves
Elliott Wave Theory: Rules, Patterns and Fibonacci
The five-wave pattern, three hard rules, zigzags, flats and triangles, Fibonacci ratios and a real DAX count, from the first German translator of the standard work.
- Understand Smart Money Concepts
Smart Money Concepts (SMC): What They Are and What Holds Up
The seven SMC building blocks, BOS vs CHoCH vs MSS, one labeled SPY sequence that held, one that failed, and what a chart can and cannot show.
- Understand ICT trading
ICT Trading: Silver Bullet, Killzones and What Holds Up
Michael Huddleston's Inner Circle Trader method: Silver Bullet, Judas Swing, the 2022 model and killzones in New York time, with one SPY setup that worked and one that failed.
- Trade order blocks
Order Blocks: How to Spot, Draw and Trade the Zone
The three conditions behind a valid order block, entry and stop at the zone, two SPY cases from 2026 and a 25-year count where a fixed rule lost money.
- Trade fair value gaps
Fair Value Gap (FVG): How to Spot, Trade and Test It
The three-candle rule, bullish, bearish and inverse FVG, two SPY cases from 2026 and a 25-year count of how often gaps were revisited and traded.
- Trade inverse fair value gaps
Inverse Fair Value Gap (IFVG): Rules, Examples and a Test
When a broken gap counts as inverted, three entry styles, one SPY retest that held, one that failed, and a 25-year test with trend and sweep filters.
- Trade failed breakouts with Turtle Soup
Turtle Soup Trading: Raschke Rules, ICT Version and a Test
Linda Raschke's original rules, Turtle Soup Plus One and the ICT version side by side, two SPY examples and a 25-year test on SPY and QQQ.
- Read a break of structure
Break of Structure (BOS): Rules, CHoCH vs MSS and a Test
Which swing counts, BOS vs CHoCH vs MSS under one stated convention, two SPY breaks that won and lost, and a 25-year test against ordinary days.
- Read a change of character
Change of Character (CHoCH): Rules, BOS vs MSS and Data
The first close against the trend, close versus wick, CHoCH vs BOS vs MSS, two SPY cases and what the trend did next after 287 CHoCHs on SPY and QQQ.
- Read a market structure shift
Market Structure Shift (MSS): Rules, BOS vs CHoCH and Data
MSS as a CHoCH with a sweep and a fair value gap, the comparison with BOS and CHoCH, two 2021 cases and what 14 daily MSS on SPY and QQQ did next.
- Draw supply and demand zones
Supply and Demand Trading: Zones, Rules and Real Data
Base and departure rules, the four base patterns, how zones differ from order blocks and SMC, two SPY cases and a fixed test of 86 zone trades on SPY and QQQ.
- Read liquidity sweeps
Liquidity Sweep: How to Spot It and Trade the Reversal
Sweep or run, buy-side and sell-side liquidity, internal and external targets, SPY reversal, continuation and failed-reversal examples and a 25-year count of a fixed sweep rule.
- Spot bull and bear traps
Bull Trap vs Bear Trap: How to Spot a Trapped Market
What bull traps and bear traps are, the two signs of trapped traders, how to trade the reversal with a defined stop, and two real SPY examples from 2025.
- Interpret volume
Volume Analysis in Trading: How to Read Volume Honestly
What volume counts in stocks, futures, forex and crypto, how to read it against its own average, and our SPY test of high-volume days since 2001.