
Forecasts you can check, on Karsten's own charts.
Chart-based forecasts for indices, metals, energy and forex, with named price levels.
 Karsten KagelsFirst shares 1980, trading since 1986
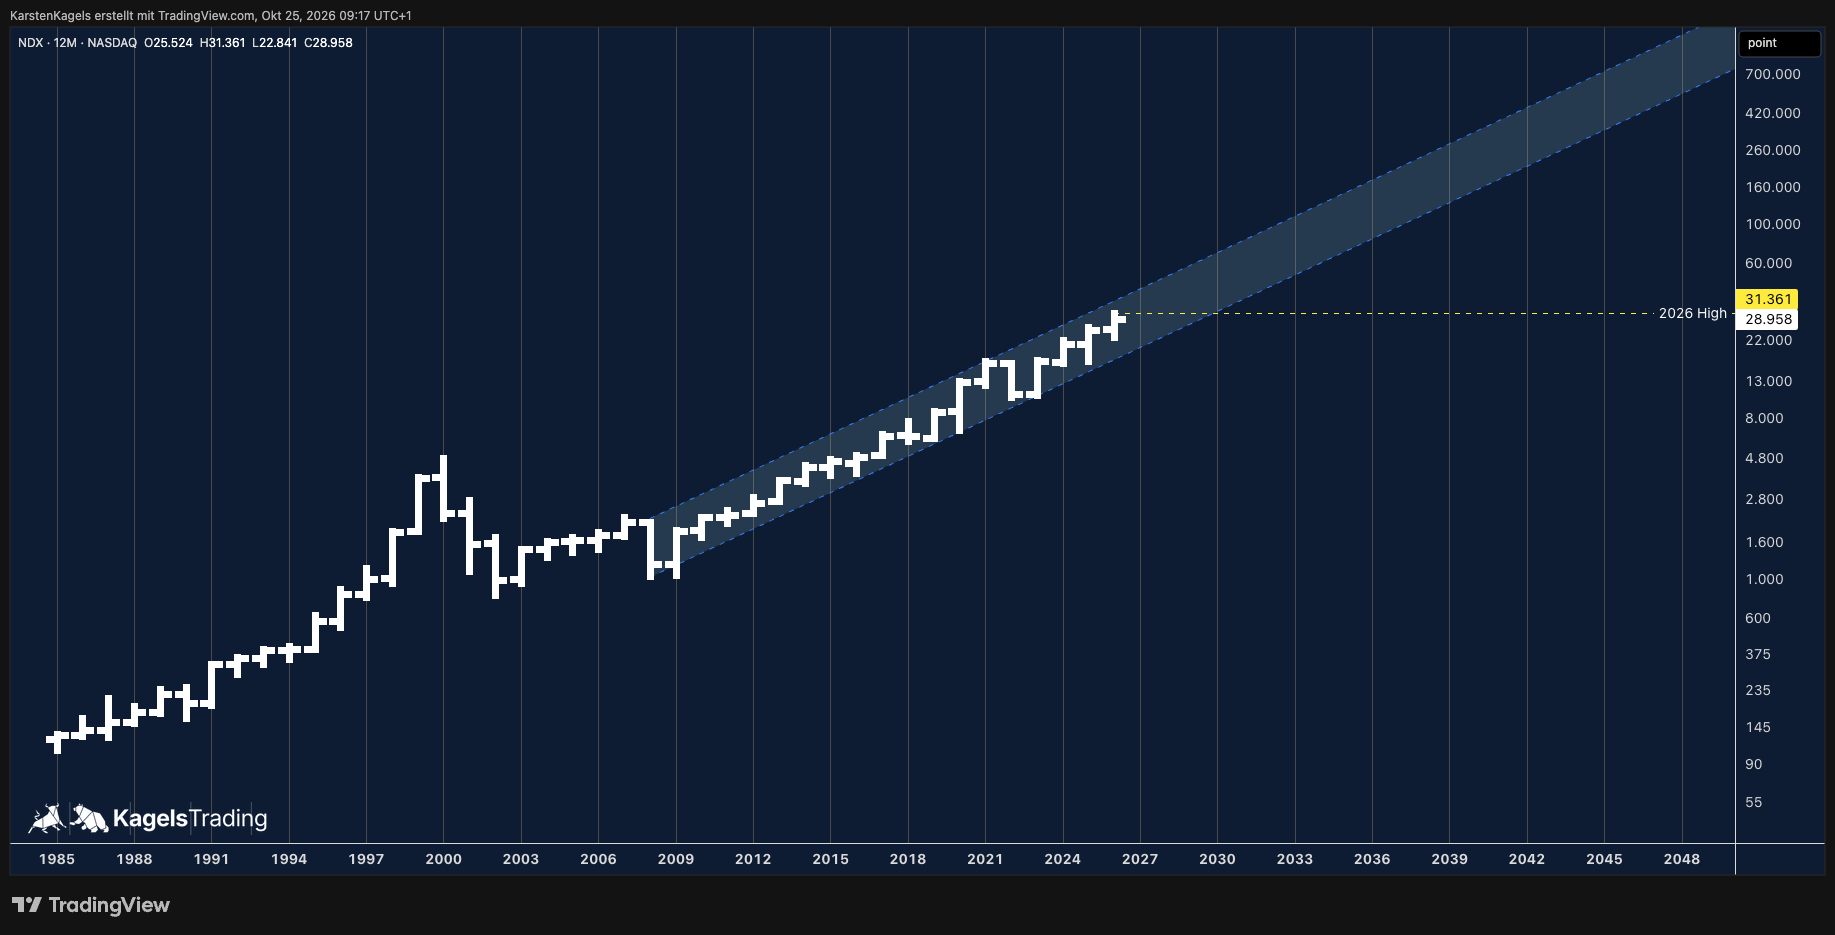 Click to enlarge
Where to start
- Read market forecasts →Find the current chart outlook and key levels for your market.
- Learn trading →A step-by-step path: market basics, risk and position size, a written plan and practice before real money.
- Find trading tools →Choose charting, research and trading software by task, with dated US dollar costs.
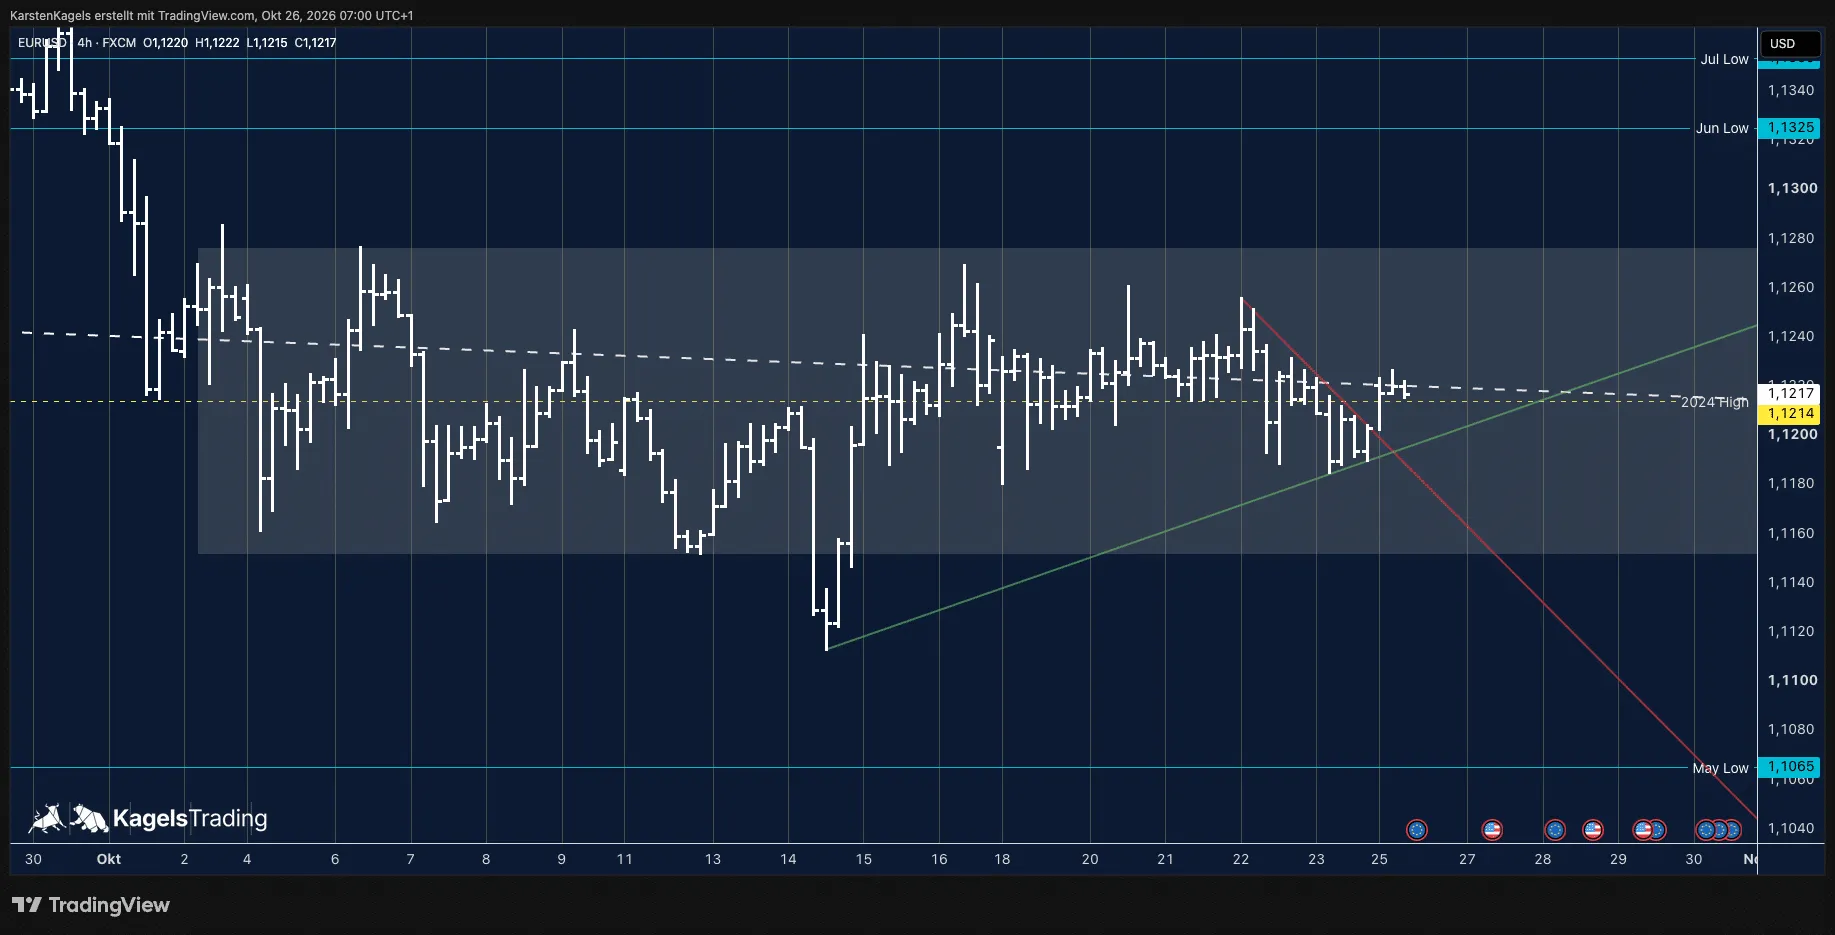
Latest chart updates
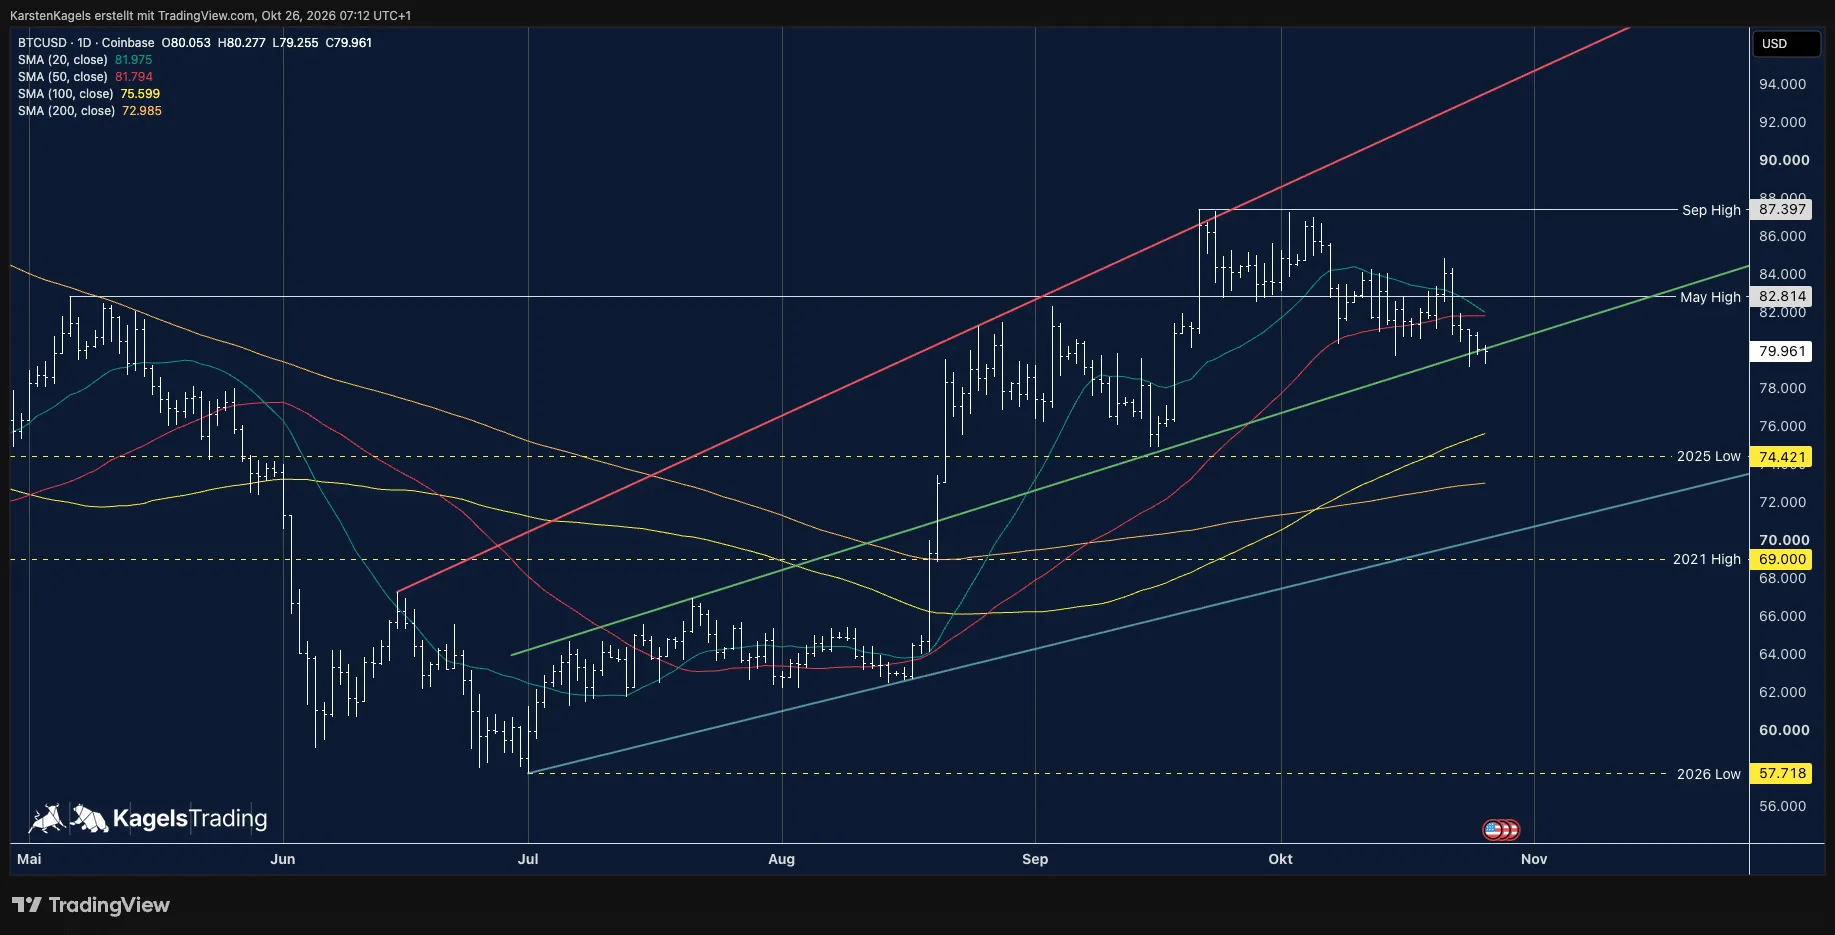
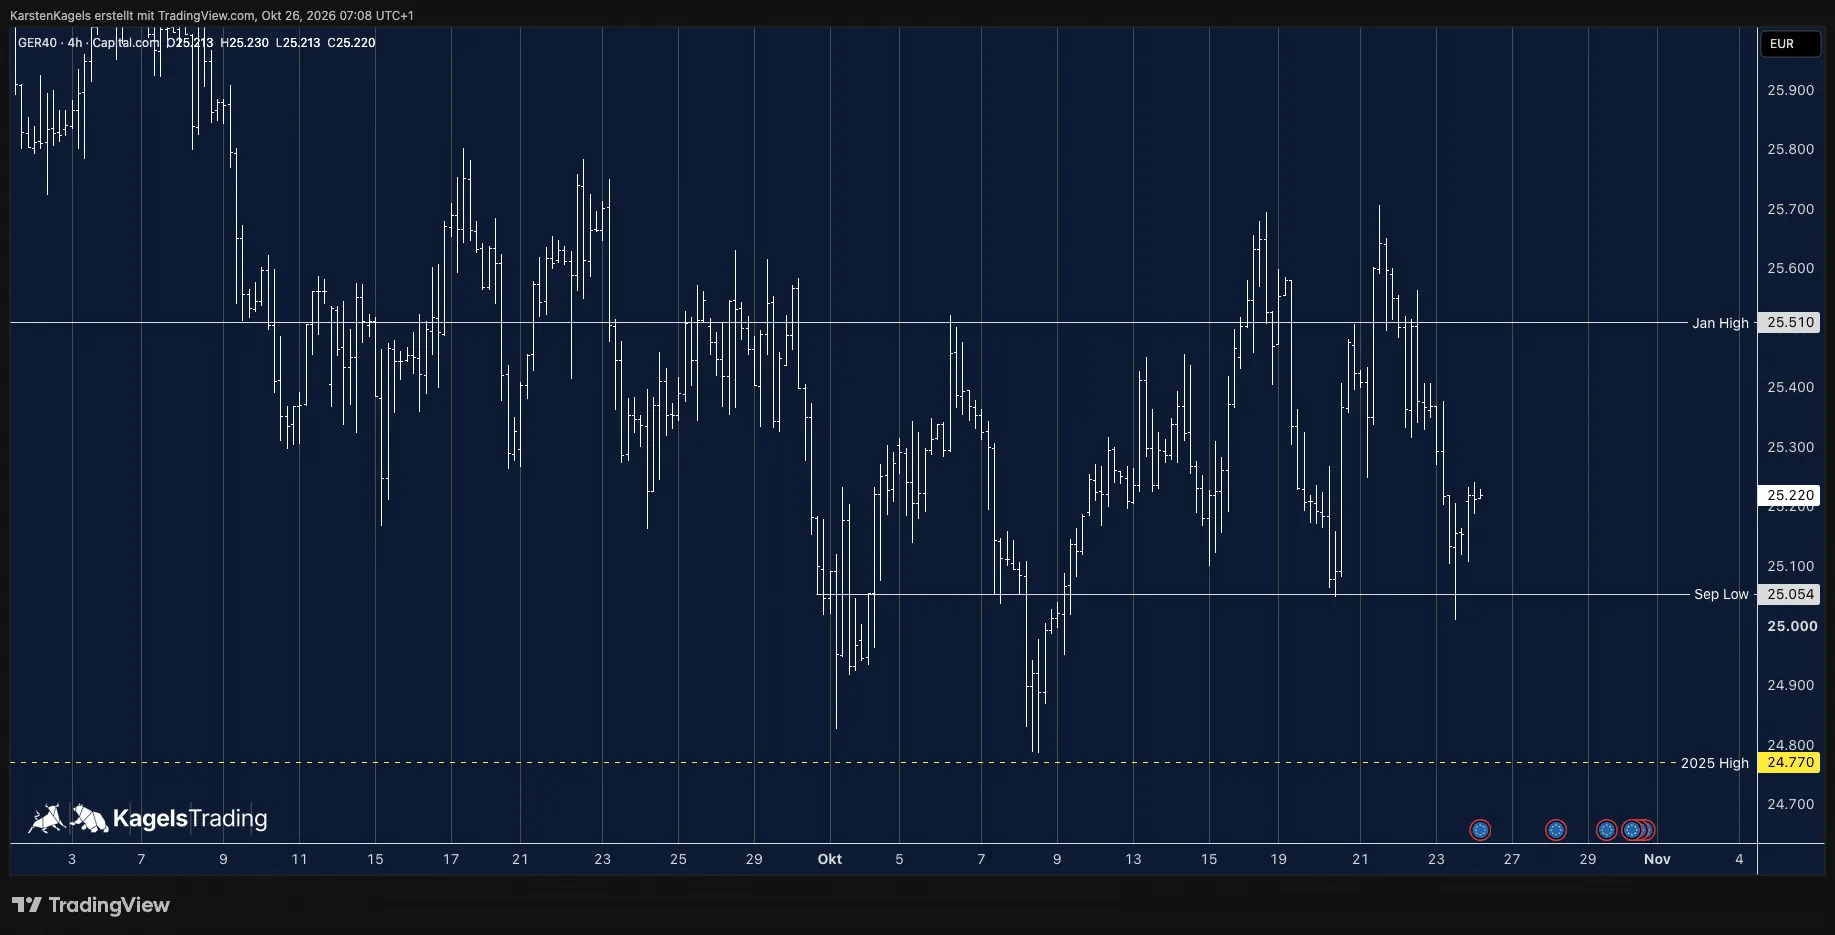
All forecasts →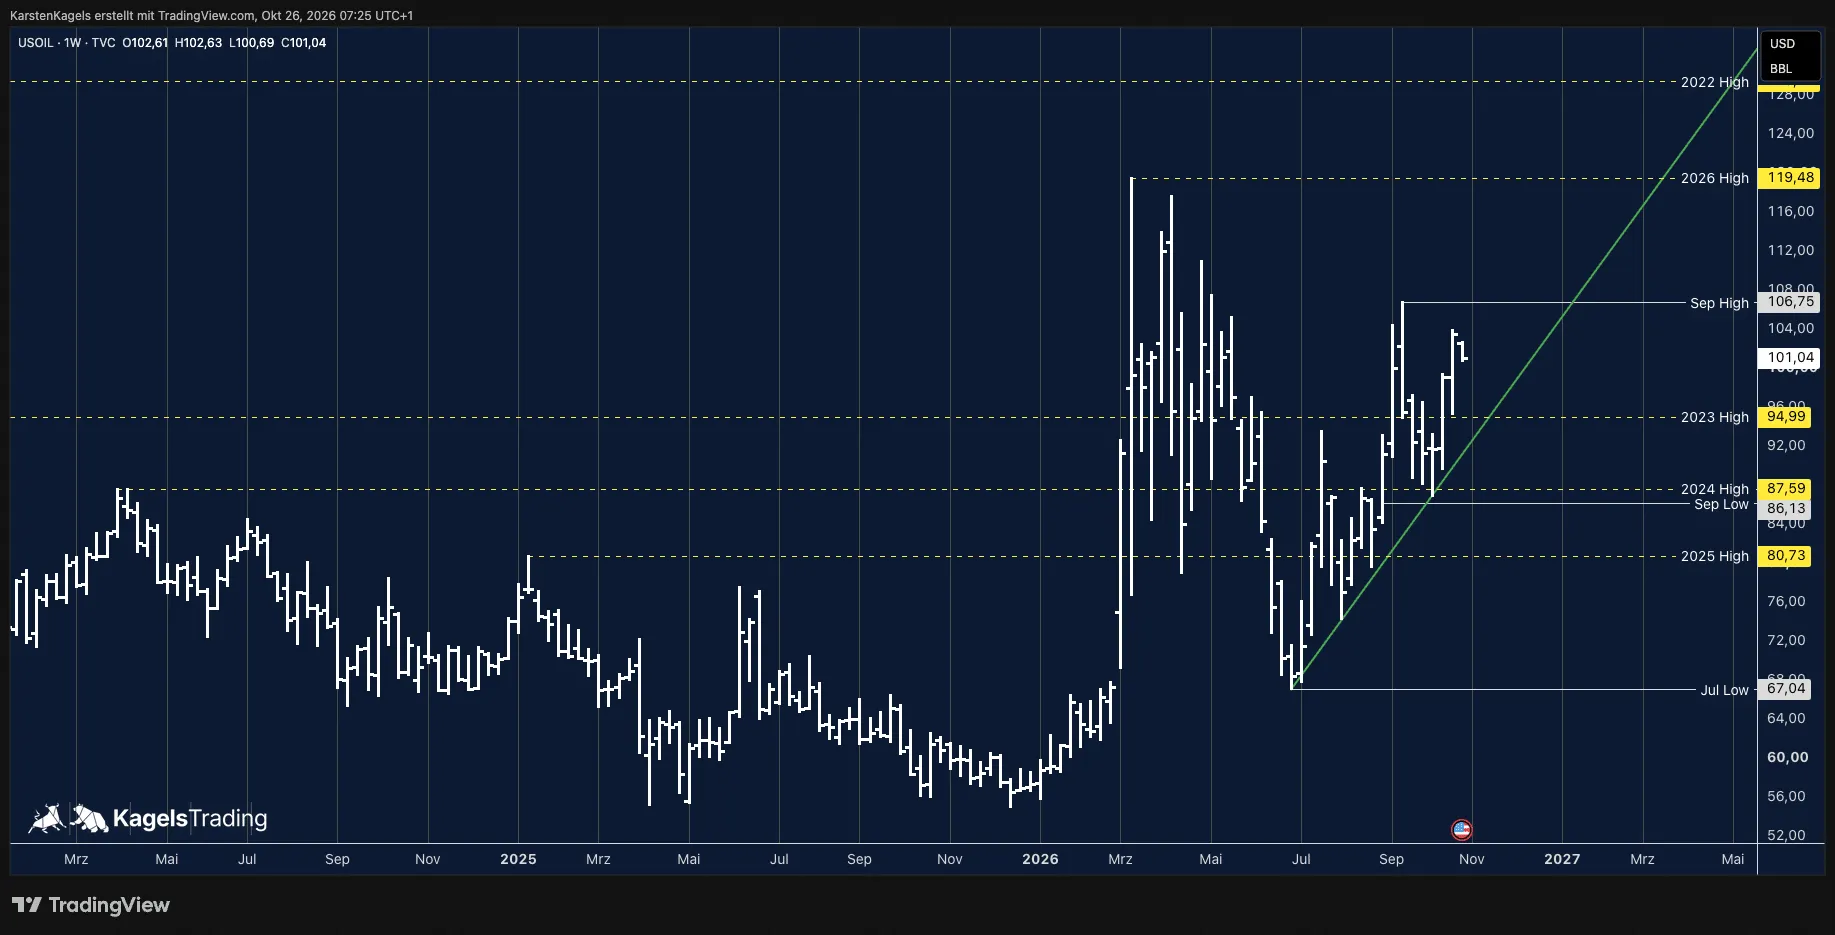
Start with these guides
- Draw key levels
Support and Resistance: How to Draw and Use Key Levels
Where useful levels come from, how to draw zones with a stated rule and how to turn a level into a trade plan.
- Manage your trading risk
Risk Management in Trading: Rules, Math, Psychology
The 1% rule, stops, risk/reward, daily loss limits, leverage caps and the psychology of losing streaks, with the math behind each rule.
- Calculate your position size
Position Sizing in Trading: Formula, Calculator, Examples
The formula, a free calculator, the 1% rule explained correctly, and examples for stocks, forex and futures.
- Learn the basics
How to Use TradingView: A Beginner Tutorial in 11 Steps
A beginner tutorial in 11 steps: chart, symbol search, drawings, indicators, log scale, watchlists, alerts, layouts and trading.
- Test a strategy properly
Backtesting: How to Backtest a Trading Strategy Properly
Five steps, five metrics and six mistakes, shown on a 32-year S&P 500 test with out-of-sample, walk-forward and the dividend trap.
Explore trading topics
Browse all topics →- Chart TechniquesHow Karsten Kagels reads charts: price action, support and resistance, breakouts, trendlines and Fibonacci, turned into a trade plan with real examples.
- TradingViewAll our TradingView guides in one place: plans and pricing, alternatives, brokers, backtesting and Pine Script. Written by a paying user since 2017.
- Risk ManagementHow much to risk per trade, how to stay disciplined and how to keep a trading journal: position sizing, stops, trading psychology and journal software reviews.
- Technical IndicatorsHow popular trading indicators are calculated, how to read their signals and what our own tests on long price histories show about them.
- BacktestingHow to backtest a trading strategy by hand or automatically: the steps of a clean test, the metrics that matter, common mistakes and forward testing.
- Market HoursWhen markets trade: CME futures hours, the Asian, London and New York sessions, RTH and ETH, holidays and daylight saving, in ET and London time.
- Central BanksFed, ECB, Bank of Japan, Bank of England, SNB, Bank of Canada and RBA rate decisions for traders: meeting dates, times, latest decisions, market reaction.
- Trading SoftwareWhich trading software you need by task: charts, stock research, seasonality, order flow, execution, backtesting and journals, with dated US dollar costs.
All forecasts by market
Forecast overview →Latest articles
All articles →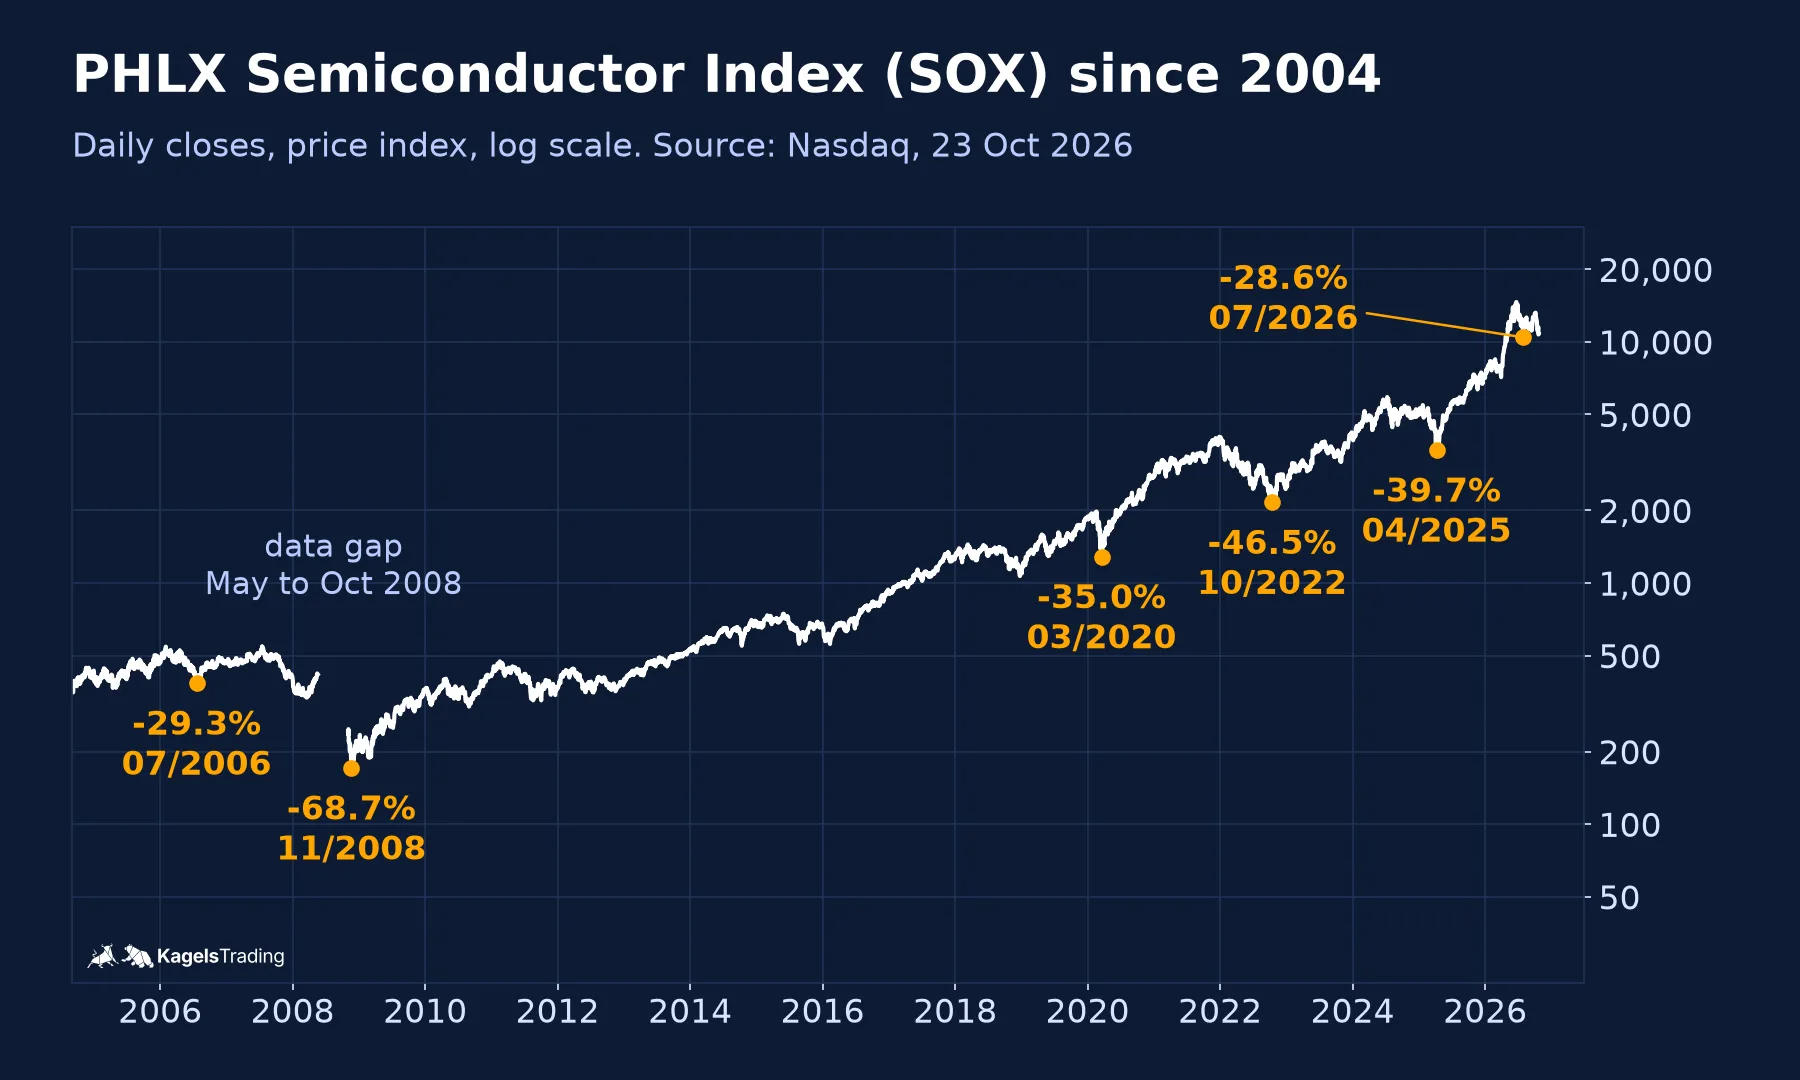 SOX Index: Holdings, Weighting and How to Use ItWhat the PHLX Semiconductor Index (SOX) contains, how Nasdaq weights it, how it compared with the Nasdaq-100 since 2004 and which ETFs really track it.
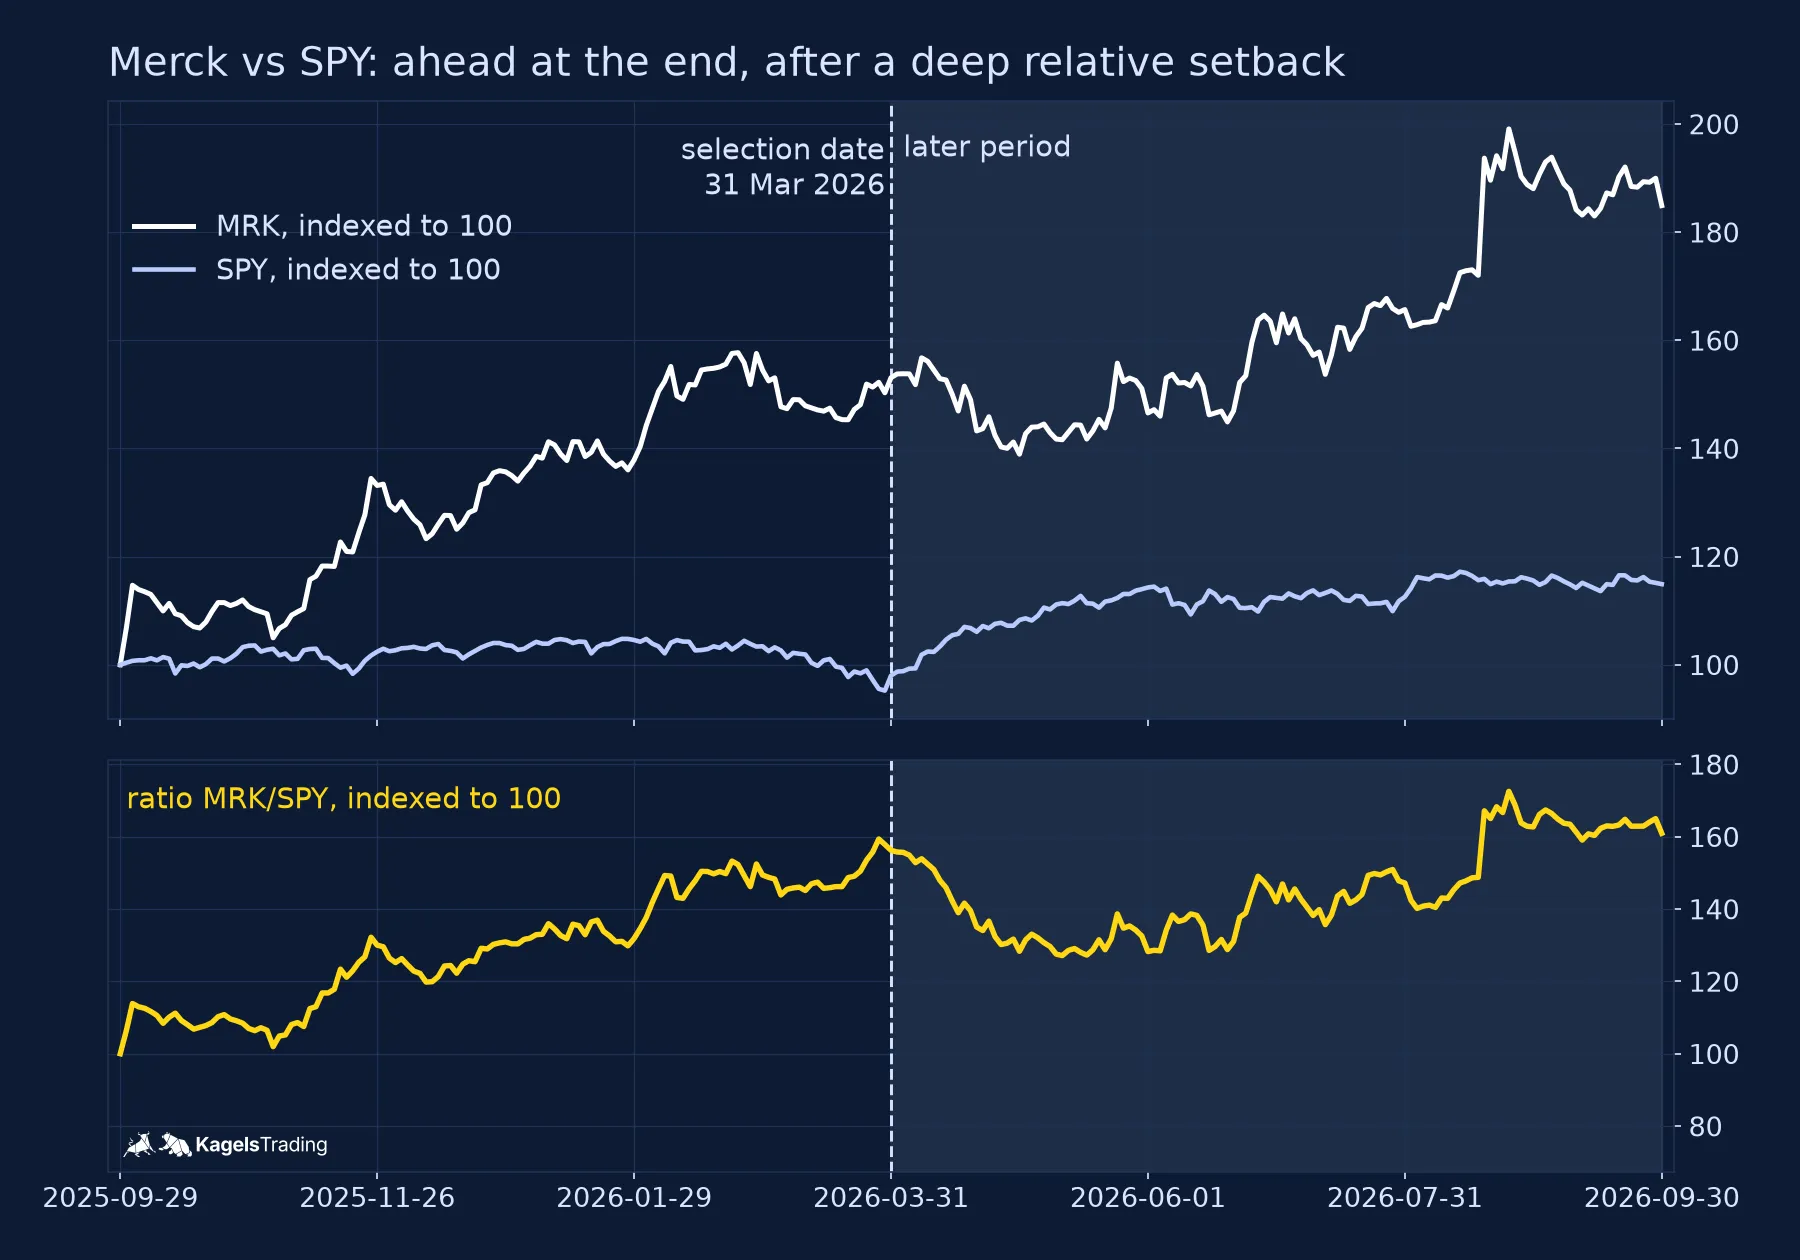 Relative Strength: Compare Stocks with the MarketHow to calculate a stock's relative strength against a benchmark, why it is not the RSI, and a five-step watchlist process with two real Dow examples from the same selection date.
- Micro Futures: MES vs MNQ, Tick Values and RiskWhat micro futures are, how MES and MNQ differ in tick value and size, and how to size a position from your stop, with costs, slippage and margin shown separately.
How Karsten reads the market
- Classical chart technique
- Support, resistance, trend structure and price targets, marked directly on the chart.
- Named levels, no hype
- Clear price levels you can check, instead of vague calls or signals-for-sale theatre.
- A public record
- Forecasts have appeared openly on kagels-trading.de since 2015, where anyone can check them.