
TradingView Review 2026: Plans, Pricing and Is It Worth It?


Contents
- TradingView in 30 seconds
- What is TradingView?
- Downloading TradingView: desktop app, browser or smartphone
- TradingView login: creating an account, signing in and changing the language
- The interface: how the TradingView chart is organized
- How much does TradingView cost? All plans at a glance (2026)
- TradingView discounts and the Black Friday sale
- Using TradingView for free: what the free version can do
- TradingView real-time data: what costs extra
- Which plan suits which trader?
- Is TradingView worth it?
- My experience with TradingView since 2017
- Pros and cons of TradingView
- Connecting TradingView to a broker
- Alternatives to TradingView
- Conclusion: TradingView stays my standard, despite higher prices
- Frequently asked questions about TradingView
- About the author
I have used TradingView as my main charting software since August 2017, today on the Ultimate plan. Christian Möhrer writes the technical forecasts for our site in it, most of our signal providers and trainers work with it too, and we have built our own indicators for the platform.
This review is based on my own experience as a paying customer. You will find the current prices of all five plans in US dollars, what real-time data for US markets really costs, when the yearly Black Friday sale runs, and my answer to the big question: is TradingView worth it, and is the free version enough? There is also a guide to download, account and setup. TradingView has completely rebuilt its pricing, and many reviews still describe the old model.
TradingView in 30 seconds
- TradingView is a web-based charting platform with a built-in social network. It comes with more than 400 indicators, plus more than 150,000 community scripts in its own language, Pine Script. It runs in the browser, as a desktop app and on your phone.
- Prices in 2026: five plans, from Basic ($0) through Essential ($14.95), Plus ($34.95) and Premium ($69.95) to Ultimate ($239.95) per month. Paying yearly is up to 17 percent cheaper. Essential, Plus and Premium offer a 30-day free trial; Ultimate offers 14 days.
- Real-time data costs extra: for non-professional users, the US stock market bundle costs $9.95 a month and CME futures $9.95. Professional users pay far more.
- Black Friday: TradingView’s biggest sale of the year runs around Black Friday, which falls on 27 November in 2026.
- Is it worth it? For daily chart work, yes. If you only check prices now and then, the free Basic plan is enough.
What is TradingView?
TradingView is a web-based charting platform with a social network for traders. TradingView is not a broker: it does not execute orders and does not hold client money. You trade through a connected broker account; the platform provides the charts, analysis and alerts.
TradingView launched in 2011 as a web-based charting platform. You need no installation, no data packages and no broker account to start: a free account is enough.
All major asset classes are covered: stocks, forex, cryptocurrencies, commodities, bonds and indices. According to the company, more than 3.5 million instruments from exchanges around the world are available.
The second building block is the community: users publish their analyses as so-called ideas, share indicators and discuss setups. So you can see how other traders read the same chart. That does not replace your own analysis routine, but it gives you views you would not get on your own.
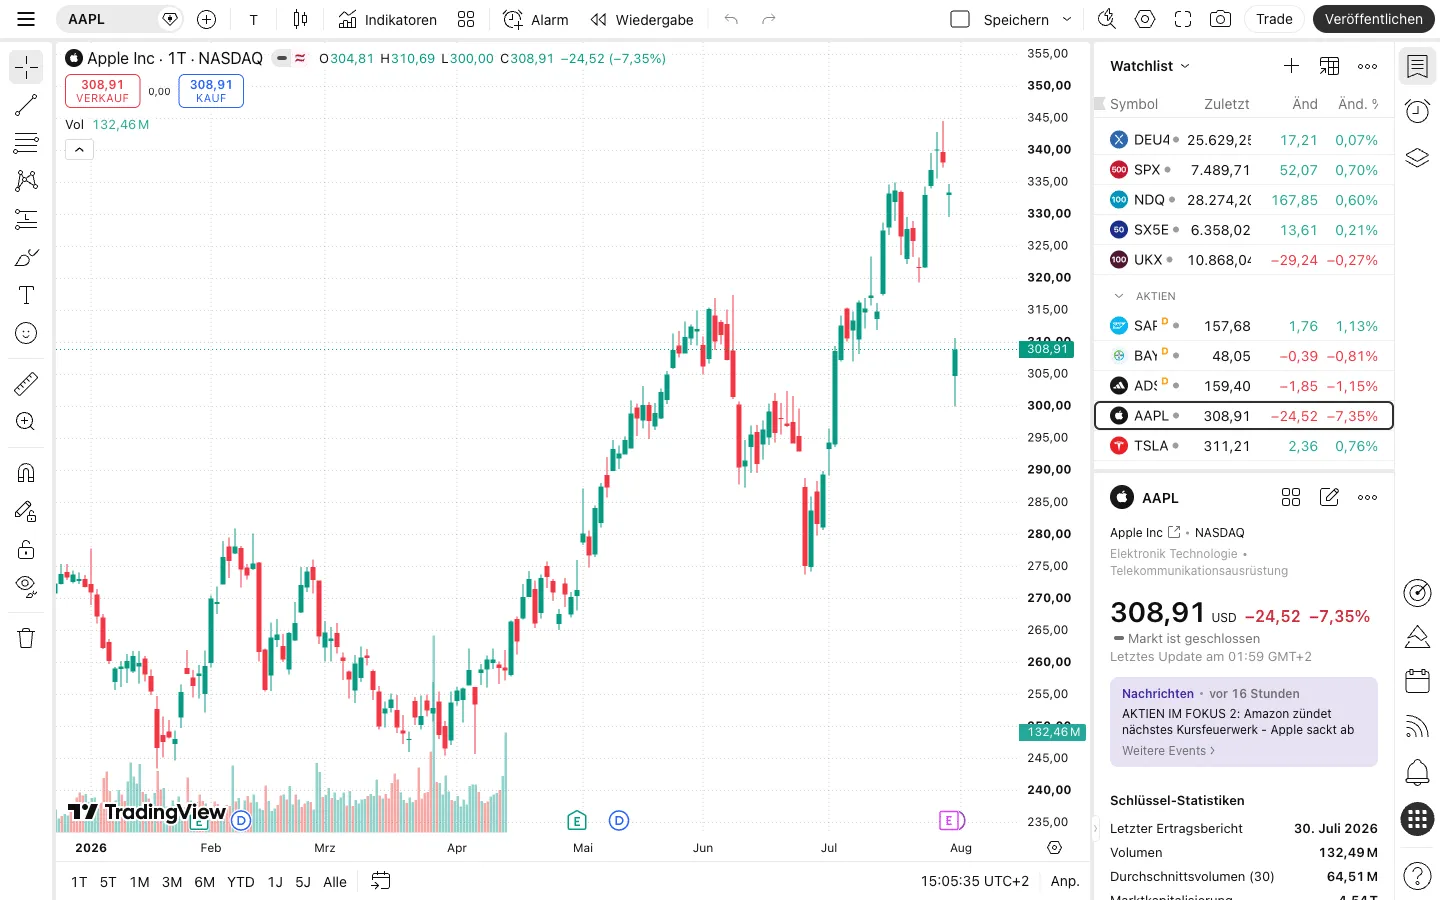 The TradingView chart interface: drawing tools on the left, indicators at the top, watchlist on the right.
Downloading TradingView: desktop app, browser or smartphone
TradingView runs in the browser without installation. There is also a free desktop app for Windows, macOS and Linux, and apps for iOS and Android. All versions use the same account and the same saved charts.
Many traders first look for a download and are surprised that the platform does not need one. That is the key point up front: you can start straight away in the browser without installing anything. The desktop app is an extra, not a must. It costs nothing and is part of every plan, including the free Basic account.
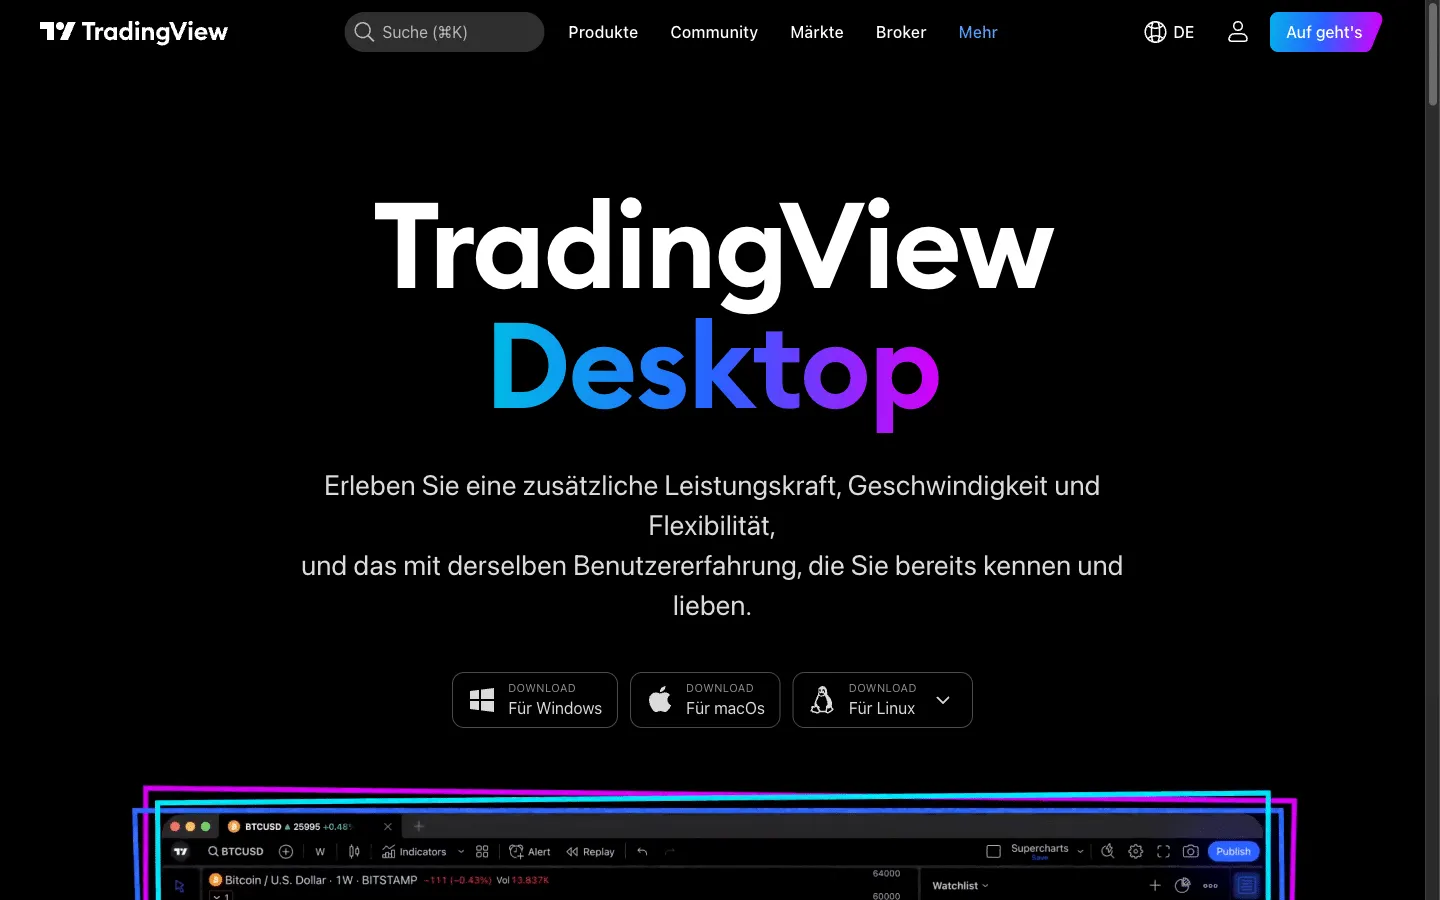 The desktop app is available for Windows, macOS and Linux, free and included in every plan (as of 4 September 2026).
The desktop app for Windows, Mac and Linux
You download the desktop app directly from TradingView. Each operating system gets its own package: for Windows a file called TradingView.msix, which installs through the Windows installer without a Microsoft Store account. For macOS a TradingView.dmg, which you open and drag into the Applications folder. For Linux a package called tradingview_amd64.deb, built for Ubuntu. Other distributions you need to check yourself.
The practical advantage of the desktop app is window management. It supports several monitors natively and restores your workspace after a restart. If you work with four or six charts on two screens, you notice the difference at once. Our guide to trading laptops explains what hardware you need for a setup like this. Saved chart layouts remain available in the browser too.
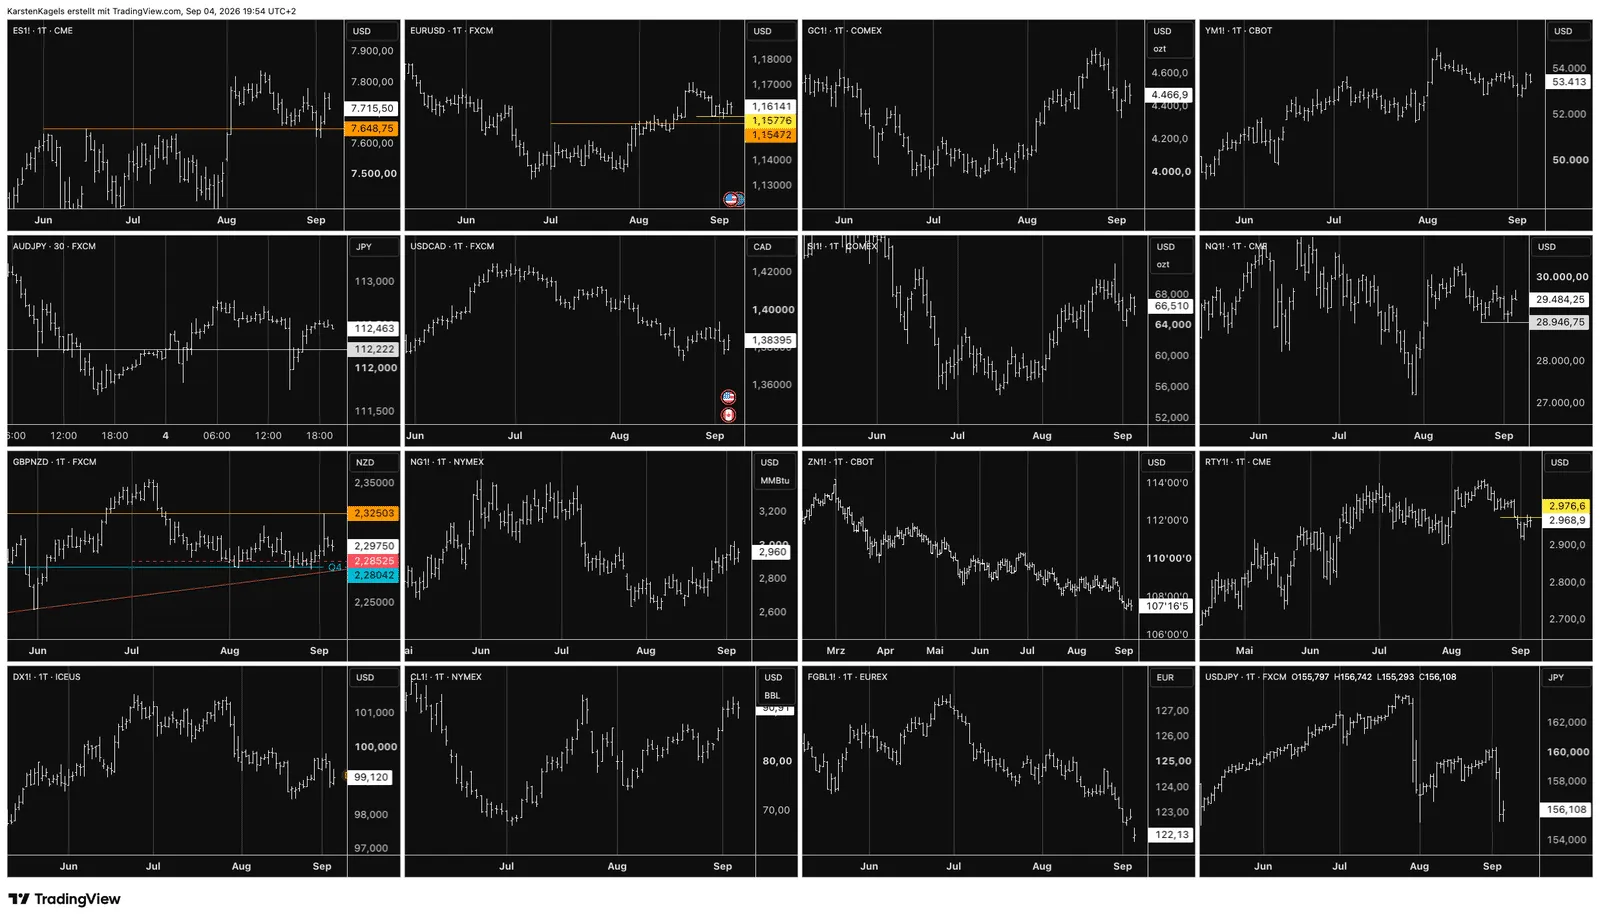 16 charts in a single tab: stock index, interest rate, energy and metal futures next to currency pairs. This number of charts per tab is only available on the Ultimate plan (my own account, 4 September 2026).
This is what it looks like in practice: 16 charts in a single tab, from stock index futures through interest rates, energy and metals to currency pairs. How many charts you can place side by side depends on the plan, not on the desktop app: 1 on the free Basic plan, 2 on Essential, 4 on Plus, 8 on Premium and 16 on Ultimate. The desktop app also restores your window arrangement after a restart.
One point that is often overlooked: the desktop app is not a standalone program with local data. It loads the same content as the web version and needs an internet connection. TradingView has no offline charting, in any version.
The mobile app for iOS and Android
You get the mobile app from the App Store and Google Play. It is meant for checking in on the go, not for analysis on a big screen. It works well for receiving alerts, checking prices and keeping an eye on a position. It works less well for drawing clean lines on a small chart.
What the app really does day to day: push notifications for triggered alerts arrive without going through email, and your watchlists appear on the phone in the same order as on your monitor. The app is free and included in every plan, including the Basic account; there is no separate mobile plan. What you should not expect: several charts side by side, precise drawing and work with the screener remain jobs for the big screen.
From my own practice: I draw my levels in the evening at the monitor. When an alert comes in during the day, I see exactly the same lines on my phone, because everything is stored in the cloud. That is exactly what the app is good for.
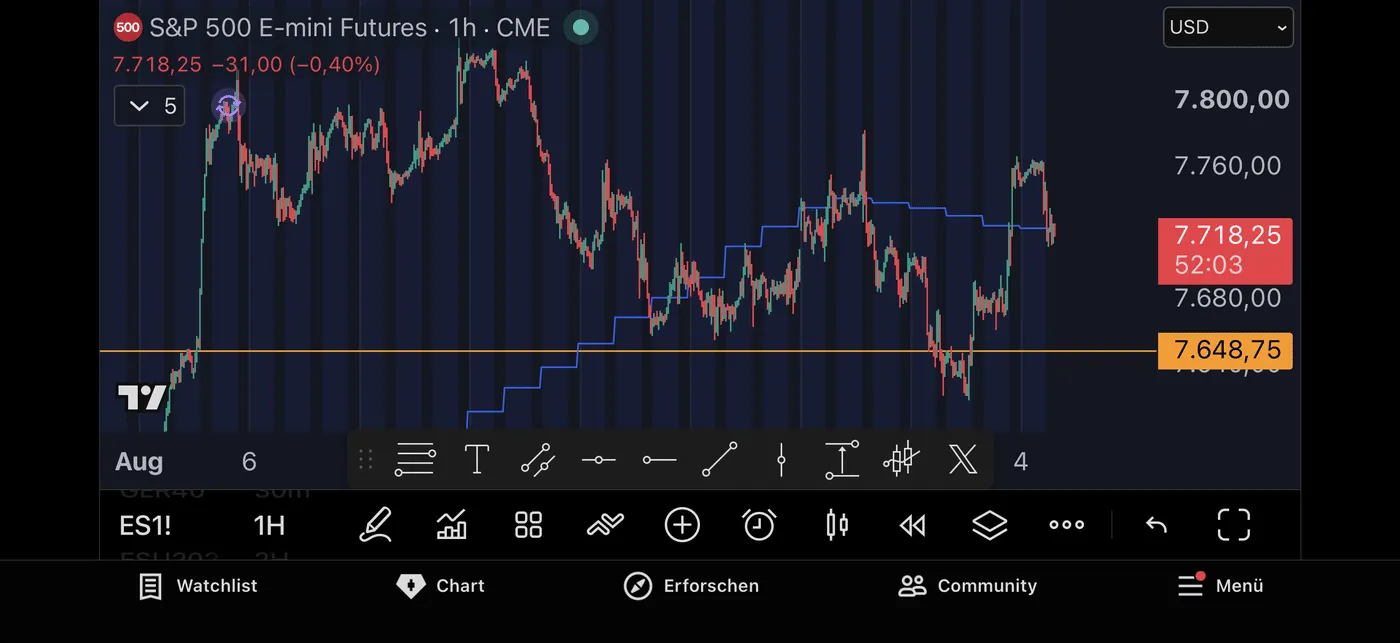 The mobile app with the S&P 500 future on the hourly chart. The orange level at 7,648.75 is the same one shown in the desktop layout above.
You can even check this in this article: the orange level at 7,648.75 on the phone chart is the same line that sits on the S&P future in the 16-chart layout above. Both screenshots were taken on the same evening, once at the monitor and once on the phone. That is what cloud sync means in everyday use: you draw once and see it everywhere.
When the browser is enough
For getting started, the browser is fully sufficient. The features are identical; only window management is missing. On Linux, the browser is often the easier route if you do not use an Ubuntu-based system. My recommendation by type of use: occasional analysis in the browser, daily work with several charts in the desktop app, checking in on the go with the mobile app.
TradingView login: creating an account, signing in and changing the language
A free account is all you need for TradingView. You can sign up with email, Google, Apple or other services. No credit card is required for the free version.
Signing up takes less than two minutes. On the sign-up page you can register by email, through Google, and through several more providers behind the option for other services. TradingView states clearly on its pricing page that no credit card is needed for the Basic account. So you can try the platform fully without entering payment details.
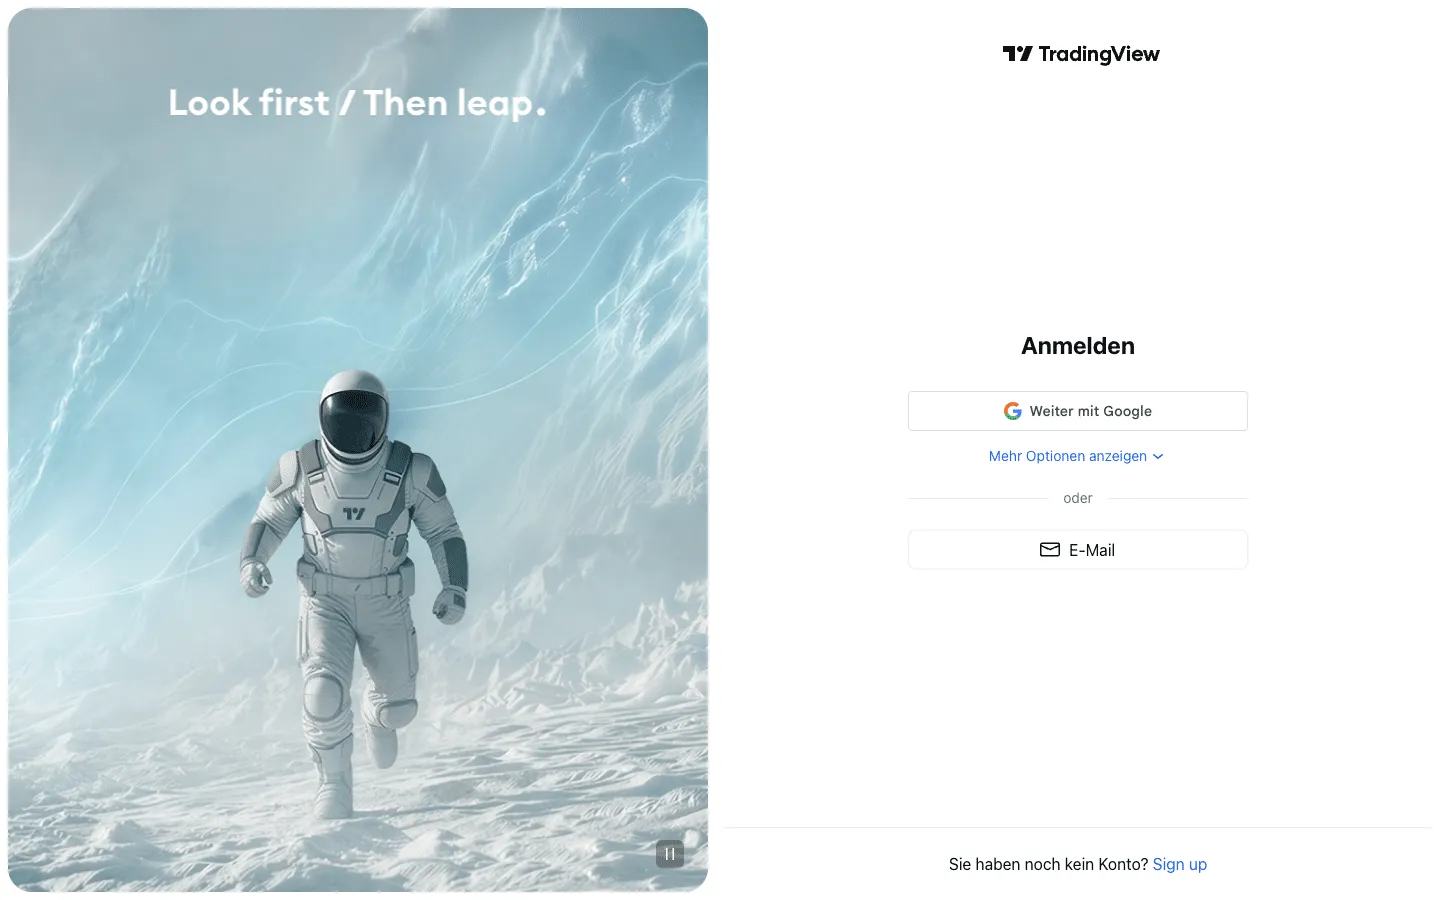 Sign-up works with Google, email or other services. No credit card is required for the free Basic account.
The interface is available in many languages. If it appears in the wrong language, that is down to the language setting, not your plan. You change it with the globe icon in the header.
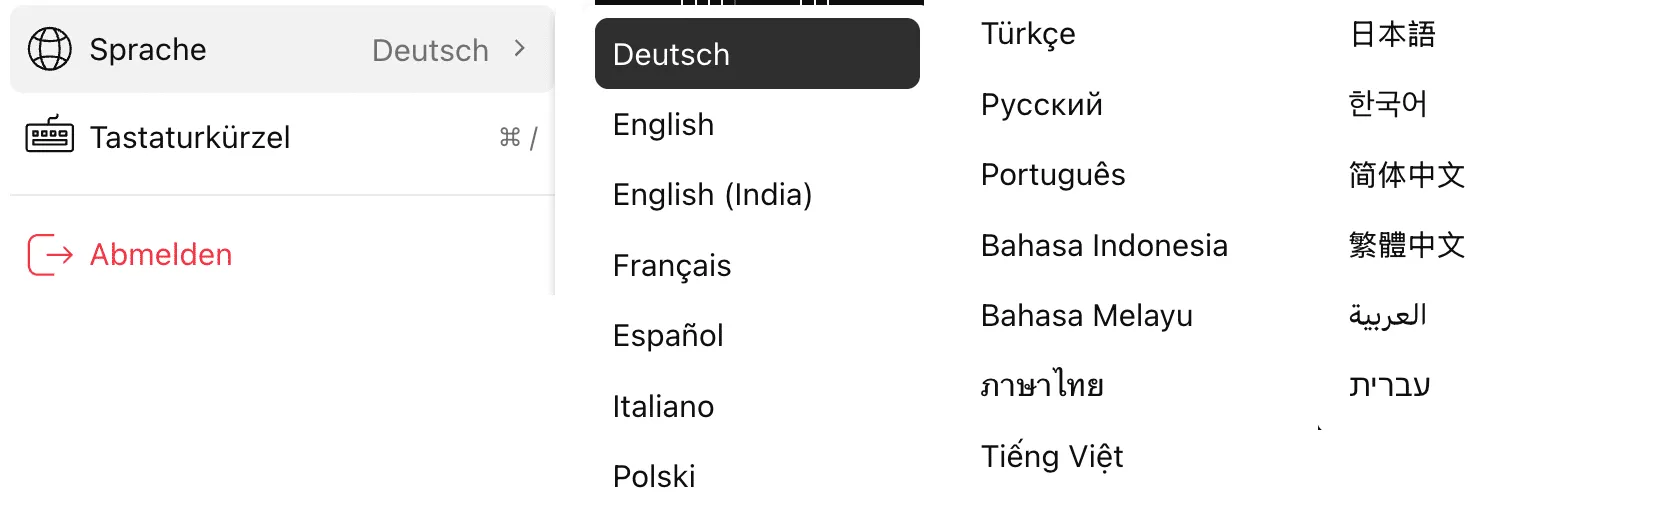 The language menu: German is at the top and active here, with around twenty other languages below.
After signing in, you land on the chart. From there, the first thing worth a look is the watchlist on the right. Add the markets you actually follow. A list of five symbols you look at every day takes you further than one with fifty.
The interface: how the TradingView chart is organized
TradingView can do far more than this article needs to show in detail. Here are the features that matter in a trader’s daily work.
The chart interface looks busy when you first open it, but it follows a clear layout. At the top are the symbol, timeframe and chart type. On the left are the drawing tools. On the right sit the watchlist, news and calendar. At the bottom you open the Pine Editor and the strategy report. Once you know these four areas, you will find everything else on your own.
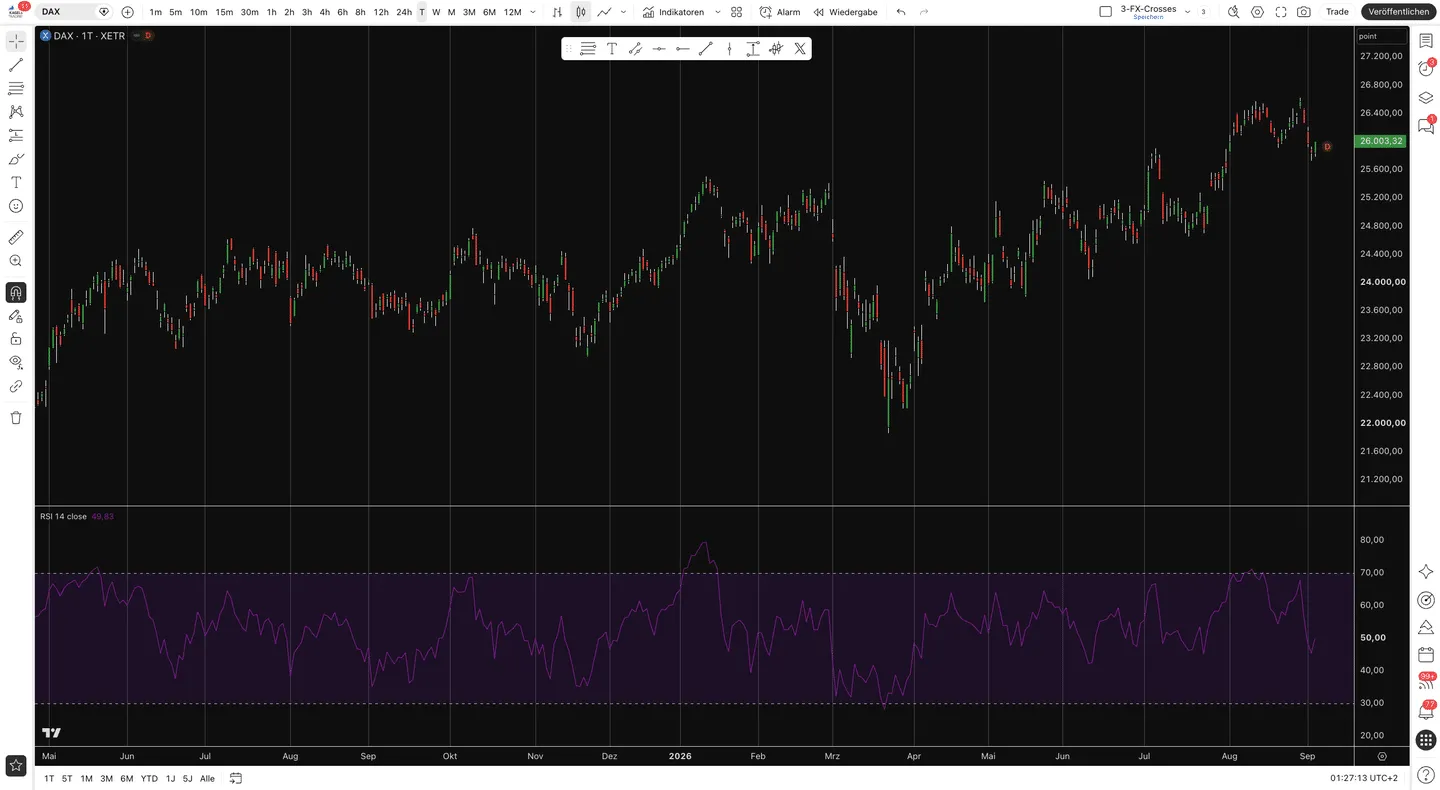 How the interface is organized: symbol and timeframe at the top, drawing tools on the left, the indicator in the panel below.
To trade through TradingView, you also need a connected broker. Which one fits depends on your markets and your costs; mine is Interactive Brokers.
Charts and drawing tools
Charting is the core of the platform, and in my view the best on the market. Depending on your plan, you get 17 to 21 chart types, from the classic candlestick chart through Heikin Ashi to Renko and Point & Figure. On top of that come over 110 drawing tools: trend lines, Fibonacci retracements, channels, position size tools. Everything responds smoothly. With autosave enabled, your changes are saved to the cloud automatically.
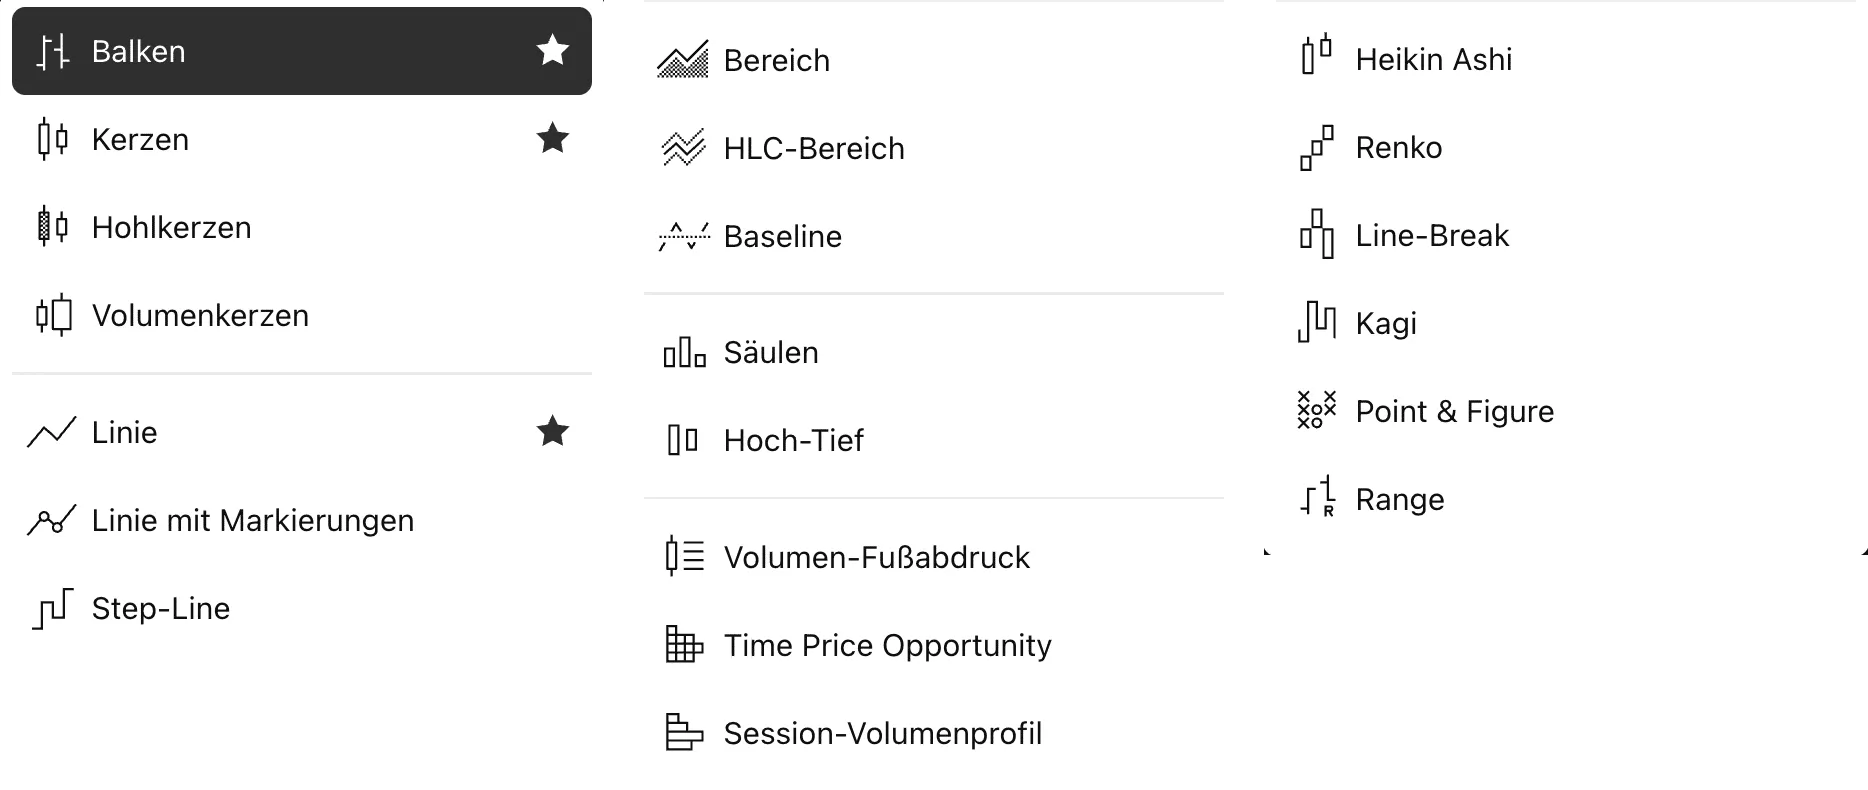 The chart type menu: 21 chart styles, from bars and candles through volume footprint to Renko, Kagi and Point & Figure.
The full list includes 21 chart styles. Besides the classic forms such as candles, bars and line, there are Heikin Ashi, Renko, Kagi, Line Break and Point & Figure, plus views such as Volume Footprint, Time Price Opportunity, Session Volume Profile and Volume Candles. Basic includes 17 chart types; Premium and Ultimate include 21. Some chart types also have restrictions on intraday use.
A single group shows how deep this goes. For Fibonacci alone there are eleven tools, from retracement through channel and time zones to arcs, spiral and wedge. Right below comes the Gann family with four more.
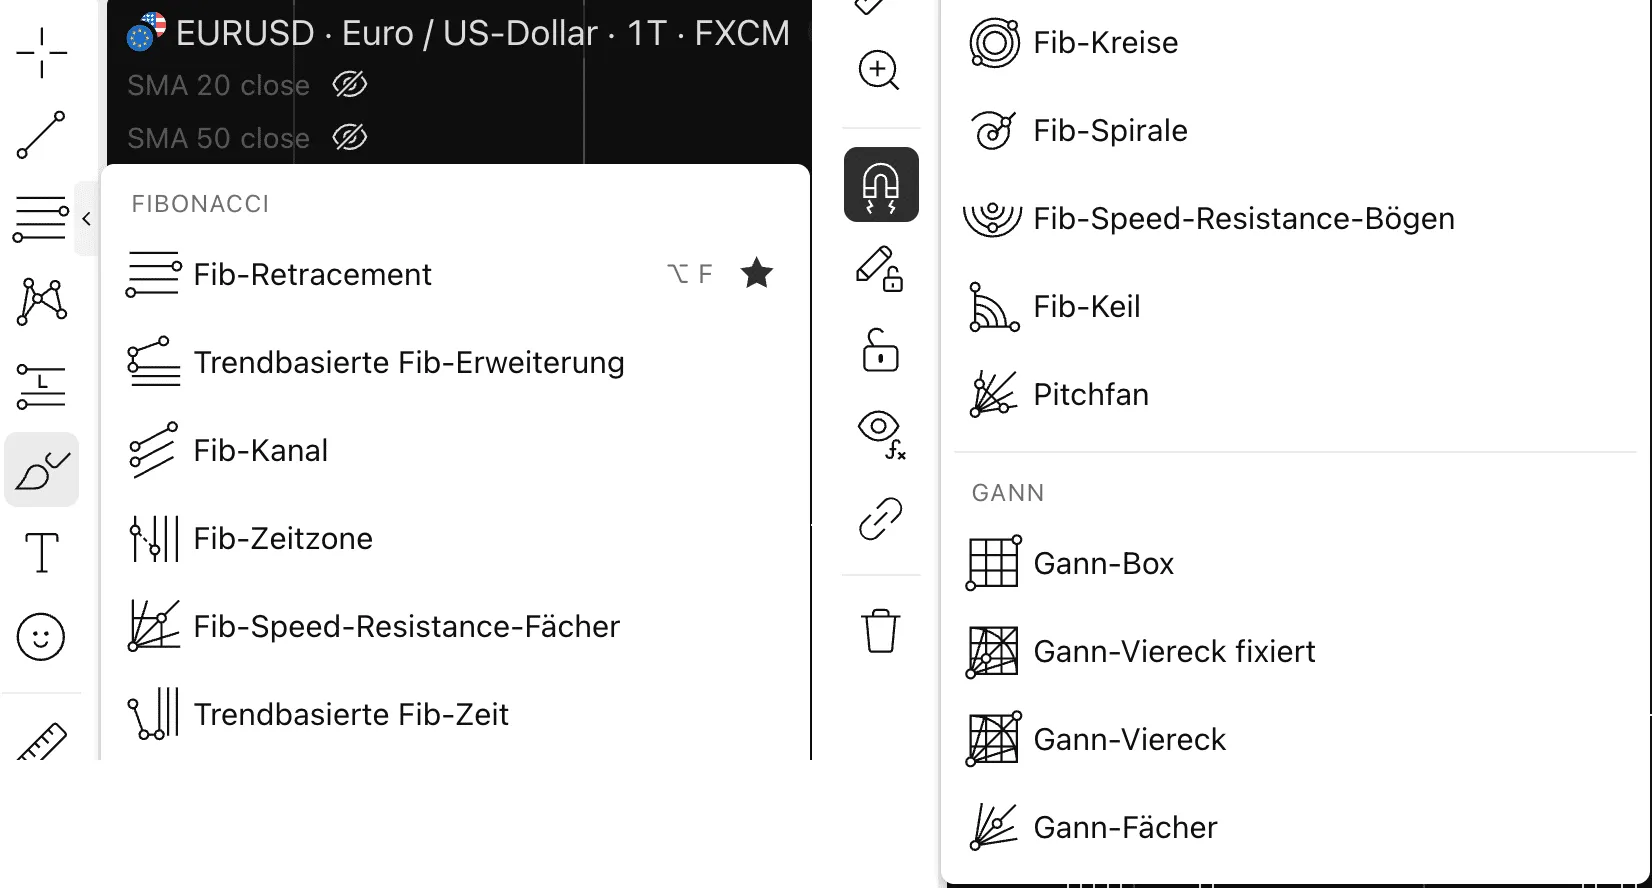 The drawing toolbar with the Fibonacci group opened: eleven tools for Fibonacci alone, with the Gann family below. The star marks favorites; the keyboard shortcut is on the right.
Two details from daily work that you will not find in any feature list: frequently used tools can be marked as a favorite with a star, which moves them to the front toolbar. And each tool gets a keyboard shortcut; the Fib retracement, for example, is on Alt and F. If you use the same three tools every day, this saves you going through two menu levels. It sounds like a small thing, and after a few hundred charts it makes the difference.
Indicators
More than 400 indicators come pre-installed, from moving averages to volume profiles. On top of that there are more than 150,000 community scripts. How one of the most-watched built-in indicators works, with its settings, is in our VWAP guide. Kagels Trading GmbH has developed its own signal indicators for TradingView, including Fibo Cross and Swing Catcher. An honest word on this: if you trade purely on price action and do not want signal providers, you do not need these indicators.
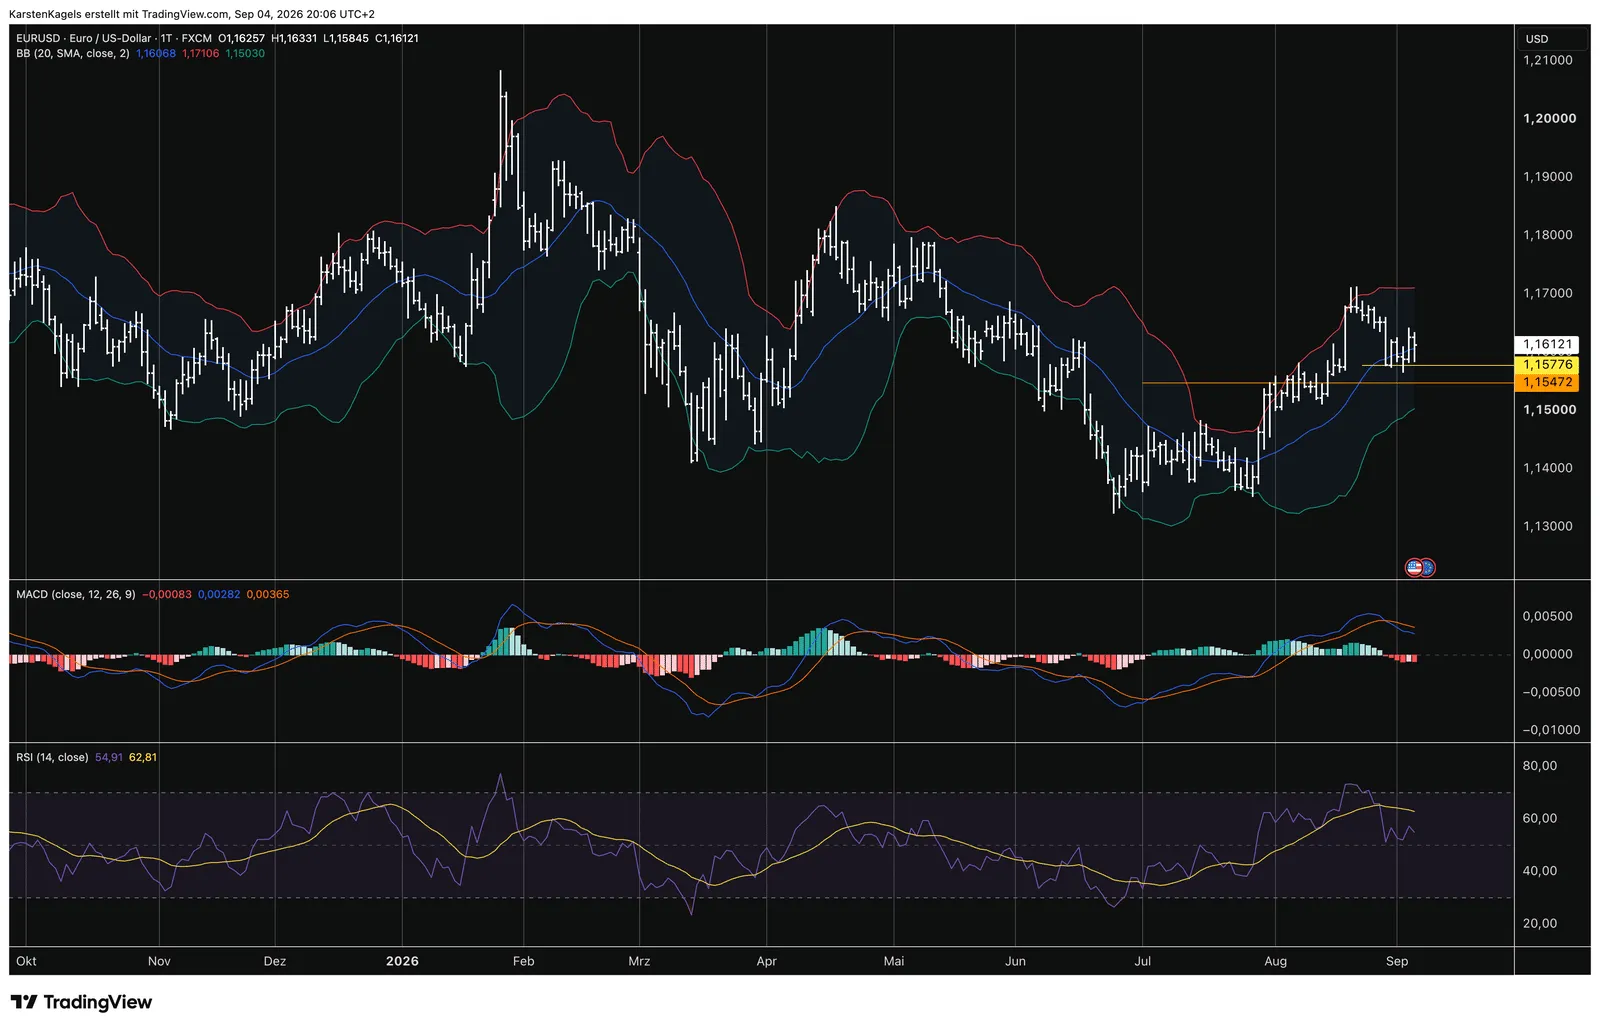 Three built-in indicators at once: Bollinger Bands on the price chart, with MACD and RSI in their own panels below (EUR/USD daily chart, 4 September 2026).
This is what it looks like day to day: Bollinger Bands sit directly on the price chart, while MACD and RSI each get their own panel below. Every indicator’s settings can be adjusted, here for example the RSI at 14 periods and the MACD at 12, 26, 9. How many indicators you can have on one chart depends on your plan.
You choose them in the indicator dialog. It mixes the built-in standards with scripts from the community, which you can recognize by the author’s name next to the entry.
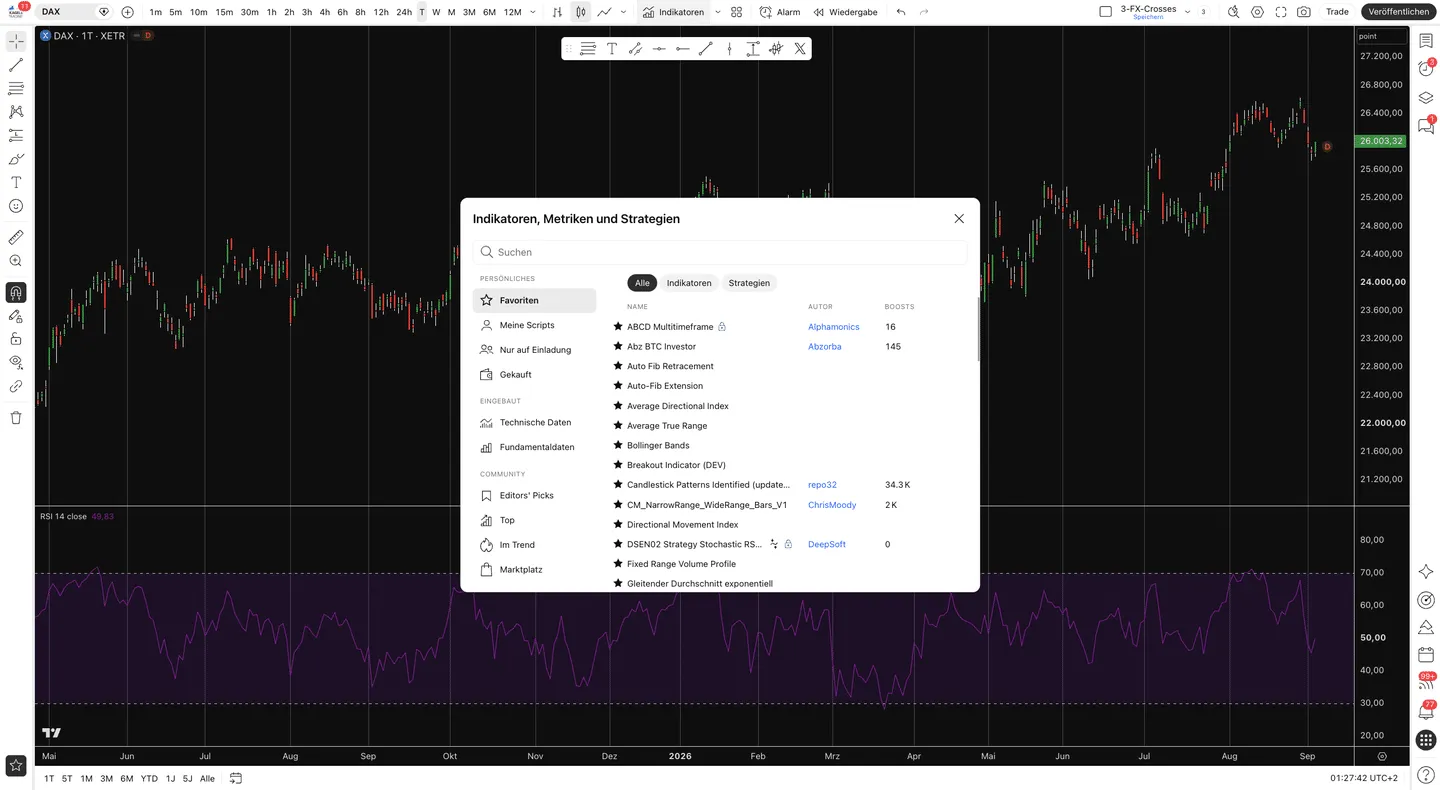 The indicator dialog mixes built-in standards such as Bollinger Bands and Average True Range with scripts from the community.
Screener
The TradingView screener is a filter tool for stocks, ETFs and cryptocurrencies. It searches more than 150 exchanges in over 50 countries using fundamental and technical criteria.
With the screener, you can, for example, find stocks making new 52-week highs on rising volume in seconds. A step-by-step walkthrough with three tested screens is in our TradingView stock screener guide.
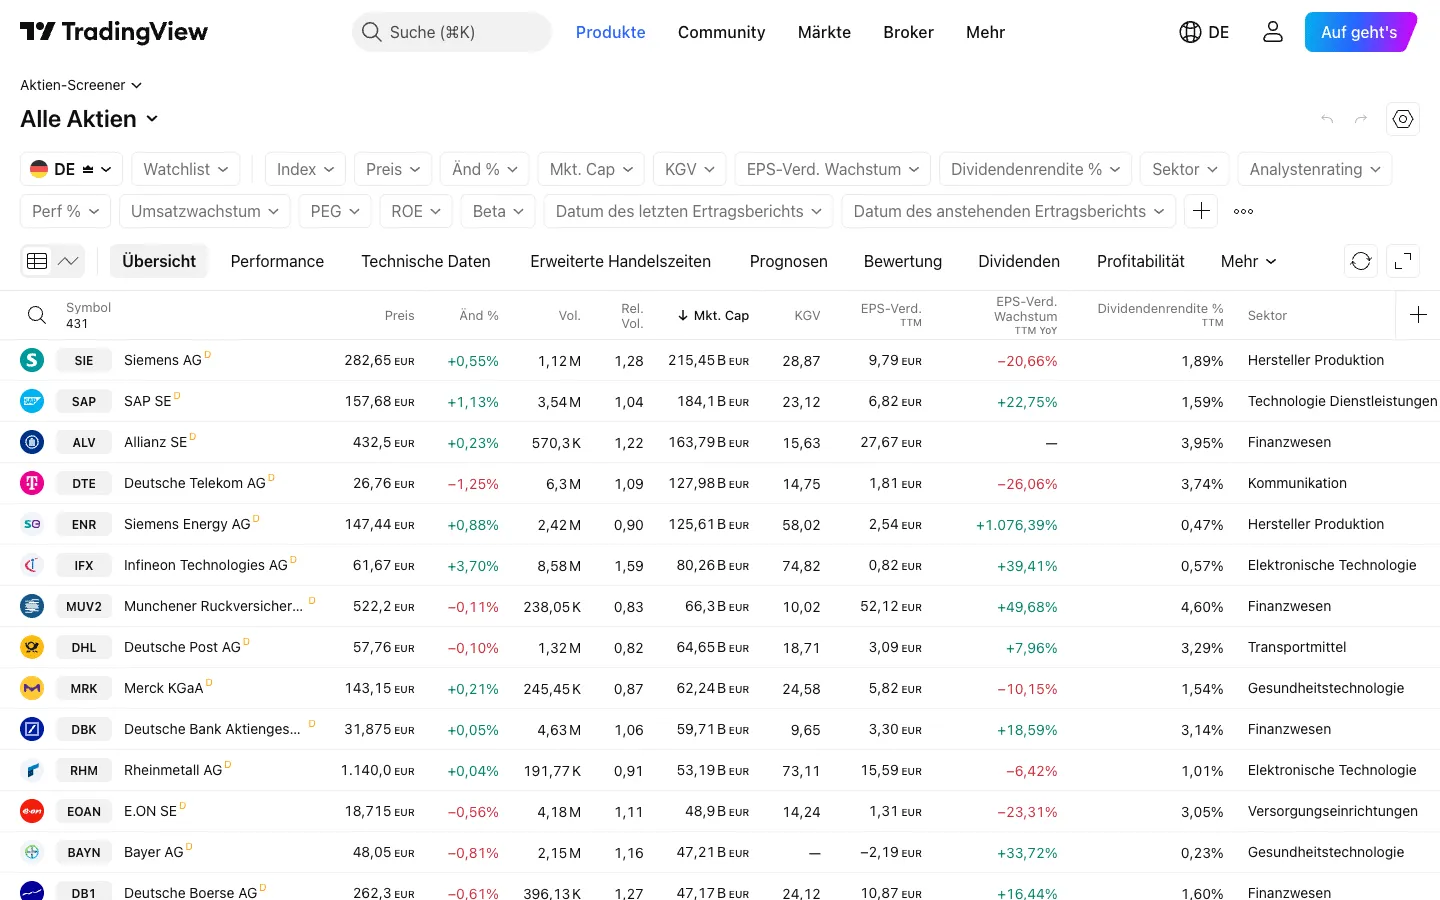 The TradingView stock screener filters by more than 500 fundamental and technical criteria. This screenshot shows German stocks; the same filters work for the US market.
A newer feature is the AI screener. TradingView’s plan table now lists AI screener requests: none on Basic, 100 on Essential, 150 on Plus, 250 on Premium and 500 on Ultimate (as of 24 September 2026). These are monthly limits, which reset on the first day of each month at 00:00 UTC. TradingView says the limits may change during the public beta.
Since September 2026, TradingView also sells an AI Copilot as a separate monthly add-on. It works inside the chart, draws levels, writes Pine Script and creates alerts, but only with a paid plan. I tested it with seven tasks in my TradingView AI Copilot review: fast and often right, but with errors you only find if you check.
Pine Script and backtesting
Pine Script is TradingView’s own programming language. Traders use it to build their own indicators and trading strategies and test them directly on the chart.
What the language can do, what changed with version 6 and how to write a first indicator is explained in our Pine Script guide.
You need no programming experience to start: many strategies can be adapted from templates. The built-in strategy report, called the Strategy Tester until July 2026, gives you win rate, profit factor and equity curve at the click of a button. How both backtesting tools work step by step, and what each plan unlocks, is covered in our TradingView backtesting guide.
Our own setup shows what this looks like in practice: on the left, the indicator runs on the chart and marks signals; on the right is its source code in the Pine Editor. Both are in the same window, and changes to the code show up on the chart immediately. This is exactly how we build the signal indicators mentioned in the indicators section above.
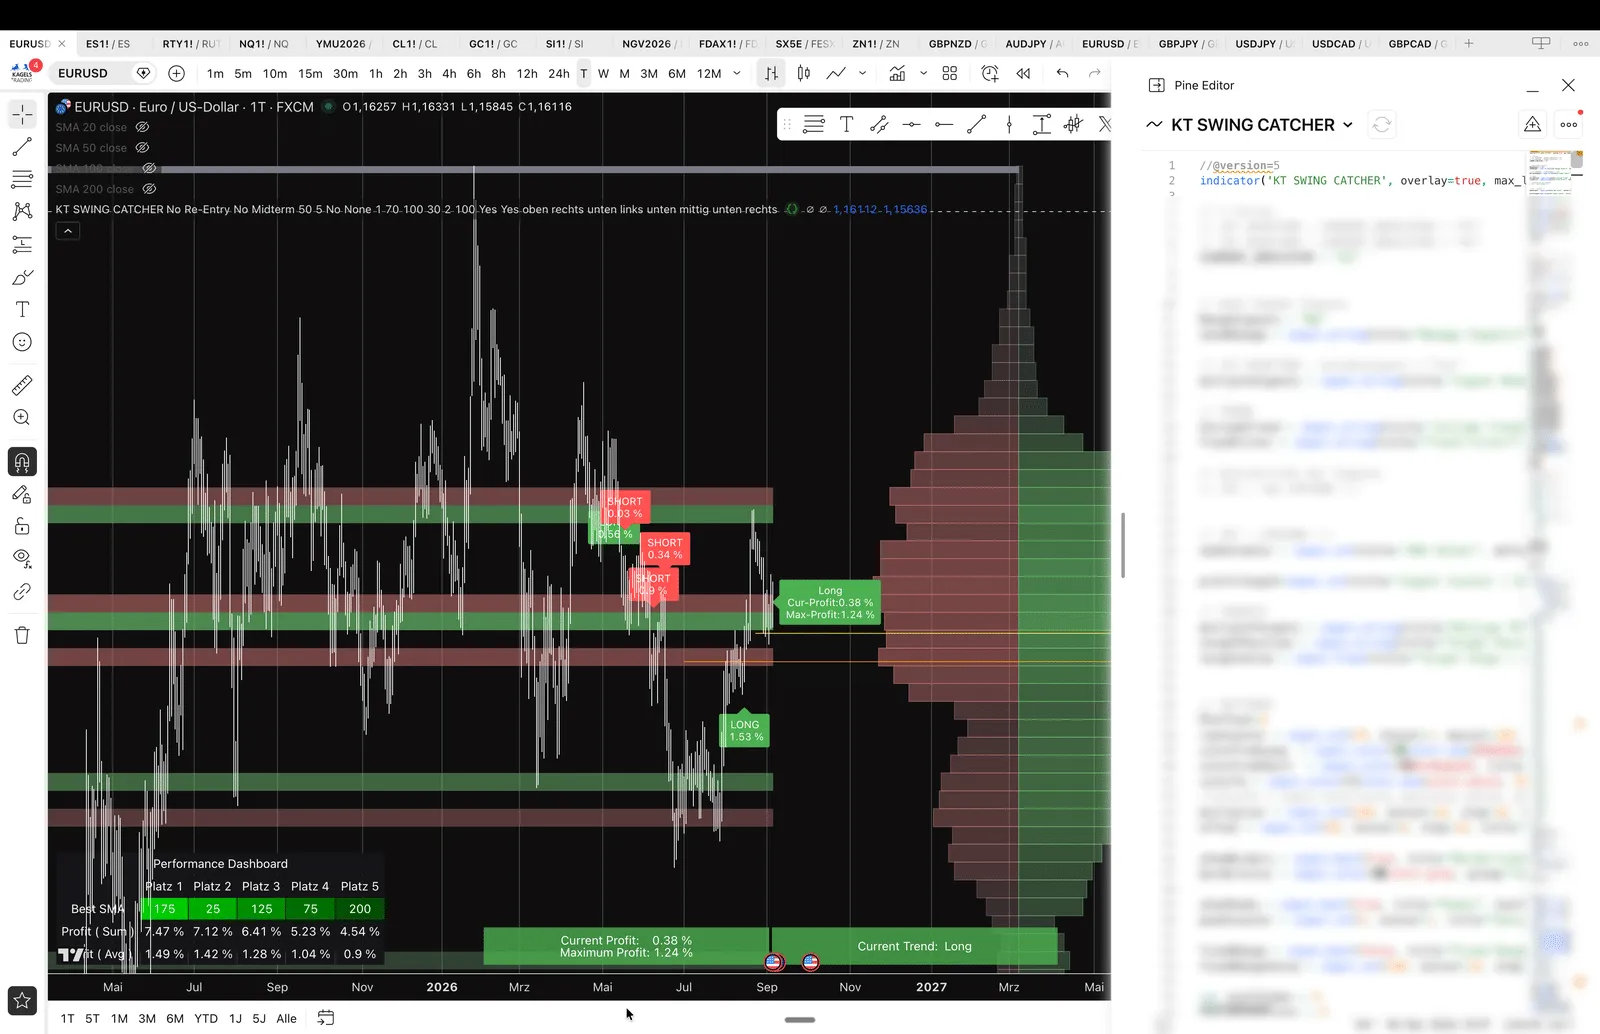 On the left, the chart with the running indicator, its signals and statistics; on the right, the Pine Editor with the source code.
The strategy report then evaluates a run in full. The example below shows a test on EUR/USD over 138 trades: profit factor 1.273, win rate 47.1 percent, plus maximum drawdown, equity curve and the split between long and short entries. These are exactly the figures you need to judge an idea at all.
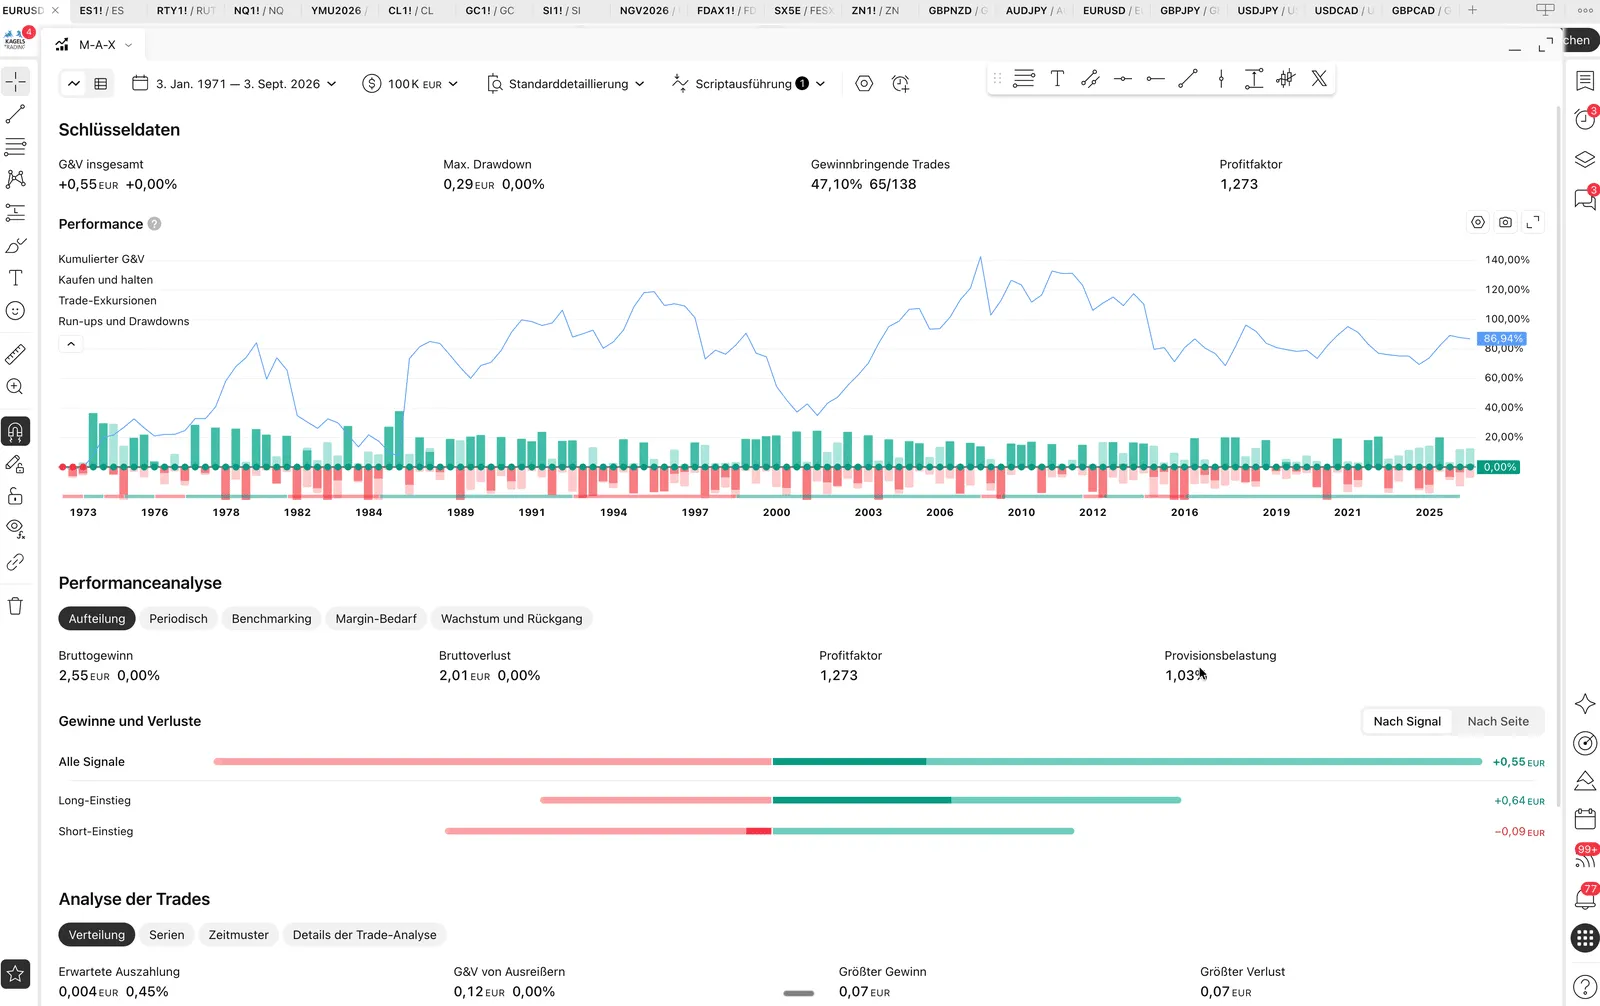 The older Strategy Tester interface, now the strategy report, on EUR/USD: profit factor 1.273 with a 47.1 percent win rate from 138 trades, plus the equity curve and the split between long and short entries.
Two things belong to an honest backtest. First, the absolute amounts in this run are deliberately small: the point is the figures and what they tell you, not a strategy recommendation. Second, the test period here goes back to 1971, although the euro has only existed since 1999. For FX_IDC:EURUSD, TradingView explains the pre-1999 history using predecessor European currency units. Other feeds may have different histories. If you test far back, you should know what you are calculating with; otherwise you mistake a calculation for market history. What else belongs to a clean test, from costs to look-ahead bias, is in our backtesting guide.
Setting up alerts: from condition to notification
An alert on TradingView is a notification that triggers as soon as a set condition occurs on the chart. Price alerts, indicator alerts and webhooks to external systems are possible.
The alert function is, for me, the most important part of the platform. It saves you from sitting next to the screen. In the dialog, you first set the condition: a price, an indicator value or a drawn line. Then you choose whether the alert triggers only once or repeatedly.
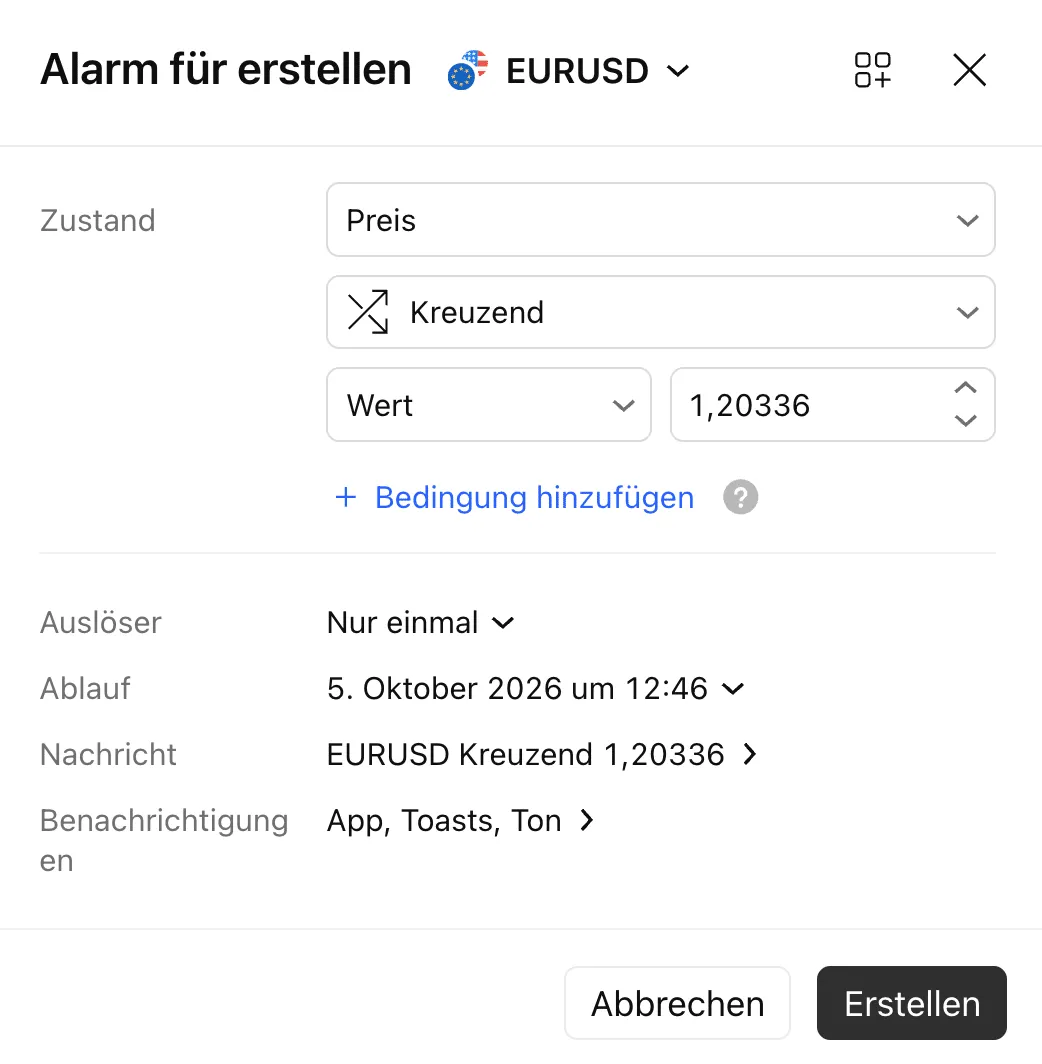 The alert dialog: condition, trigger and expiration date. Here, a price alert on EUR/USD at 1.20336.
Check the expiration setting when you create an alert. Basic alerts last up to one month, and Essential and Plus alerts up to two months. Premium and Ultimate support open-ended alerts, although watchlist alerts are an exception.
TradingView is generous with notification channels: push to the mobile app, a pop-up in the browser, email, a sound with adjustable length, and a webhook that sends a request to an external system. The webhook is the interface through which signals pass on to broker connections or your own scripts. There is also a schedule that mutes notifications outside your trading hours.
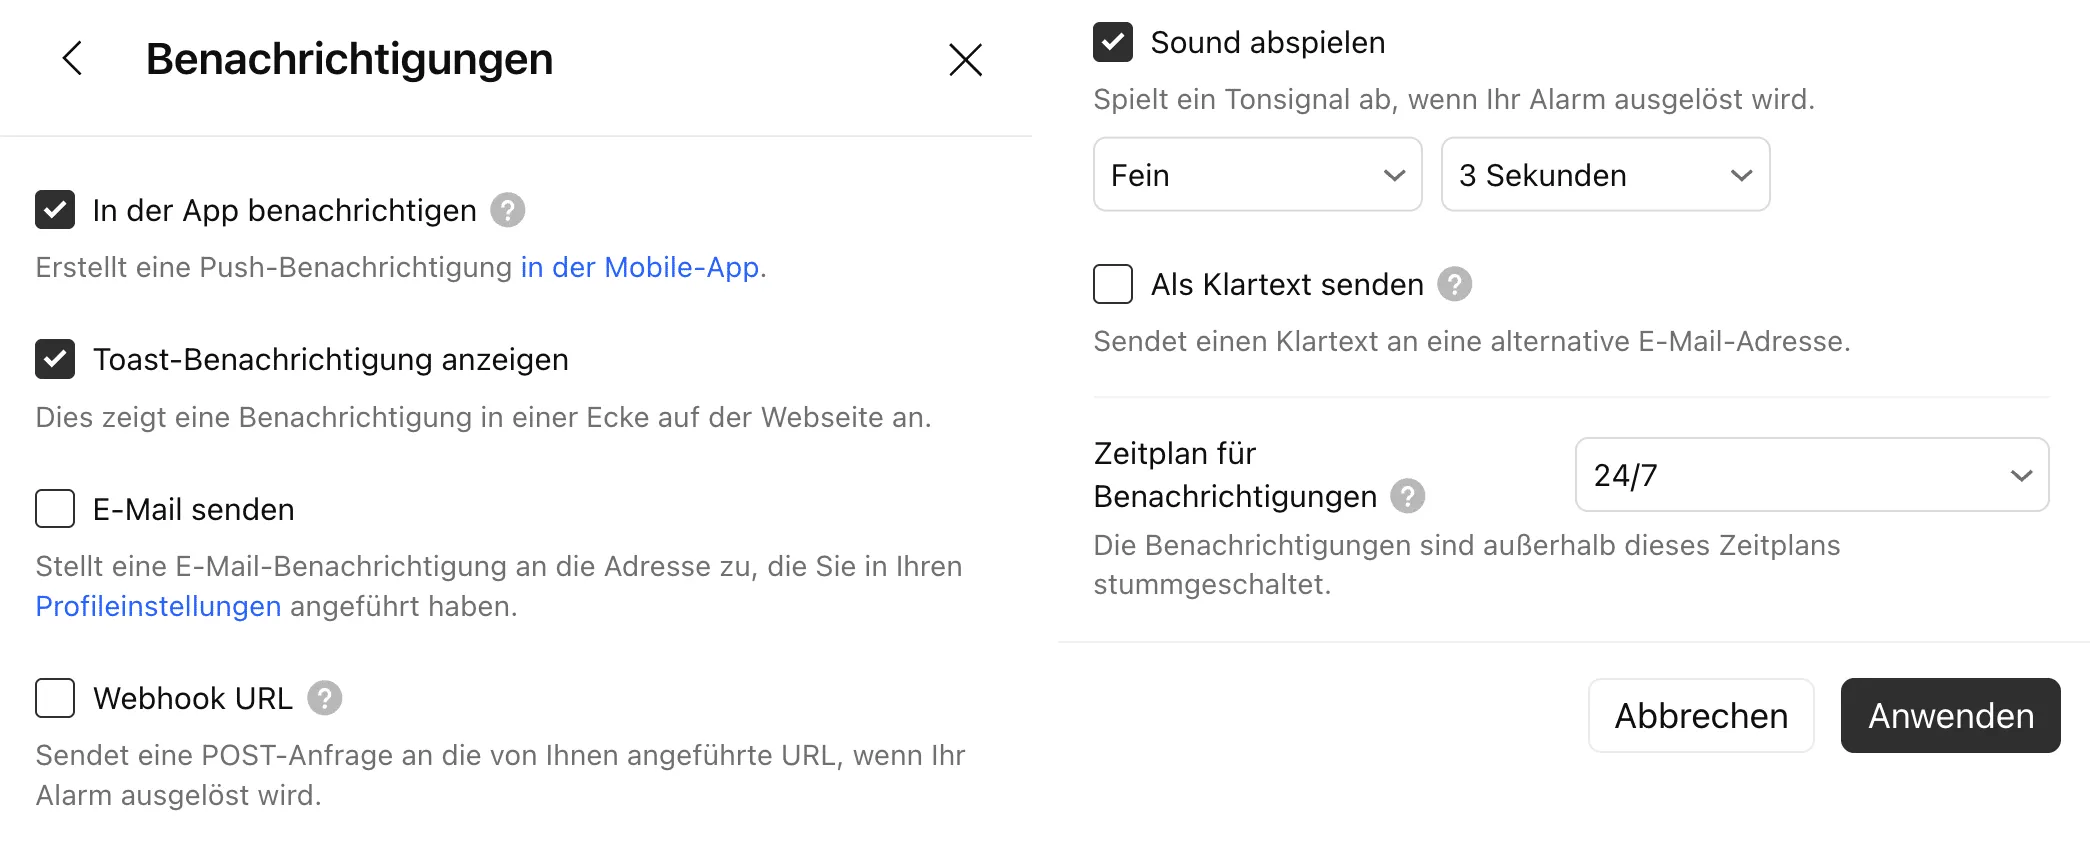 The notification channels of an alert: app push, pop-up, email, webhook to external systems, sound and a schedule.
On the chart, the finished alert appears as a dashed line with a label. So while analyzing, you see at once where your levels are, and you can move them with the mouse without opening the dialog again.
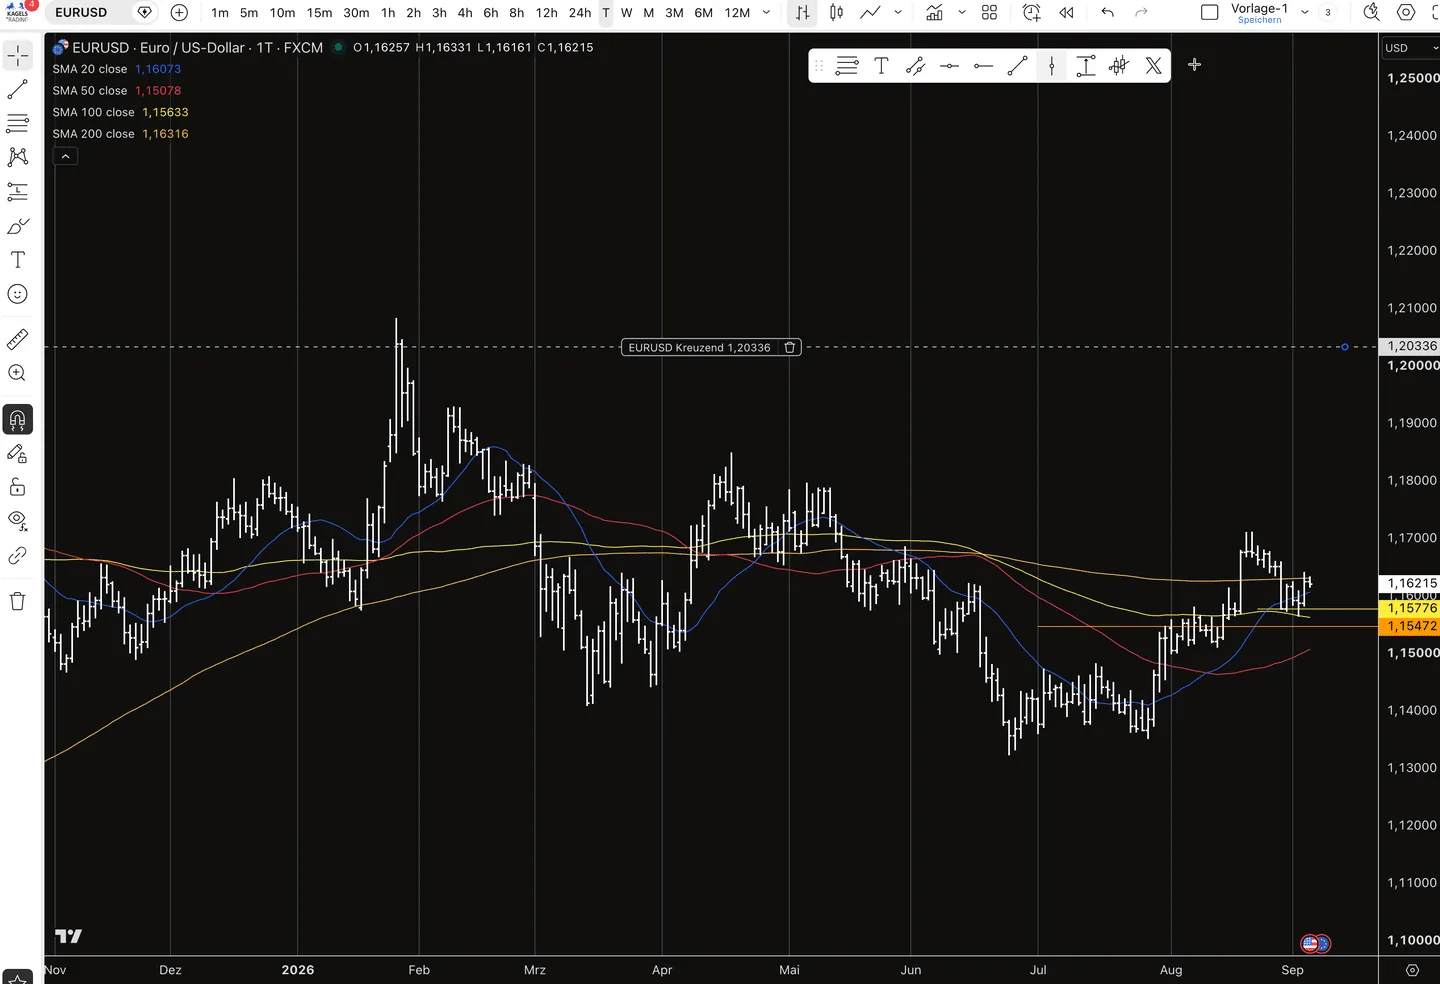 The alert sits on the chart as a dashed line with a label, here on the EUR/USD daily chart with four moving averages.
Your active price-alert limit depends on your plan: 3 on the free Basic plan, 20 on Essential, 100 on Plus, 400 on Premium and 1,000 on Ultimate. Technical alerts and watchlist alerts have separate limits. For a small watchlist, Essential is enough. If you watch several markets on several timeframes, 20 price alerts run out quickly.
Watchlists and economic calendar
The watchlist gathers the markets you actually follow, with up to 30 symbols on Basic and 1,000 on paid plans per list. There is also a built-in economic calendar that marks dates such as rate decisions and jobs data directly on the chart. So while analyzing, you see at once whether a release is due in the next few hours.
Paper trading: practice without real money
To open the free practice account, select Trade, then Paper Trading. You can practice market, limit and stop orders directly from the chart and reset the account at any time. Paper trading uses simulated fills, so treat the results as practice rather than proof of live profitability; our guide to paper trading on TradingView shows the setup step by step and where the simulation falls short.
How much does TradingView cost? All plans at a glance (2026)
TradingView costs between $0 on the Basic plan and $239.95 per month on the Ultimate plan. The most popular plans, Essential, Plus and Premium, cost $14.95 to $69.95 a month.
Since the big change, the plans are no longer called Pro and Pro+, but Essential, Plus, Premium and Ultimate. The table uses US-dollar website prices. Our German screenshots show euro prices, which had the same numerical amounts when checked. TradingView currently lists them as special prices (as of 24 September 2026). If you pay yearly, you save up to 17 percent compared with monthly billing.
| Plan | Monthly | Yearly (per month) |
|---|---|---|
| Basic | $0 | $0 |
| Essential | $14.95 | $12.95 |
| Plus | $34.95 | $29.95 |
| Premium | $69.95 | $59.95 |
| Ultimate | $239.95 | $199.95 |
Source: TradingView pricing page, as of 24 September 2026.
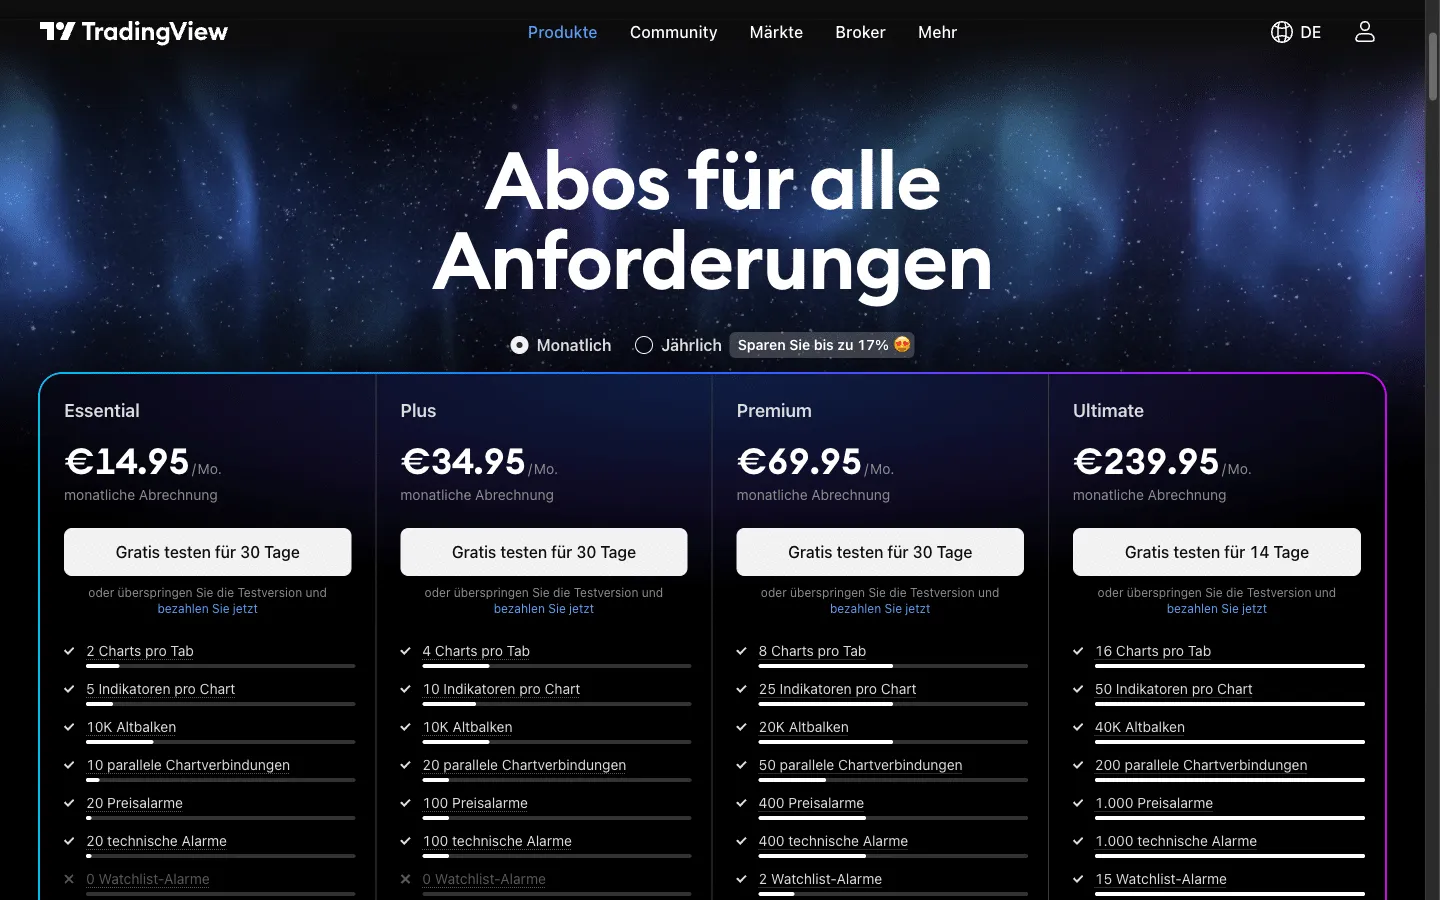 The monthly prices of the four paid plans on the TradingView pricing page. The screenshot was taken in Germany, so the same figures appear in euros (as of 31 July 2026).
With yearly billing, TradingView shows the price per month. This is the pricing page with the switch set to yearly:
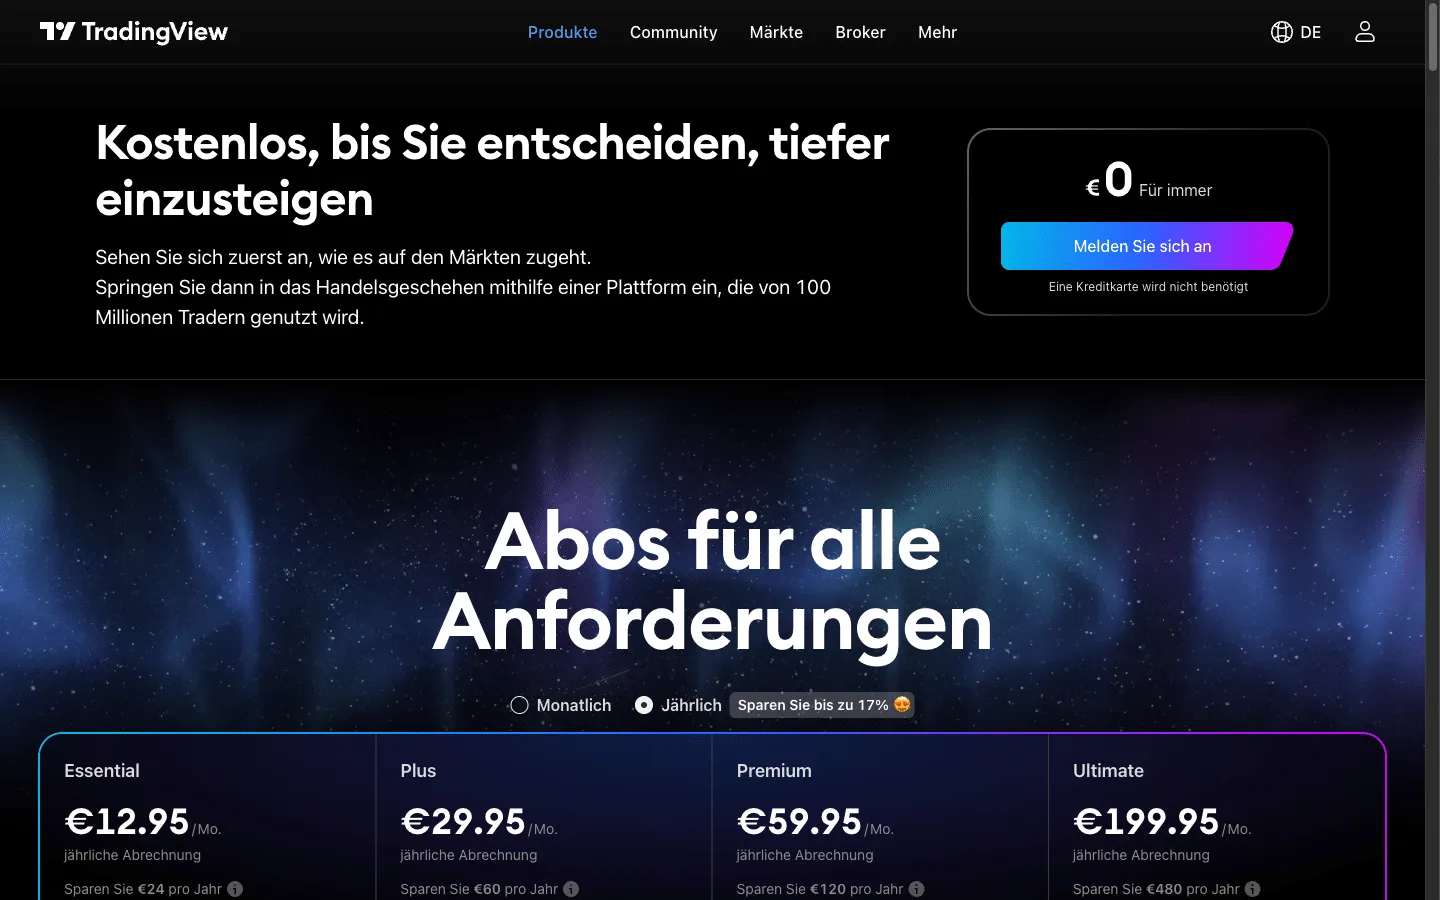 The pricing page with yearly billing: 12.95 to 199.95 per month, shown here in euros. Basic stays free (as of 4 September 2026).
The plans differ mainly in three things: charts per tab, indicators per chart and alerts.
- Basic ($0): 1 chart per tab, 2 indicators per chart, 3 price alerts. In return you see ads, and some chart types are missing.
- Essential: 2 charts per tab, 5 indicators, 20 price alerts. Plus no ads, volume profile and bar replay on intraday charts for manual backtesting (Basic supports replay on daily and higher timeframes).
- Plus: 4 charts per tab, 10 indicators, 100 price alerts. Worth it as soon as you watch several markets at once.
- Premium: 8 charts per tab, 25 indicators, 400 price alerts. It also adds second-based intervals and access to all available minute history in Bar Replay, subject to symbol-specific limits. Regular intraday charts load about 20,000 bars.
- Ultimate: 16 charts per tab, 50 indicators, 1,000 price alerts and tick-based intervals. According to TradingView, only this plan is available to professional users, which matters for the data costs further down.
You can pay by credit card, PayPal, Apple Pay or cryptocurrency. You can turn off renewal at any time; a paid plan remains active until the end of its paid term. Canceling a website trial ends the trial immediately.
TradingView’s current Terms, section 13, list a 14-day refund window for annual plans and a 7-day window for monthly plans. Annual market data subscriptions have a separate 14-day rule, with the current month deducted; monthly data subscriptions are non-refundable. The pricing FAQ still states a stricter policy, so check the applicable terms and contact support promptly. App-store purchases follow the store’s refund rules.
A point that causes trouble again and again: the trial turns into a paid plan automatically if you do not cancel in time. So set a reminder right after signing up, before your trial ends: 30 days for Essential, Plus and Premium, or 14 days for Ultimate.
You can find the current terms on the TradingView pricing page.
TradingView discounts and the Black Friday sale
TradingView runs its biggest sale of the year around Black Friday. In 2026, Black Friday falls on 27 November. As of September 26, TradingView has not announced the dates or prices for its 2026 sale.
In the last three sales, the prices stayed the same: $126 for Essential, $216 for Plus and $217 for Premium, each for 13 months; Ultimate cost $576 in 2025. The dates, the fine print and why Premium was the best deal are in my guide to the TradingView Black Friday sale. Once the 2026 sale is live, check TradingView’s official Black Friday page.
My practical advice if you are thinking about a paid plan:
- You already know you want a paid plan for a year: then the sale is the moment to buy. Until then, the free Basic plan costs you nothing.
- You do not know yet which plan you need: use a free trial before the sale to find out: 30 days for Essential, Plus or Premium, or 14 days for Ultimate. Cancel before it ends if you do not want to pay. Then you know exactly which plan to buy when the prices drop.
- You want to save without waiting: yearly billing is up to 17 percent cheaper at any time of year, and some brokers refund plan costs above a certain trading volume.
Using TradingView for free: what the free version can do
The most important news first: to get started, you do not have to pay anything. With the Basic account you get the full chart, all drawing tools, symbol search across all markets and access to the community. That is enough for clean analysis on daily and weekly charts.
You feel the limits of the free version in four places: only 1 chart per tab, only 2 indicators at a time, only 3 price alerts, and ads. If you only check a chart now and then, you can live with that. If you analyze every day or work with alerts, you hit the ceiling quickly.
There is a second way to cheaper access: partner brokers. Some brokers have built TradingView charts directly into their platform; others refund subscription costs above a certain trading volume.
Paper trading is simulated trading with a virtual balance. TradingView offers it for free, with no broker account needed.
The built-in paper trading account starts with 100,000 virtual dollars and can be reset at any time. For beginners, it is the safest way to practice order types and their own rules before real money is in the market.
TradingView real-time data: what costs extra
Real-time data means exchange prices without delay. On TradingView, you add them per exchange or as a bundle. For non-professional users, the US Stock Markets bundle costs $9.95 a month, and CME futures cost $9.95 a month.
This is the biggest stumbling block for beginners: forex and crypto prices on TradingView are real-time and free. For many stock and futures exchanges, however, you need a paid data package. CME futures, for example, arrive with a 10-minute delay on the free account. For swing traders on the daily chart, that hardly matters. For day traders, it rules the setup out. Our bitcoin forecast uses such a free real-time series, BTCUSD from Coinbase.
For US stocks, TradingView provides a free real-time Cboe feed. It can differ from primary-exchange feeds, particularly on short timeframes or less active stocks. If you need primary-exchange data, choose the relevant exchange package or the bundle.
These are the most important packages for US markets, per month:
| Data | Non-pro | Pro |
|---|---|---|
| US stocks bundle | $9.95 | not offered |
| NYSE only | $3.00 | $48.00 |
| Nasdaq only | $3.00 | $27.00 |
| CME futures | $9.95 | $548.00 |
| Cboe futures | $9.95 | $9.95 |
Per month. US stocks bundle: NYSE, Nasdaq, NYSE Arca, Nasdaq GIDS and OTC. CME futures: CME, CBOT, COMEX and NYMEX, E-mini included. Non-pro means non-professional user. Source: TradingView data coverage page, as of 24 September 2026; the German browser view showed the same numerical amounts in euros when checked.
The difference between the two columns is the most expensive trap for US traders. The same CME data costs $9.95 as a non-professional and $548 as a professional, more than fifty times as much. And according to TradingView, professional users can only use the Ultimate plan. So check which status applies to you in TradingView’s help pages before you buy data, not after the first bill.
A few more rules from the pricing page: you need an active paid plan or a trial before you can add real-time data. Essential allows two data subscriptions, Plus four and Premium six. Real-time data you buy works on the TradingView website and apps, but not in TradingView widgets on other websites. Refund rules differ for monthly and annual market data subscriptions, and the pricing FAQ conflicts with the current Terms, as explained in the pricing section above.
For readers in Europe: real-time data for Deutsche Börse Xetra now costs €19.95 a month for non-professionals (as of 24 September 2026). So always add the data costs to your monthly bill before you choose a plan.
Which plan suits which trader?
After nine years with the platform, I have a clear opinion on this. It is not based on feature lists, but on one question: what do you really use every day?
- Beginners and occasional analysts: stay on Basic. Test the platform, learn the tools, and only upgrade when the two-indicator limit actually holds you back.
- Active swing traders: Essential is the best entry into the paid plans. No ads, volume profile, enough alerts for a small watchlist.
- Traders following several markets: Plus pays off as soon as you need several charts side by side and work with many alerts.
- Day traders and heavy users: Premium brings second-based intervals, 8 charts per tab and 400 price alerts. Choose a suitable real-time feed for your markets. For US stocks, the $9.95 bundle is one option, alongside individual exchange packages and the free Cboe feed.
- Professionals and content creators: you only need Ultimate if, like me, you live in the platform all day or are classed as a professional user.
My practical tip for saving money: try the plan you might need for 30 days, or 14 days for Ultimate. You will quickly see which features you really use, then choose a lower-priced plan with annual billing if it covers your needs, ideally in the Black Friday sale.
Is TradingView worth it?
TradingView is worth paying for if you analyze charts every day, work with several charts at once or rely on alerts. If you only check prices now and then, the free Basic plan is enough.
For most individual traders, the value sits in Essential or Plus. Between the plans, the price rises quickly: from $14.95 for Essential to $69.95 for Premium. That jump only pays off if you really use the extras every day, such as second-based charts or eight charts side by side. I pay for Ultimate because TradingView is my main working tool, not because every trader needs it.
TradingView is not worth it if you are looking for something it does not do well. For automated trading with robots, a platform like MetaTrader 5 is the better choice. For professional order flow analysis, specialist tools go deeper. And if you only invest for the long term and look at a chart once a month, the free version gives you everything you need. In every case, add the data costs before you decide.
My experience with TradingView since 2017
I took out my first TradingView subscription in August 2017, back then the highest tier, which was still called Premium. Today I use the Ultimate plan, because the platform is my most important working tool: for my own trading in forex, indices, commodities and interest rate markets, for the daily chart analyses on our German site kagels-trading.de, for our trading signals and for the YouTube videos.
What still convinces me after all these years is the speed in daily use: search a symbol, change the timeframe, draw levels, set an alert. All of that together takes less than 30 seconds. All charts are in sync between desktop, browser and smartphone. When I get an alert on the go, I see exactly the lines on my phone that I drew on the big monitor the evening before.
But there are also things that bother me, and they belong in an honest review. Prices have risen noticeably over the years. Support used to respond faster; since the move to an AI chat, it takes longer to reach a human. And if you want to trade automatically or do professional order flow analysis, you will hit TradingView’s limits; there are better specialist tools for that.
A word on how broad this view is: it does not come from a single desk. Christian Möhrer writes the technical forecasts for our site in TradingView, and almost all of our signal providers work with it. So we see the platform from several angles at once: discretionary price action trading, technical analysis with indicators, and creating signals for others. What you read here is daily practice from several traders, not a weekend test.
Pros and cons of TradingView
Before you decide, look at both sides. These are, in my view, the most important arguments for and against the platform.
Pros of TradingView
- Best charting in its class: fast, precise, with over 110 drawing tools and 21 chart types, all cloud-based and saved on every device.
- Huge market coverage: according to the company, over 3.5 million instruments, from US stocks to crypto coins.
- Fair way in: a free Basic version with no time limit, a 30-day free trial for Essential, Plus and Premium, or 14 days for Ultimate, and no credit card for the free account.
- Strong community: millions of published analyses and more than 150,000 community scripts to learn from.
- Alerts with interfaces: from a simple price alert to a webhook to external systems, plus push, email and a schedule.
Cons of TradingView
- Higher costs: the paid plans have become clearly more expensive over the years.
- Real-time data costs extra: primary-exchange stock data and many futures feeds require a paid exchange package or bundle, often at much higher rates for professionals.
- Weaker support: since the move to an AI chat, it takes longer to reach human support.
- Automatic renewal: without cancellation, the trial automatically turns into a paid plan.
- No full auto-trading: classic trading robots like those in MetaTrader do not run here.
- No offline use: even the desktop app loads everything from the internet; without an internet connection there is no chart.
Other users’ opinions are part of the picture too: on Trustpilot, TradingView’s rating is currently unavailable because, according to the platform, fake reviews were removed. Of 1,344 reviews there, 62 percent give one star, and the main complaints are billing, automatic renewal and support (as of 24 September 2026). On Google Play, on the other hand, the English listing showed 4.6 out of 5 from about 948,000 reviews when checked on September 25, 2026. Ratings can vary by region. My view: the core platform is mature and reliable; the frustration is almost always about billing and support.
Connecting TradingView to a broker
To trade, you connect your broker account to the platform. If your broker offers an interface, the chart remains your workspace and you can trade directly from it. You then place orders with a click on the chart or through the order panel with market depth.
Which brokers you can connect depends on your country, so check TradingView’s broker list for yours. Availability also depends on your account, location and the products you want to trade. It includes names that US traders know well: Interactive Brokers and TradeStation, the futures brokers Tradovate, NinjaTrader and AMP Futures, the forex brokers OANDA and FOREX.com, and the crypto exchanges Coinbase Advanced and Kraken. What each US broker lets you trade from the chart, and what it costs, is in our guide to TradingView brokers.
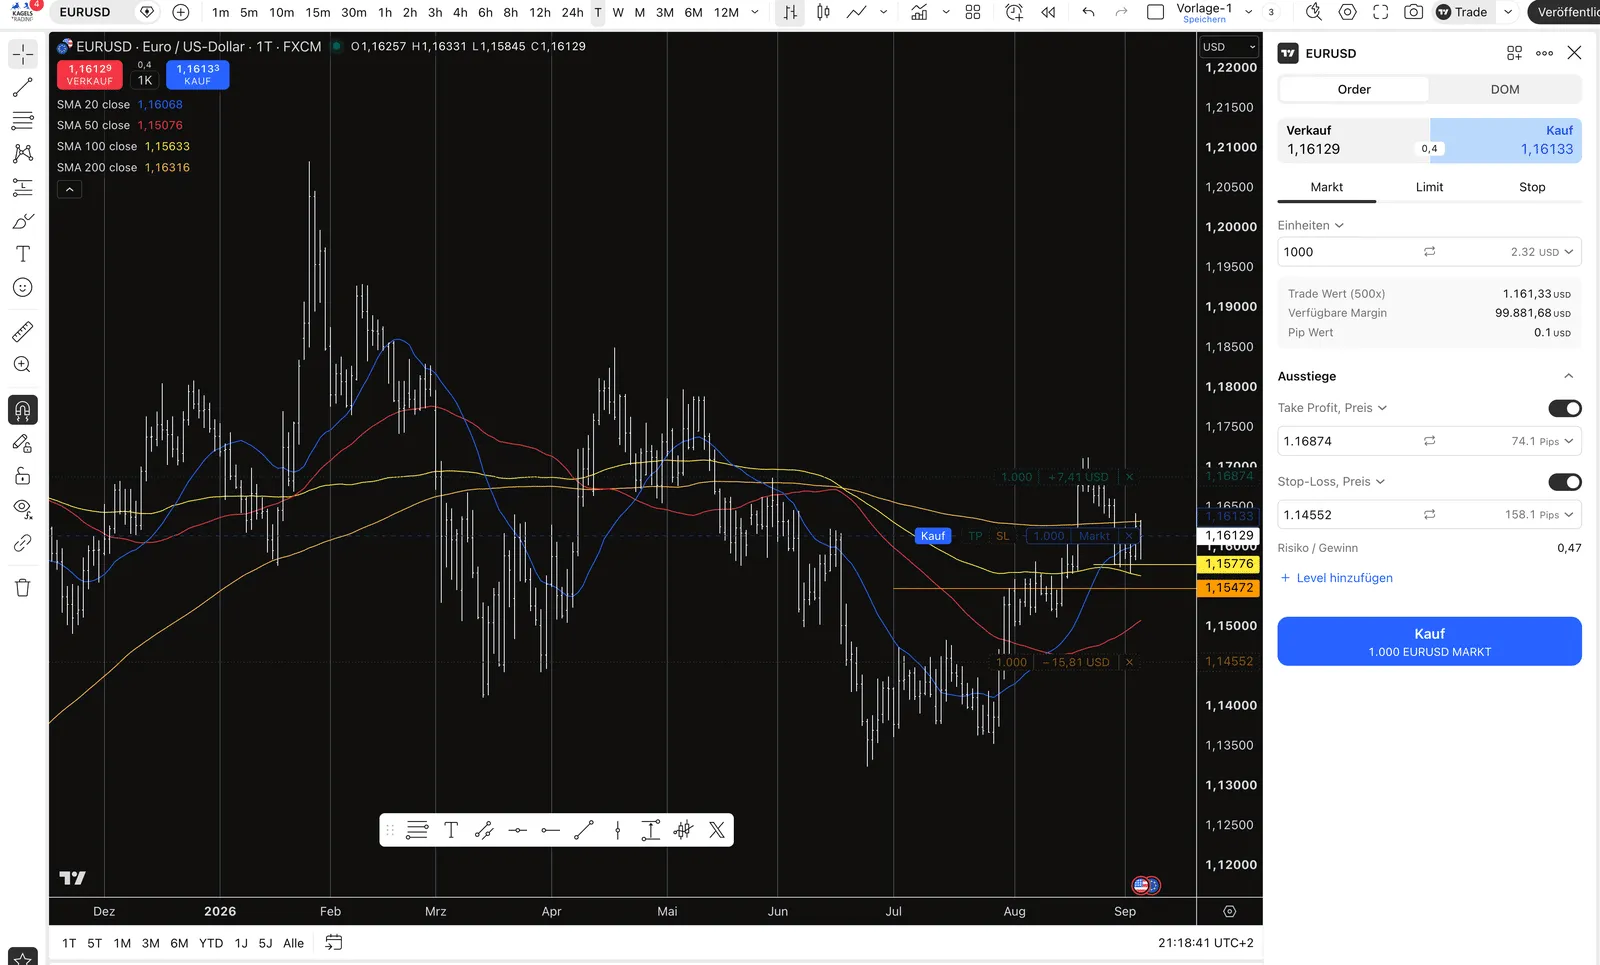 The order panel next to the chart: order type, quantity, take profit and stop-loss with pip distance, plus margin, pip value and the calculated risk-reward ratio. The screenshot was taken in the practice account.
This is the order panel. You choose between market, limit and stop, set the quantity and add take profit and stop-loss at the same time. TradingView automatically calculates the distance in pips, the pip value and the margin required. Both levels also appear as movable lines on the chart.
One number in it is worth a second look: the risk-reward ratio, 0.47 in this example. It tells you that the stop is further away than the target, here 158 against 74 pips. That is exactly what this display is good for: it is there before you click, not only in the review afterwards. The screenshot comes from the practice account, which you can tell from the margin of around 100,000 dollars.
The number of connected brokers has grown for years, but some well-known brokers are still missing. So before you switch, first check whether your broker is on the list. Some brokers only embed the charts, while others allow full trading from TradingView.
Alternatives to TradingView
No platform is the best for every purpose. These alternatives fill the gaps that TradingView leaves. Prices, free versions and when switching pays off are in our comparison of TradingView alternatives:
- thinkorswim: the trading platform of the US broker Charles Schwab, for Schwab clients. Many US traders compare it with TradingView; it makes most sense if your account is already at Schwab.
- TradeStation: for traders who want to combine US markets with their own system development. Less market breadth than TradingView, but broker and development environment from one source.
- MetaTrader 5: the standard for automated trading with Expert Advisors. The charts are weaker, but trading robots run natively.
- cTrader: a modern alternative for forex and CFD traders with strong order execution.
- ATAS: the specialist tool for order flow and volume analysis, which TradingView only covers on the surface.
Conclusion: TradingView stays my standard, despite higher prices
After nine years as a paying customer, my verdict is clear: for daily chart analysis, there is nothing better right now. The combination of speed, market coverage, alerts and sync across devices is why I start every trading day with TradingView.
The criticism still stands: the plans have become more expensive, real-time data costs extra, and support has got worse. So my advice: start for free with Basic, test the plan that fits your trading for 30 days, or 14 days for Ultimate, and only pay once you really feel the limits of the free version. If you decide to pay for a year, the Black Friday sale is the best time to do it. And cancel the trial in time if you decide against it.
Frequently asked questions about TradingView
How much does TradingView cost per month?
TradingView costs between $0 and $239.95 per month. The Basic version is permanently free. Essential costs $14.95, Plus $34.95, Premium $69.95 and Ultimate $239.95 per month. On yearly billing, prices drop to $12.95 to $199.95 per month. Real-time exchange data costs extra (as of 24 September 2026).
Is TradingView worth it?
For daily chart work, yes. If you analyze markets every day, use several charts or rely on alerts, a paid plan saves you real time. For most individual traders, Essential or Plus is enough. If you only check prices now and then, the free Basic plan does the job.
Can I use TradingView for free?
Yes, the Basic version is free with no time limit and includes the full chart with all drawing tools, 2 indicators per chart and 3 price alerts. You can also try Essential, Plus or Premium free for 30 days, or Ultimate for 14 days. Without cancellation, the trial turns into a paid plan automatically.
Is TradingView good for beginners?
Yes. The free plan and the paper trading account let you learn charting and practice orders without risking money. The interface looks busy at first, so start with one chart and a short watchlist. Paper trading uses simulated fills, so its results are practice rather than proof of live profitability.
Is TradingView good for day trading?
Yes, with a suitable real-time feed for your markets. For US stocks, check whether the free Cboe feed meets your needs; primary-exchange data is available separately or through the $9.95 monthly bundle for non-professionals. CME futures data costs $9.95 a month for non-professionals. Premium adds second-based charts, and Ultimate adds tick charts. To place live orders from the chart, you also need a supported broker account.
Can TradingView be trusted?
TradingView is an established platform with over 100 million users, according to the company, and has been around since 2011. It is not a broker and does not hold client money. On Trustpilot, the rating is currently unavailable after fake reviews were removed; many visible complaints concern billing, renewal and support. Reviews alone do not establish whether a platform is secure.
When is the TradingView Black Friday sale?
TradingView holds its biggest sale of the year around Black Friday, which falls on 27 November in 2026. As of September 26, TradingView has not announced the dates for its 2026 sale. In 2025 it started on November 21, a week before Black Friday; the past dates and prices are in the Black Friday guide linked above.
What is better than TradingView?
It depends on what you need: for automated trading with robots, MetaTrader 5 is better suited; for order flow and volume analysis, ATAS; for Schwab clients, thinkorswim is a natural option. For pure charting and market coverage, I currently see no platform ahead of TradingView.
How do I cancel my TradingView subscription?
For a website subscription, open Settings and billing → Subscriptions and turn off auto-renewal. Manage App Store or Google Play purchases in the corresponding store. A paid plan remains active until its paid term ends; canceling a website trial ends the trial immediately. The current Terms list refund windows of 14 days for annual plans and 7 days for monthly plans. Market data has separate rules, and the pricing FAQ states a stricter policy. See the pricing section above and contact support promptly.
Where can I download the TradingView app?
You download the desktop app directly from TradingView: for Windows as an msix file that runs on Windows 10 and 11 without a Microsoft Store account, for macOS as a dmg, and for Linux as a deb package for Ubuntu. You find the mobile app in the App Store and on Google Play. All versions are free and included in every plan, including the free account.
This US edition is based on our German edition on kagels-trading.de and has been adapted for US readers.
More TradingView guides
- Save on a plan
TradingView Black Friday 2026: Dates, Deals and Best Plan
Expected 2026 timing, verified past deals and what to check before buying a plan.
- Practice without risk
TradingView Paper Trading: Setup, Limits and Tips (2026)
Set up the free paper trading account, place your first orders and learn where the simulation falls short.
- Compare platforms
TradingView Alternatives 2026: 7 Platforms Tested
Seven platforms compared, with a decision aid for when switching makes sense.
- Connect a broker
Best Brokers for TradingView 2026: A Guide for US Traders
Which US brokers work with TradingView and what to check before you connect one.
- Test a strategy
TradingView Backtesting: Test a Strategy Without Real Money
Manual testing with Bar Replay and automatic testing with the strategy report.
- Write an indicator
Pine Script in TradingView: Basics, Editor and Version 6
Pine Script basics, the editor and version 6, with code you can copy.
- Use the AI Copilot
TradingView AI Copilot Review: 7 Tests, Price and Limits
Seven real tasks for the paid AI add-on: what it costs, what it got right and where you must check it.
- Filter stocks with the screener
TradingView Stock Screener: How to Use It and What It Costs
How the stock screener works, what the free plan can do, the Pine Screener and three tested popular screens.
- Use VWAP
VWAP Indicator: Formula, Anchored VWAP and TradingView Setup
The VWAP formula, trend day versus range day, Anchored VWAP and the right settings in TradingView.