
Elliott Wave Theory: Rules, Patterns and Fibonacci


Contents
- Elliott wave theory in 30 seconds
- What is Elliott wave theory?
- The basic pattern: five waves and an A-B-C correction
- The three rules and the main guidelines
- Motive waves: impulse, leading diagonal and ending diagonal
- Corrective waves: zigzag, flat and triangle
- Elliott waves and Fibonacci: narrowing down targets
- Counting waves in practice: how to proceed
- What hit rate is realistic?
- Why I no longer trade Elliott waves
- Conclusion: worth learning, even if you do not trade it strictly
- Frequently asked questions about Elliott wave theory
- About the author
I published the first German translation of the standard work on Elliott waves in 1989, and yet I no longer trade by it today. The book by Frost and Prechter came out with the German publisher Markt & Technik, under a title that translates as “The Elliott Wave Principle: Key to Profits in the Stock Market”. I later gave the rights to FinanzBuch Verlag free of charge. For some traders the waves are the key to understanding markets, for others they are reading tea leaves.
In this guide I explain the basic pattern of five waves and the rules that make it testable. You get the three hard rules, the main corrective patterns and the Fibonacci ratios for price targets. The method is not a forecasting machine: two experienced analysts can count the same chart differently. That is why alternative counts and sound risk management belong to it, and at the end I tell you why I switched to a more direct approach. This article follows our editorial policy.
Elliott wave theory in 30 seconds
- Core idea: according to Ralph Nelson Elliott, markets move in repeating patterns. Five waves in the direction of the trend (1 to 5) are followed by three corrective waves (A-B-C). Together they make a cycle of eight waves.
- Three rules of an impulse: wave 2 never retraces all of wave 1. Wave 3 is never the shortest motive wave. Wave 4 does not enter the price range of wave 1; only diagonals are an exception.
- Fractal structure: every wave is made of smaller waves with the same structure, from the minute chart to cycles lasting decades. Fibonacci ratios such as 61.8% help to narrow down price targets.
- Honest assessment: wave counting stays subjective. Without a stop-loss and an alternative count the method does not work. It is most useful for spotting wave 3, the strongest phase of a trend.
What is Elliott wave theory?
Elliott wave theory is a method of technical analysis that divides price moves into repeating patterns of five motive waves and three corrective waves, based on the idea that crowd psychology creates these patterns again and again.
The theory was developed in the 1930s by the American accountant Ralph Nelson Elliott. He studied decades of US stock market data and published his findings in 1938 as “The Wave Principle”. His key thought: the market does not record the news, it records how people react to the news. Optimism and pessimism take turns, and that rhythm leaves repeating shapes on the chart.
Elliott was not the first to see cycles in the market. Charles Dow had already described the cyclical nature of stock prices. The Wyckoff method also works with a repeating cycle of accumulation and distribution. Elliott went one step further: he broke the cycles down into concrete, rule-based price patterns and made them testable.
After Elliott’s death in 1948, his theory faded from view until A. J. Frost and Robert Prechter revived it. Their book “Elliott Wave Principle” came out in 1978 and is still regarded as the standard work. It is the book I translated into German eleven years later. You will find it in my list of the best trading books, and the publisher’s page still sells the English edition.
The basic pattern: five waves and an A-B-C correction
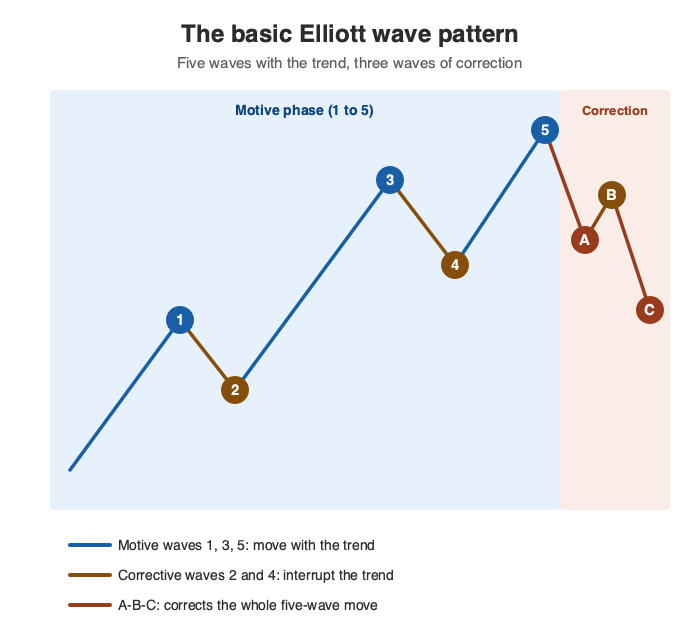
The heart of the theory is the five-wave pattern. Three waves move with the trend and two interrupt it. Then comes a correction of three waves, labelled A, B and C. The pattern works in both directions: there are rising and falling five-wave moves. The drawing below shows the basic form.
 Click to enlarge
Source: Kagels Trading, own drawing.
An impulse wave is a five-part price move in the direction of the larger trend in which wave 3 is never the shortest.
Behind each wave there is typical investor behaviour. In wave 1 only a few early buyers step in. Wave 2 comes from profit taking and often retraces deeply. In wave 3 the crowd recognises the trend; this is usually the longest and most dynamic part of the pattern. Wave 4 is a pause. In wave 5 the latecomers buy while the momentum is already fading.
A corrective wave is a countermove, usually in three parts (A-B-C), that corrects part of the previous trend.
The B wave is the trap of every correction. Wave A starts the countermove, wave B interrupts it and wave C completes it. Wave B makes many investors believe the old trend is already back. That is where costly false entries happen, because the falling C wave is still to come.
The fractal structure: waves within waves
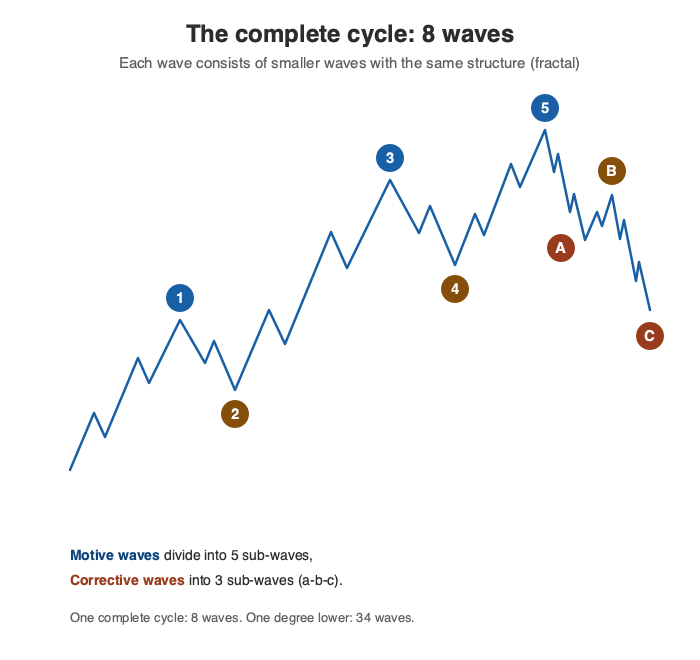
Elliott waves are fractal: every wave is made of smaller waves with the same structure and is at the same time part of a larger wave.
Elliott named nine degrees of waves, from the Grand Supercycle over decades down to the Subminuette on minute charts. This turns the basic pattern into a full cycle: eight waves at the main degree and 34 waves one degree lower. As you can see in the drawing, the structure repeats itself at every degree.
 Click to enlarge
Source: Kagels Trading, own drawing.
In practice, the fractal structure is your most important control tool. A count on the hourly chart has to fit the structure on the daily chart, otherwise something is wrong. A clean five-wave move on a small degree is often only the first sub-wave of a larger move. If you look at one time frame only, you miss that link.
The three rules and the main guidelines
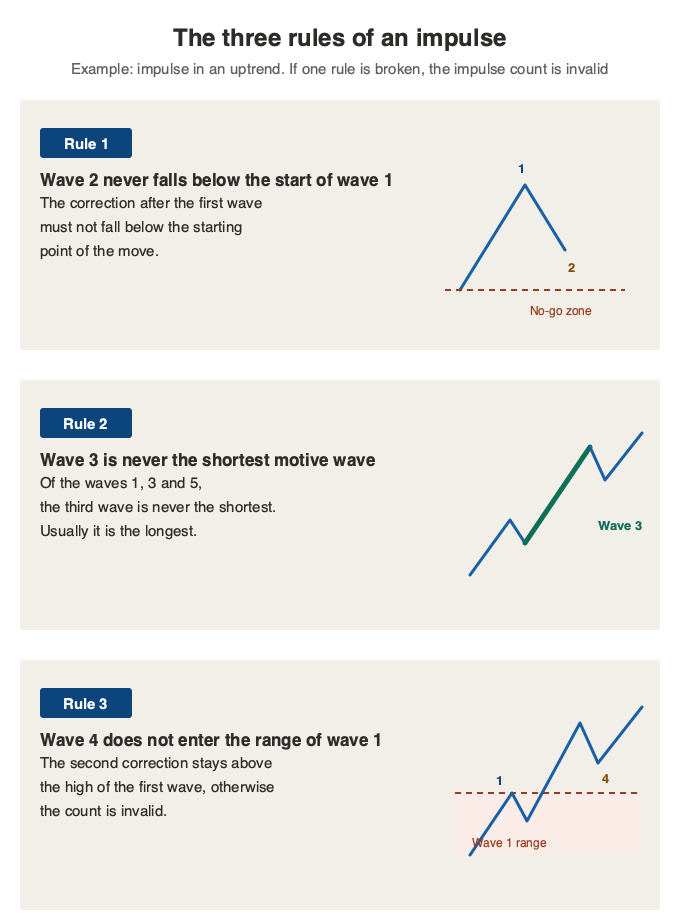
Elliott did not just describe his patterns, he made them testable with rules. That sets wave theory apart from many other approaches to chart analysis. For an impulse there are three hard rules, and they are not negotiable:
- Rule 1: wave 2 never retraces all of wave 1. In a rising impulse this means it never falls below the start of wave 1. If the correction goes further, the supposed wave 1 was not one.
- Rule 2: wave 3 is never the shortest of the three motive waves. In most markets it is even the longest and most dynamic.
- Rule 3: wave 4 does not enter the price range of wave 1. If the two overlap, the impulse count is invalid. Diagonals are the exception, see below.
 Click to enlarge
Source: Kagels Trading, own drawing.
A broken rule is not a defeat but useful information. The count was wrong and the market has a different structure. You change the count and check the alternatives. Anyone who tolerates a broken rule and clings to a favourite count is trading against the market, and that costs money.
Besides the three rules there are guidelines, which apply often but not always:
- Alternation: waves 2 and 4 rarely form the same corrective pattern. If wave 2 was a sharp zigzag, that points to a flat sideways correction in wave 4.
- Equality: wave 5 often has about the same length as wave 1, especially when wave 3 has extended strongly.
- Extension: one of the three motive waves is visibly extended. Usually it is wave 3; in commodity markets it is often wave 5.
- Depth of wave 4: wave 4 often ends in the area of the fourth wave of one lesser degree. A common reference mark is a retracement of about 38.2% of wave 3.
Motive waves: impulse, leading diagonal and ending diagonal
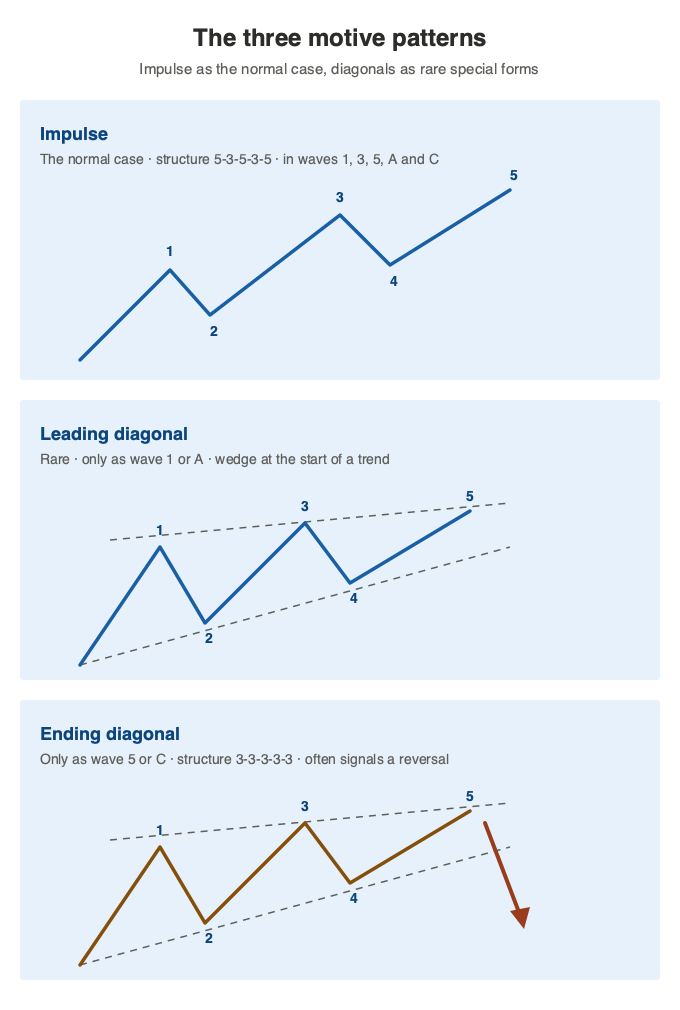
Motive waves drive the trend, and today’s version of the theory distinguishes three motive patterns. They appear as waves 1, 3 and 5 and as the corrective sub-waves A and C. The differences between the three matter in practice, and the drawing below compares them. The leading diagonal was only added after Elliott.
 Click to enlarge
Source: Kagels Trading, own drawing.
The impulse is the normal case and, from a trader’s point of view, the dream among price patterns. Its sub-waves follow the structure 5-3-5-3-5, the swings are narrow and the move is dynamic. A clean impulse fits well into a trend channel. Wave 3 of an impulse is the part where the market runs most clearly, which is why I focused on exactly this phase when I traded Elliott waves.
A special case is the truncated fifth wave. Wave 5 then fails to get beyond the end of wave 3. This happens mainly after wave 3 has extended strongly. A truncation is a warning sign: the trend is exhausted, and the following correction is often sharp.
The leading diagonal is a rare wedge at the start of a trend, only in wave 1 or in wave A of a zigzag. Waves 1 and 4 overlap, and the boundary lines converge (contracting) or diverge (expanding). Important for your count: a leading diagonal points to a continuation, because after a wave 1 come waves 2 to 5. Expect a deep wave 2 first, though.
The ending diagonal only appears as wave 5 or wave C, at the end of a move. All five sub-waves are threes, so the structure is 3-3-3-3-3. The pattern shows trend fatigue: buyers only manage overlapping pushes. An ending diagonal is often followed by a sharp reversal, and anyone who still buys with the trend here takes over the positions of others.
Do not trade either diagonal actively, especially as a beginner. They are rare, hard to recognise and often confused with other patterns. Their value lies in the warning of the ending diagonal: it tells you to lock in profits and not to open new positions in the direction of the trend.
Corrective waves: zigzag, flat and triangle
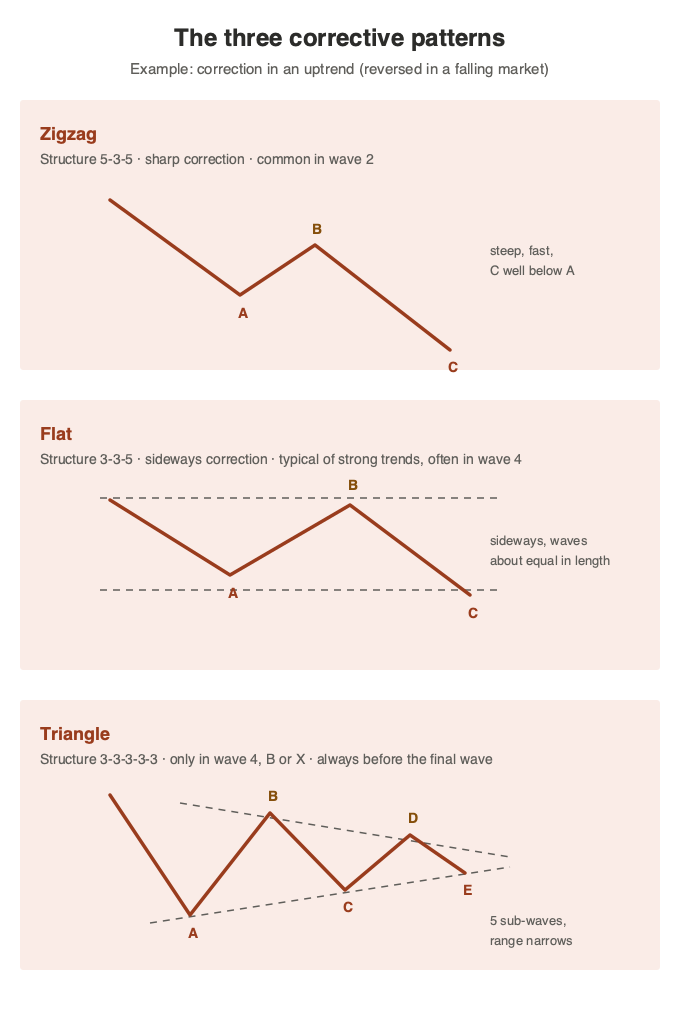
Corrective waves are the harder part of Elliott wave analysis. Motive waves follow clear rules, corrections have a lot of freedom. They appear as waves 2 and 4 of the basic pattern and as wave B within corrections. Elliott distinguished three basic patterns, and all complex corrections are built from them. The drawing below shows them as corrections in an uptrend.
 Click to enlarge
Source: Kagels Trading, own drawing.
A zigzag is a sharp three-part correction with the internal structure 5-3-5, in which wave B never reaches the start of wave A.
The zigzag is the most dynamic form of correction. Waves A and C are both motive waves, so the move clearly goes against the trend. Zigzags appear mostly in wave 2, right after the first impulse. Their steep shape shakes many early buyers out of the market.
A flat is a sideways correction with the structure 3-3-5 and is typical of strong trends.
In a flat the three sub-waves are about equal in length and the correction runs sideways. This is a sign of trend strength: the market does not have enough counter pressure for a deep correction, and small dips are bought straight away. Flats appear mostly in wave 4. Two variants are worth knowing. In an expanded flat (shown here as a correction in an uptrend), wave B rises beyond the start of wave A, and wave C then falls below the end of wave A. In the rare running flat, wave B also rises beyond the start of wave A, but wave C stays above the end of wave A, a sign of exceptional strength.
A triangle is a five-part correction (A-B-C-D-E) with the structure 3-3-3-3-3 that appears only in wave 4, in wave B, in the final X wave of a double or triple zigzag, or as the last pattern of a combination.
The triangle has a property that helps a lot when counting: it always comes right before the final wave of the larger pattern. It does not occur in a wave 2. If you see a clean triangle, expect one more wave in the direction of the trend after the breakout, which can complete the move on this degree. In strong markets that last wave can still extend. The shrinking range inside the triangle shows the balance between buyers and sellers, which ends with the breakout.
Corrections can also be chained together. Two or three basic patterns join through connecting waves (X) to form a double three or triple three. You often recognise such complex corrections completely only afterwards. For practice, a rule of thumb is enough: the longer a correction lasts, the flatter it usually runs, and a complex correction often ends with a triangle.
Elliott waves and Fibonacci: narrowing down targets
In Elliott wave analysis, Fibonacci ratios such as 38.2% and 61.8%, together with the widely used 50% retracement, are used to narrow down price targets and the depth of corrections.
Without Fibonacci, wave counting is just recognising shapes. The price ratios between the waves turn the pattern into a tool with concrete levels. Waves are surprisingly often related to each other by ratios based on the Fibonacci sequence. How to draw the levels is shown in the guide to Fibonacci retracement. Wave targets measured from the end of a correction, for example wave 3 from the low of wave 2, are drawn with a Fibonacci extension.
These are traditional reference values for a rising market, not measured hit rates; in a falling market, reverse them:
| Wave | Typical ratio |
|---|---|
| Wave 2 | retraces about 50 to 61.8% of wave 1 |
| Wave 3 | often reaches 161.8% of wave 1 |
| Wave 4 | retraces about 38.2% of wave 3 |
| Wave C | often reaches 100 to 161.8% of wave A |
These are guidelines, not guarantees. The levels mark zones where the end of a wave becomes more likely and where you look for confirmation. They replace neither the count nor the stop-loss. Their real value lies elsewhere: with the ratios you can plan entries, stops and targets before you place an order. That is the difference between a plan and a hope.
Counting waves in practice: how to proceed
The biggest weakness of the method is how subjective the count is. From my own years with the Elliott waves I can tell you that a fixed routine takes much of the sting out of this problem. Four points have proven themselves:
- Top down: start on the monthly and weekly chart and work your way down to the daily and hourly chart. The big structure sets the frame, the small one gives you the entry. From the daily chart up, use a logarithmic scale, otherwise long trends distort the proportions of the waves.
- Always keep an alternative count: next to your preferred count, keep at least one alternative. If both point in the same direction, that is a strong setup. If they contradict each other, the sidelines are the better position.
- Set an invalidation level: every count gets a price at which it becomes invalid. That level follows directly from the three rules, for example the start of wave 1. That is where your stop goes, before you enter. How to size the position around that stop is covered in the guide to risk management.
- Focus on wave 3: look for markets where a wave 1 and a wave 2 are visible. An entry near the end of wave 2 offers the best ratio between a tight stop and large potential. For the timing of such entries, see the guide to support and resistance.
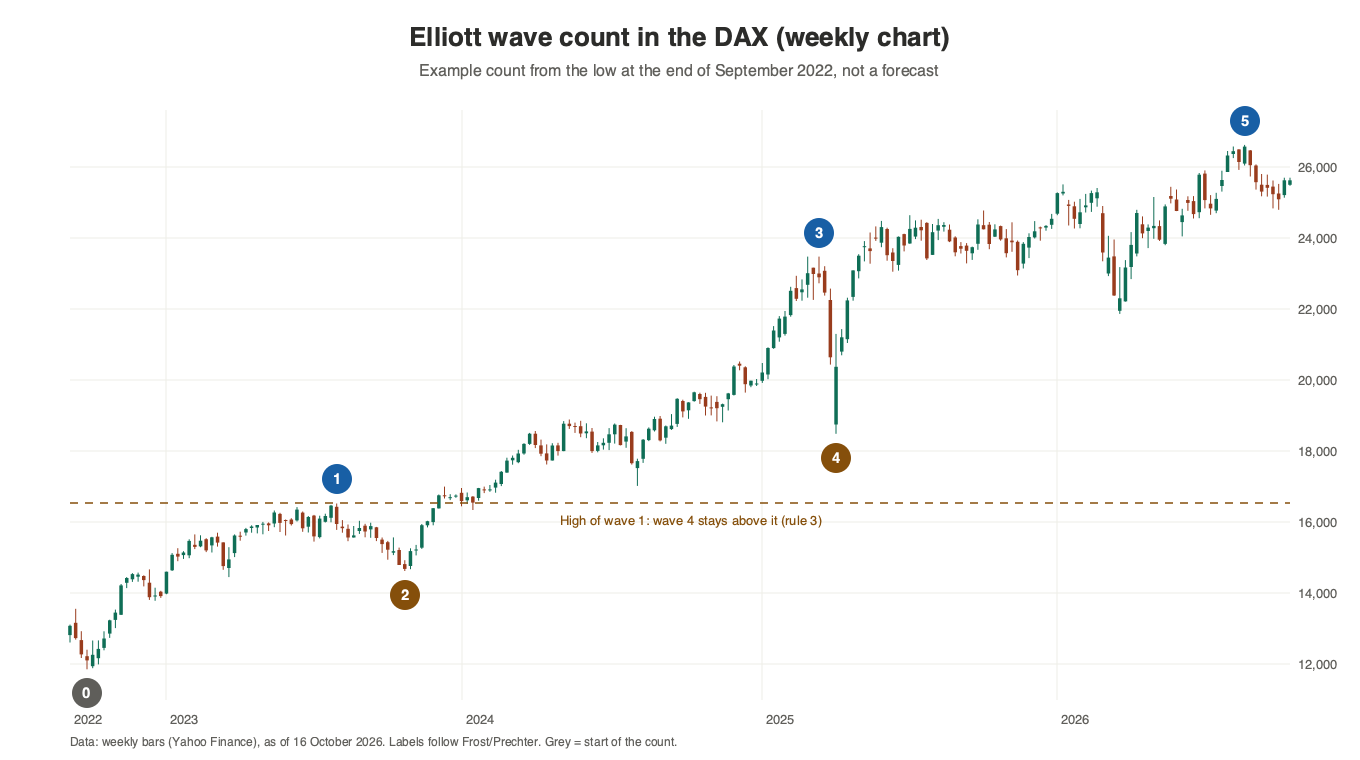
The weekly DAX chart below shows what such a count looks like. From the low at the end of September 2022 at about 11,860, the rally can be read as a five-wave advance: wave 1 to July 2023 (about 16,530), wave 2 to October 2023 with a retracement of about 40%, an extended wave 3 to March 2025 (about 23,480), a sharp wave 4 in April 2025 (about 18,490) and wave 5 up to the high in August 2026 (about 26,620). Note the dashed line: wave 4 stayed above the high of wave 1, so rule 3 held. The second message of this chart matters just as much: this is a simplified example count with hindsight, and the sub-waves are not shown in full. It reads the setback to about 21,860 in March 2026 as part of wave 5. It is one of several defensible readings, not a forecast.
 Click to enlarge
For your first counts, choose stocks and indexes with a calm price history, such as large DAX or S&P 500 stocks. Forex pairs and commodities have their own rhythms and are frustrating for first attempts. When you count, start with the impulse waves and their rules. You do not need to decode corrections fully at the beginning. Three waves against the trend means correction, a clean series of waves in one direction means trend. That is enough to start.
For software, what matters is good Fibonacci tools and clean wave labels. For occasional counts, TradingView is enough with its Fibonacci tools and Elliott wave drawing tools. For in-depth work, many Elliott analysts use specialist software such as MotiveWave.
What hit rate is realistic?
The honest answer first: there is no reliable hit rate for Elliott wave analysis. I know of no independent study that proves a specific success rate for the method. Anyone who promises you concrete percentages is selling you something.
There is a structural reason for this: wave counting is an interpretation, not a mechanical rule. Two analysts can count the same chart differently, both within the rules, and reach opposite forecasts. Looking back, a count almost always fits; looking forward, several compete. Critics rightly call this the biggest weakness of the method.
So why is it still worth learning? Because the hit rate of forecasts is not the point. The value of the method lies in three other places, and none of them needs a forecast:
- Structure instead of opinion: the rules force you to divide the market into testable scenarios instead of following an opinion.
- Clear invalidation levels: every count tells you exactly where you are wrong. Small losses and larger gains can make up for a lower hit rate, but only if you do the maths: hit rate, average win, average loss and costs decide together. The calculation behind it is explained in the guide to position sizing.
- Market phase filter: the waves show you when to be active (motive phases) and when waiting is the better position (corrective phases).
Robert Prechter summed up how to deal with uncertainty in a 2010 interview. He told The Globe and Mail: “I’m saying: ‘Winter is coming. Buy a coat.’” The waves give you probabilities and scenarios, not certainties. Accept that and you have a strong tool; look for certainty and you will fail with any method of analysis.
Why I no longer trade Elliott waves
Now the personal view you will not find on broker websites: I translated the standard work and applied the method for years, yet I no longer trade by Elliott. In 1995 I came across “Trading the Ross Hook” by Joe Ross. I switched to his trading approach, became his representative in Germany for more than 17 years and translated ten of his books. At its core, I have stayed with this approach to this day.
The reason is practical: Elliott waves demand constant interpretation. You keep the count, weigh alternatives and match the degrees. Joe Ross’s approach starts directly at market structure, with clearly defined formations and entries. For my daily trading that was simply more practical: less interpretation, faster decisions. How this approach works is described in my guide to price action trading.
Was my Elliott period wasted? Not at all, because thinking in trend waves and corrective waves has stayed with me. It is part of every chart analysis I do. Once you understand the waves, you see markets differently: you notice when a trend is young, when it is mature and when a correction is only a pause. This understanding of structure is the lasting value of the theory, whether or not you later trade strictly by Elliott.
My recommendation: learn Elliott waves as a school of market understanding, not as a signal system. Whether you end up trading by them or, like me, land on a more direct approach depends on your own practice. Both paths start with reading the chart as a sequence of trends and corrections.
Conclusion: worth learning, even if you do not trade it strictly
Elliott wave theory is the most detailed description of how trends are built that technical analysis has. The basic pattern of five waves and three corrective waves, the three hard rules and the Fibonacci ratios give you a framework to read any chart in a structured way. No other concept forces you so consistently to tell trend from correction.
At the same time, the method is demanding and depends on interpretation. I know of no proven hit rate, and without fixed invalidation levels and risk management even the nicest count turns into a loss. Anyone who sells you the waves as a simple signal system has not understood them.
My advice after almost four decades with the theory: read the standard work by Frost and Prechter, count waves yourself in calm markets and check honestly whether the method suits your temperament. The understanding of market structure you gain stays with you, whatever approach you end up trading.
Frequently asked questions about Elliott wave theory
What does Elliott wave theory say?
Elliott wave theory says that prices move in repeating patterns: five waves with the trend, then three corrective waves. It was developed in the 1930s by Ralph Nelson Elliott, who traced the patterns back to the crowd psychology of investors.
Is Elliott wave theory reliable?
The theory is an established concept of chart analysis with clear rules and a history of more than 85 years. Used seriously, it comes with alternative counts, fixed invalidation levels and a stop-loss. Providers who promise certain forecasts or fixed hit rates with the waves are not serious, because the method cannot deliver that.
What is the success rate of Elliott wave analysis?
I know of no reliable success rate that would apply in general. Wave counting is an interpretation, not a mechanical rule, so it cannot be measured honestly as a single rate. A favourable risk-reward ratio can help. Whether a specific approach is profitable also depends on the hit rate, execution and costs, and has to be tested separately.
How many Elliott waves are there?
A complete cycle consists of eight waves: five motive waves (1 to 5) and three corrective waves (A, B, C). Because of the fractal structure, each of these waves contains smaller waves; one degree lower there are already 34 waves. Elliott himself named nine degrees, from the Grand Supercycle to the Subminuette.
How far does wave 4 retrace?
A common reference mark for wave 4 is a retracement of about 38.2% of wave 3, together with the area of the fourth wave of one lesser degree. That is a guideline, not a rule. Only the limit is fixed: wave 4 must not enter the price range of wave 1, otherwise the impulse count is invalid.
Which book is the standard work on Elliott waves?
The standard work is “Elliott Wave Principle” by A. J. Frost and Robert Prechter, first published in 1978. I published the first German translation in 1989 with Markt & Technik. The current German edition (second edition, 2016) comes from FinanzBuch Verlag.
Which software is good for Elliott wave analysis?
For occasional counts, TradingView with its Fibonacci and labelling tools is enough. If you work with the waves regularly, specialist software such as MotiveWave offers support for automatic counts. Whatever the tool, the count and the invalidation level remain your decision.
This article was written by Karsten Kagels, who translated Frost and Prechter’s book into German in 1989 and traded Elliott waves for years before switching to Joe Ross’s approach. The German edition was reviewed by Christian Möhrer. The DAX count is a historical example built from Yahoo Finance weekly data; it is one possible reading, not a forecast and not investment advice.
This article is translated from the German edition on kagels-trading.de.
More Chart Techniques guides
- Draw key levels
Support and Resistance: How to Draw and Use Key Levels
Where useful levels come from, how to draw zones with a stated rule and how to turn a level into a trade plan.
- Read price action
Price Action Trading: How to Read Charts Without Indicators
Market structure, key zones and three bar patterns, with a core setup and a real SPY example where the signal failed.
- Trade breakouts
Breakout Trading Strategy: Entries and False Breakouts
How often breakouts fell back into the range in our count of 1,472, and how to plan entry, stop and position size.
- Draw and trade trendlines
Trendline Trading: How to Draw Trendlines and Trade Them
How to draw trendlines with a fixed rule, four strategies for bounces, breaks and retests, and a real SPY line break without a lasting reversal.
- Use Fibonacci levels
Fibonacci Retracement Levels: How to Draw and Trade Them
How to calculate and draw retracement levels, trade pullbacks with confluence and a stop at the structure, and what a ten-year test says about the levels.
- Set Fibonacci targets
Fibonacci Extension: Levels, How to Draw It and Calculator
Three-point extension targets from the end of a pullback, why they differ from levels beyond 100%, a free calculator and three SPY swings, one without a single target reached.
- Trade gaps
Gap Trading Strategy: How to Trade Gaps and When Gaps Fill
Opening and full gaps, the four classic gap types, how often SPY gaps filled in our count since 2001, and plans for gap fill and gap and go.
- Calculate pivot points
Pivot Points: Formulas, Types and How to Trade Them
Formulas for standard, Fibonacci, Woodie, Camarilla and DeMark pivots, a free calculator, which session counts and a real SPY day.
- Swing trade
Swing Trading: 4 Strategies, Risk and Real Examples
Four swing trading strategies on the daily chart, position size, gap risk and US rules, with two hypothetical SPY pullbacks: one hit its target, one was stopped out.
- Identify market stages
Stage Analysis: Stan Weinstein's Four Market Stages
Stan Weinstein's four stages on the weekly chart, a Stage 2 checklist and two TSMC breakouts: one ran for a year, one gapped through its stop.
- Read Wyckoff ranges
Wyckoff Method: Accumulation, Distribution and Springs
Accumulation and distribution with phases A to E, springs and upthrusts as optional tests, and two real TSMC ranges read with and without hindsight.
- Trade Darvas boxes
Darvas Box Strategy: Rules, Entries and Stop Losses
The box rules step by step, when the edges become known, where the stop goes, and a mechanical test on TSMC in 2024 with two honest results.
- Trade order blocks
Order Blocks: How to Spot, Draw and Trade the Zone
The three conditions behind a valid order block, entry and stop at the zone, two SPY cases from 2026 and a 25-year count where a fixed rule lost money.
- Interpret volume
Volume Analysis in Trading: How to Read Volume Honestly
What volume counts in stocks, futures, forex and crypto, how to read it against its own average, and our SPY test of high-volume days since 2001.