
Breakout Trading Strategy: Entries and False Breakouts


Contents
- Breakout trading in 30 seconds
- What is a breakout in trading?
- How often do breakouts fall back? Our measurement
- How to filter breakouts
- False breakouts: what they are and how to handle them
- Breakout trading strategy step by step
- The opening range breakout
- Risk management for breakout traders
- Pros and cons of breakout trading
- Conclusion: plan for the breakout that fails
- Frequently asked questions about breakout trading
- About the author
A breakout is the moment price moves past a level where it has stalled before. Breakout traders enter right there. The appeal is clear: the entry follows a rule, the planned risk can be estimated before the order goes in, and you may join a move near its start instead of in the middle.
The catch is just as clear. In our own count of 1,472 breakouts in three stock indexes, about two out of three closed back inside the range within ten trading days. This guide shows what a breakout is, which filter was linked to a lower rate in our data, how to plan entry, stop and position size, and where the method has limits. This article follows our editorial policy.
Breakout trading in 30 seconds
- A breakout is a move beyond a price level or range that held before, often support or resistance. Our measurement counts it only when a daily bar closes beyond the range.
- Breakout trading means entering in the direction of that move, either at the break or after a retest of the broken level.
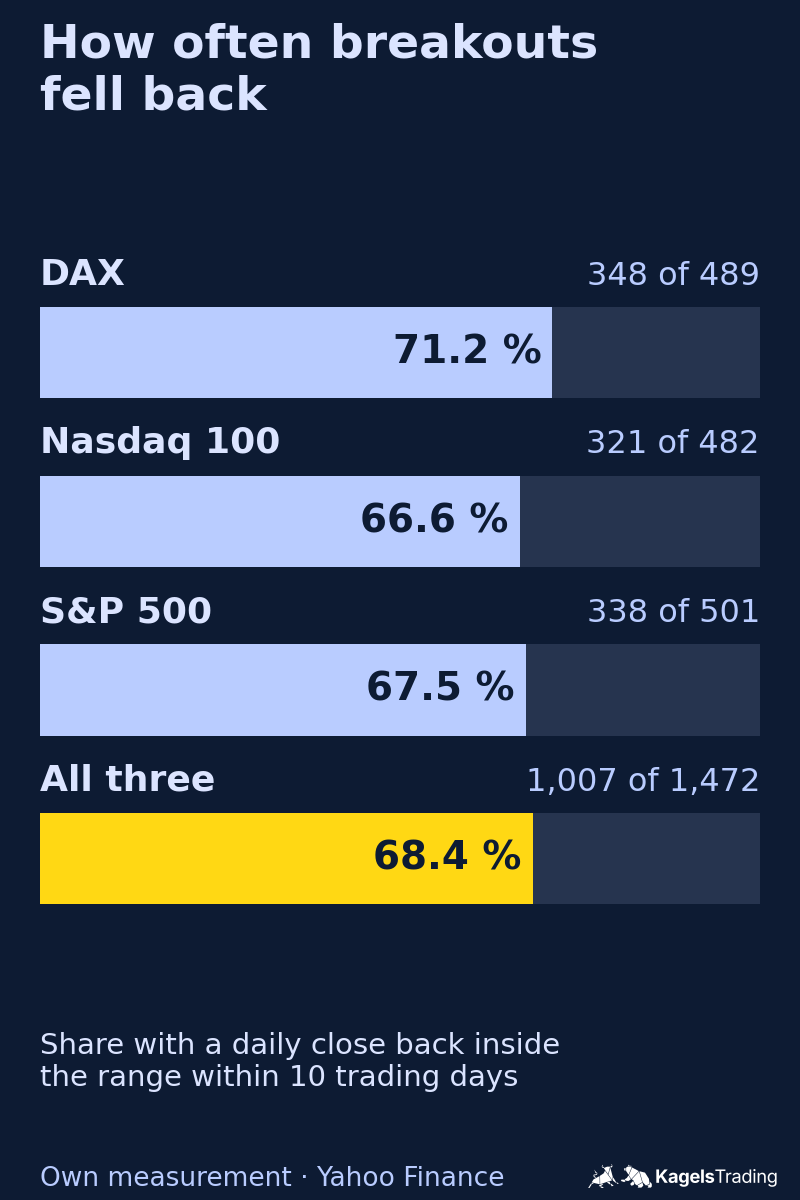
- Most breakouts in our count fell back: 68.4 % of 1,472 breakouts in the DAX, Nasdaq 100 and S&P 500 closed back inside the range within ten trading days.
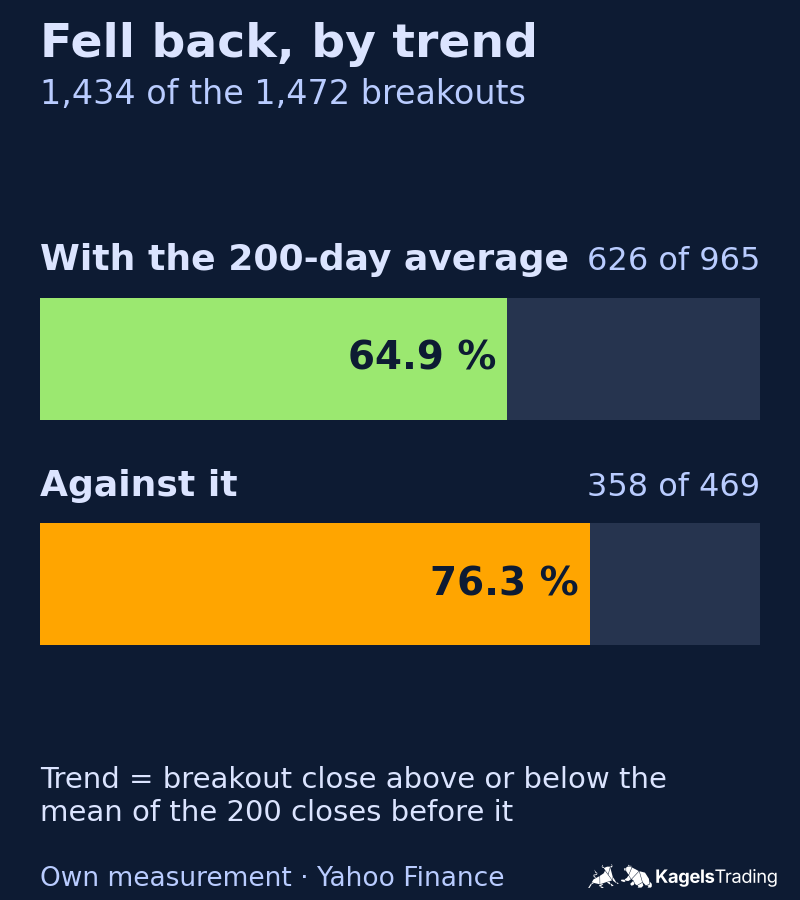
- The trend groups differed: breakouts in the direction of the 200-day average fell back less often (64.9 %) than breakouts against it (76.3 %). That is a historical association, not proof of a working filter.
- Every breakout trade needs a stop planned before entry and a position size that fits it.
What is a breakout in trading?
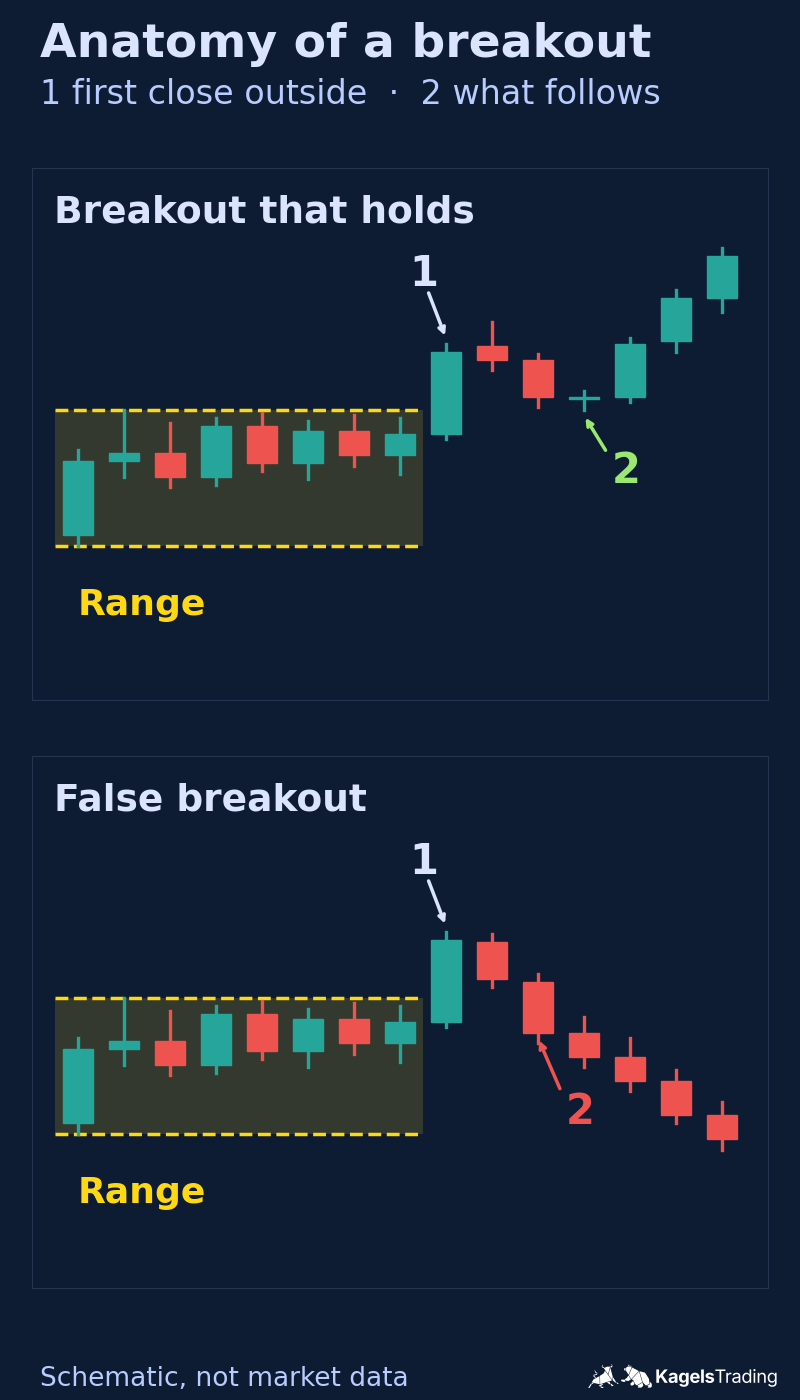
A breakout happens when price leaves a range that held before. Often that range is bounded by a resistance level that price could not get above, or a support level it could not get below. When price moves beyond it, the balance between buyers and sellers may have shifted. That can be the start of a new trend, but it does not have to be.
Breakouts come in several forms. Price can move above a horizontal level, leave a chart pattern such as a triangle, break a trendline or cross a moving average. Which form you trade depends on your time frame, your market and the tools you use. Our guide to support and resistance shows how to draw the levels that most breakouts start from.
 Click to enlarge
Source: Kagels Trading, own drawing.
Breakout trading is also the idea behind well-known systems. In simplified terms, the Turtle traders of the 1980s bought when price moved one tick above the high of the previous 20 days (System 1) or 55 days (System 2), with a first stop two N away. N is their smoothed measure of the daily true range, which includes gaps. According to the Original Turtle Trading Rules published by former Turtle Curtis Faith, they entered during the day as soon as price crossed the level and did not wait for the daily close. System 1 also skipped a breakout if the previous one would have been a winner. The full rules cover much more than this sketch; our guide to Turtle trading walks through them. An earlier example is Nicolas Darvas’s box method from the 1950s.
Which patterns lead to breakouts?
A breakout needs a boundary to cross. That boundary usually forms in a consolidation, a phase in which price moves in a narrow range and neither side takes control. The shape of that phase often shows which direction traders watch first.
| Pattern | Feature | Direction traders watch first |
|---|---|---|
| Rectangle | Flat upper and lower boundary | Either |
| Ascending triangle | Flat resistance, rising lows | Up |
| Descending triangle | Flat support, falling highs | Down |
| Symmetrical triangle | Falling highs, rising lows | Either |
| Flag and pennant | Short pause after a strong move | With the prior move |
| Wedge | Both lines slope the same way | Against the slope |
The direction in this table is a tendency, not a promise. An ascending triangle can break down. The pattern tells you where to draw the breakout level and which side to watch first. It does not replace the stop-loss. Our measurement below did not classify patterns, so it says nothing about which pattern works best.
How often do breakouts fall back? Our measurement
Many articles say that breakouts often fail, but few show a number. We counted. The data are daily bars of the DAX, Nasdaq 100 and S&P 500 from August 2001 to August 2026, about 6,300 trading days per index, from Yahoo Finance.
We used the following fixed rules. A range was ten trading days whose total range, highest high minus lowest low, was at most four times the average daily range (high minus low) of the previous 50 days. A breakout was the first daily close above the range high or below the range low within the next 40 trading days. A breakout fell back if any daily close in the following ten trading days was inside the range again, the boundaries included.
The scan moved forward in a fixed way. We checked one session at a time until ten days met the width rule. After a range was found, the next check started ten sessions later, even if that range broke out much later. Different ranges can therefore share the same breakout date, their follow-up periods can overlap, and the three indexes move together. The 1,472 observations are not 1,472 independent market events.
 Click to enlarge
Source: Kagels Trading, own measurement.
Of 1,472 breakouts, 1,007 closed back inside the range within ten trading days. That is 68.4 %. In the DAX it was 71.2 %, in the Nasdaq 100 66.6 % and in the S&P 500 67.5 %. For the 465 breakouts that did not fall back within ten days, price reached a median of about 1.7 range widths beyond the range at its furthest point, measured from the breakout day through up to 40 trading days after it. A few breakouts near the end of the data had a shorter window. That is the furthest point, not a realistic exit, and some of these breakouts may have returned later.
Read this number for what it is. It counts price behavior, not trades. There is no stop, no target and no cost in it, so it is not a loss rate. A breakout can close back inside the range once and still continue later, as the second SPY example below shows.
How to filter breakouts
If most breakouts fall back, the question is which ones to skip. We checked one filter on the same breakouts. The others below come from trading practice and the German source article. We say which is which.
Trade in the direction of the larger trend
The with-trend group fell back less often in this historical sample. We called a breakout with the trend when it went up while its close was above the mean of the 200 closes before it, or down while its close was below that mean. This is a lagged 200-day average; we did not test whether the average was rising or falling.
 Click to enlarge
Source: Kagels Trading, own measurement.
With the trend, 64.9 % of 965 breakouts fell back; against it, 76.3 % of 469. That is still a majority in both groups. The difference also shows up when we split by direction:
| Breakout direction | With the 200-day trend | Against it |
|---|---|---|
| Up | 483 of 773 = 62.5 % | 109 of 154 = 70.8 % |
| Down | 143 of 192 = 74.5 % | 249 of 315 = 79.0 % |
Most of these 25 years were a rising market, so upside breakouts make up most of the with-trend group. The pattern holds in both directions, but it is a historical association in one sample, not an out-of-sample test and not proof that the filter makes money after costs. How such a rule is tested step by step before it trades as a system is shown in our algo trading guide.
Volume: useful information, but test it yourself
Higher volume means more shares or contracts traded. It does not by itself show how many traders took part, and it does not predict success. Many breakout traders still look for volume clearly above its recent average on the breakout day, and for volume that dried up during the consolidation.
We could not check this reliably in our data. Using an exploratory threshold of 1.4 times the 50-day average, only 15 to 61 breakouts per index qualified, and the volume fields of index data need their own check. That is too little for a percentage we would publish. Test any volume rule on the individual stocks or futures you trade. How to read volume against its own average is explained in our guide to volume analysis.
In spot forex, chart volume means something else. The spot currency market has no consolidated volume tape. The volume in most forex charts is the broker’s tick volume, the number of price changes in its own feed, as MetaTrader’s help explains. It measures activity in that feed, not total traded volume. Currency futures on the CME do report exchange volume. Many spot forex traders rely on the close beyond the level or the trend on a higher time frame instead.
Clear levels that many traders can see
A level that stands out on the chart gets more attention. Yearly highs, round numbers and levels that held several times are watched by many traders. A break of such a level may draw more orders, but traders can also place stop orders just beyond it. That is one possible reason why breakouts at obvious levels can snap back.
News: a volatility signal, not a direction signal
Earnings and central bank decisions make price move, but they do not tell you which way. Tesla reported second-quarter 2024 results on July 23, 2024, after the close. Revenue was $25.5 billion and non-GAAP earnings per share $0.52, according to the Q2 2024 column in Tesla’s quarterly update. Benzinga reported consensus estimates of $0.62 per share and $24.73 billion in revenue, so earnings missed while revenue beat.
The next day the stock opened at $225.42, below the lows of the preceding ten trading sessions. It closed at $215.99, down 12.3 % from the prior close. Whoever held a position through the report carried the full gap risk, which the gap trading guide covers in detail. Many breakout traders stay flat before such events and trade the breakout that forms afterwards.
False breakouts: what they are and how to handle them
A false breakout, or fakeout, is a break that does not last. Price moves beyond the level and then returns into the range, often within a few bars. Traders who bought the break are then trapped and may exit at their stops, which can push price back faster.
Signs that a breakout may not hold include a long wick back into the range, low volume and a break against the larger trend. None of these is a guarantee. In our data even breakouts with the trend fell back in almost two out of three cases.
You cannot avoid false breakouts, you can only plan for them. Losses are part of every breakout method. You control the position size and the planned exit, but gaps and slippage can make the realized loss larger. Some traders go one step further and trade the false breakout itself, back into the range, once price has closed inside again.
Breakout trading strategy step by step
A rule you can test beats a feeling for “good” breakouts. The steps below describe a complete plan. The numbers in it are examples, not recommendations.
1. Mark the range
Draw the range on the time frame you trade. Use the highs and lows where price turned, or a fixed rule such as the high and low of the last ten bars. Write the rule down, so you draw the same range every time.
2. Define the trigger
Decide what counts as a breakout before the chart moves. A close beyond the range, like in our measurement, gives fewer signals than a touch of the level during the bar. An intraday trigger, like the Turtles used, gets you in earlier but also catches more spikes that reverse within the same bar.
A close-based rule needs an execution rule. The close is only known when the bar has ended. If you use it as your signal, decide how you enter, for example at the next open, and test with that price rather than with the signal close.
3. Choose direct entry or retest entry
There are two ways in, and each has a price. Both need the same stop and position size planning.
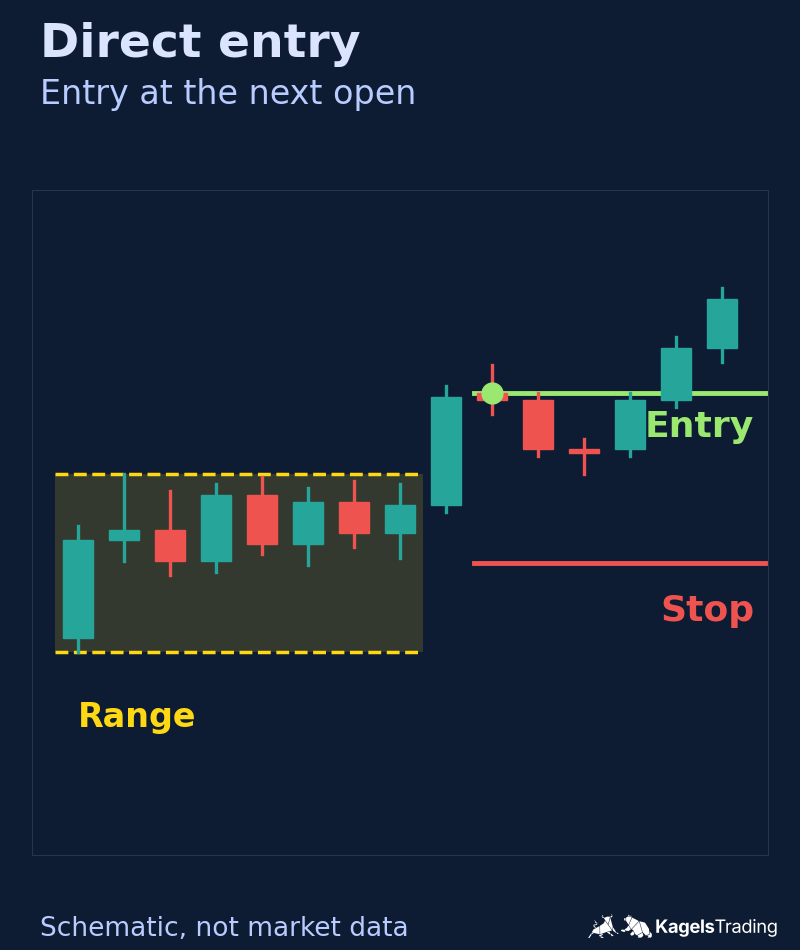
- Direct entry: you enter right after the breakout signal, for example at the next open. You are in when a move runs away, but you also take every breakout that falls back.
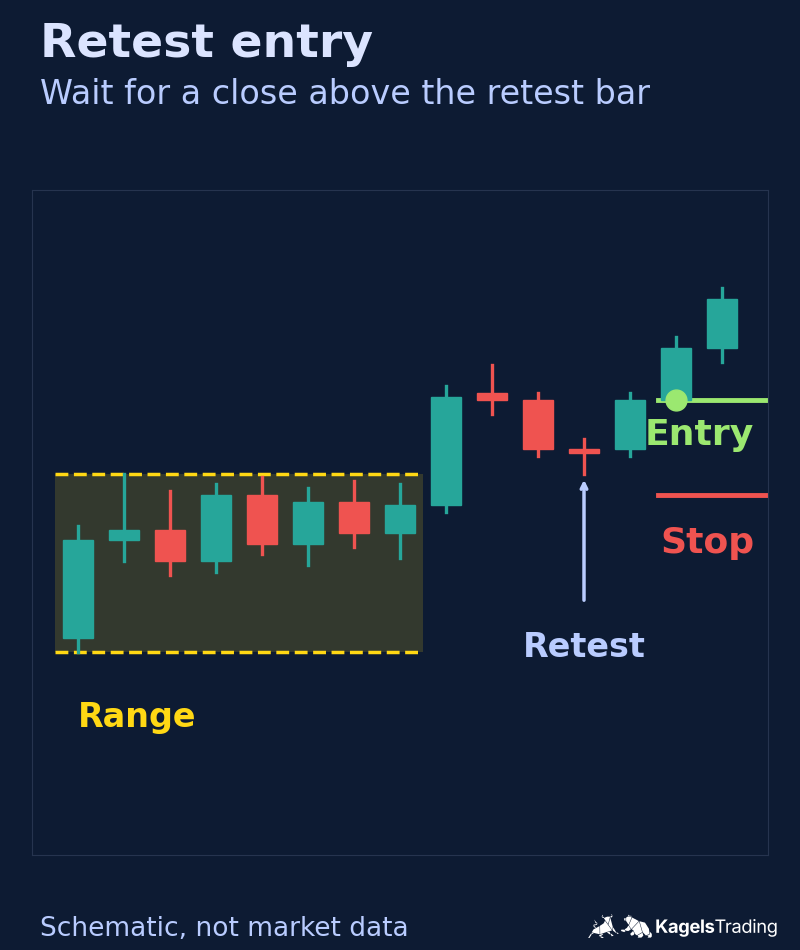
- Retest entry: you wait for price to come back to the broken level and for a confirmation, for example a close above the pullback bar’s high. A broken resistance may then act as support. You skip some false breakouts, but you miss moves that never come back.
 Click to enlarge
Source: Kagels Trading, own drawing.
 Click to enlarge
Source: Kagels Trading, own drawing.
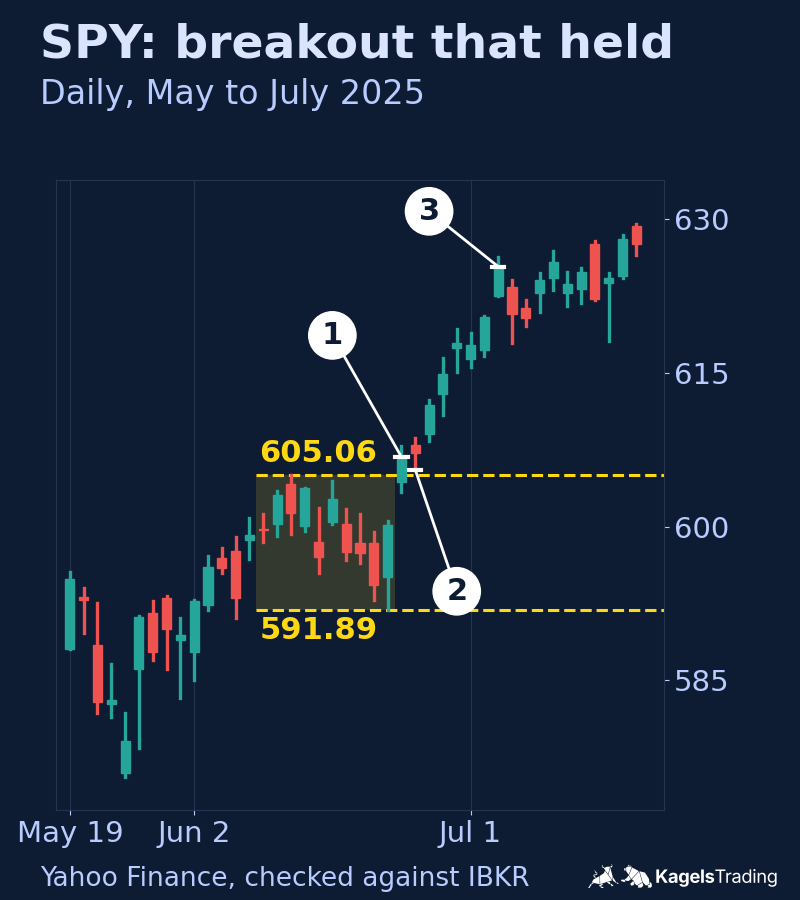
The SPY chart below shows one cost of waiting. SPY moved sideways between 591.89 and 605.06 from June 9 to 23, 2025, and closed above the range on June 24 at 606.78. The next day’s low of 605.54 came within 48 cents of the old high. A hypothetical buy limit at exactly 605.06, placed after the June 24 close and active only during regular sessions, would not have been reached from June 25 through July 3, when SPY closed at 625.34. Other retest rules, such as a pullback zone with a confirmation, could give a different entry.
 Click to enlarge
I personally prefer the direct entry. In my own trading it has often given me a better ratio of possible gain to risk, even if I get stopped out early more often. That is personal experience, not a result of the measurement above, and a retest can also give a tighter stop. You have to find out through testing which way suits you.
4. Set the stop and the target together
The stop and the target belong to one plan and must be tested together. With a direct entry, one common stop is the middle of the range. With a retest entry, the stop can go below the pullback low. Some traders start with a target as far away as the stop, others with a target twice the initial risk. Neither ratio is right for every method, so adjust it with data.
Plan the loss in money before you enter. The formula is: planned loss = shares × stop distance × point value. For stocks the point value is 1. In the June 2025 example we use the June 24 close of 606.78 for illustration; a real close-based rule would enter later, for example at the next open. With a stop in the middle of the range at 598.48, the stop distance is $8.30, and with 100 shares the planned loss is 100 × $8.30 × 1 = $830 before costs. A gap or fast market can make the real loss larger.
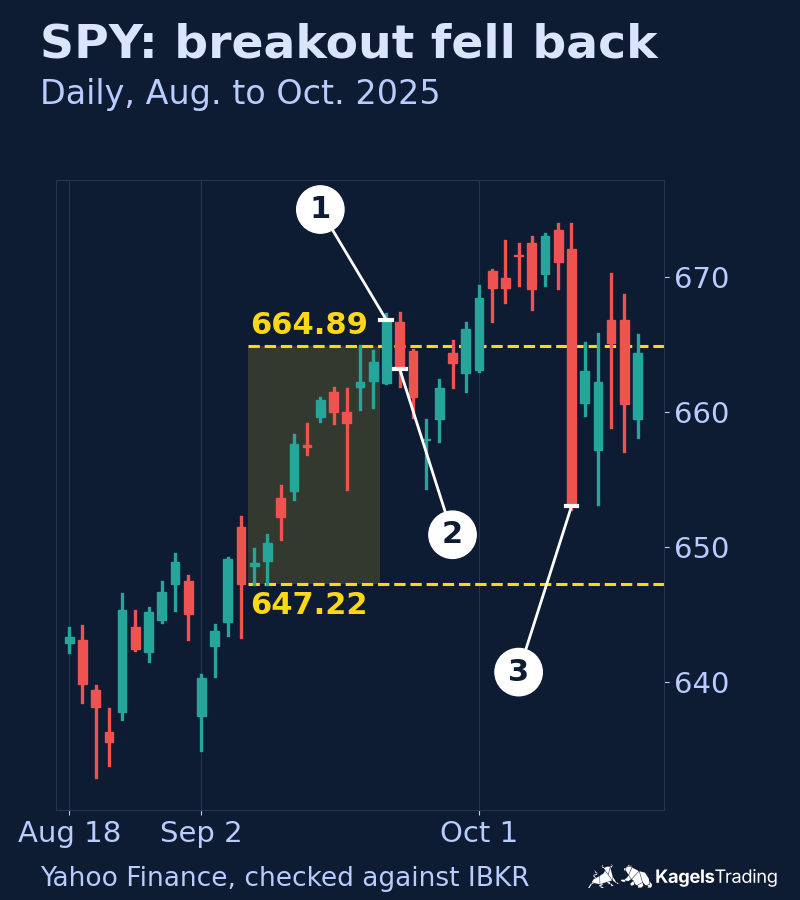
The second SPY example shows why the stop matters. SPY moved between 647.22 and 664.89 from September 8 to 19, 2025, and closed above the range on September 22 at 666.84. The next day it closed at 663.21, back inside the range. In early October it closed above the range again, and on October 10 it dropped to a close of 653.02.
 Click to enlarge
5. Add filters one at a time
Each filter removes trades, good ones and bad ones. Add them one by one and check what each does to your results. The trend filter is a reasonable first candidate, because the with-trend group fell back less often in our data. Then test volume if you trade stocks or futures.
6. Test before you risk money
Test the rules on past data first, then in a simulated account. Collect at least 100 example trades as a practical starting point, not as statistical proof, and write each one into a trading journal. TradingView’s Bar Replay and Strategy Tester let you step through past charts, and paper trading lets you practice live without money.
The opening range breakout
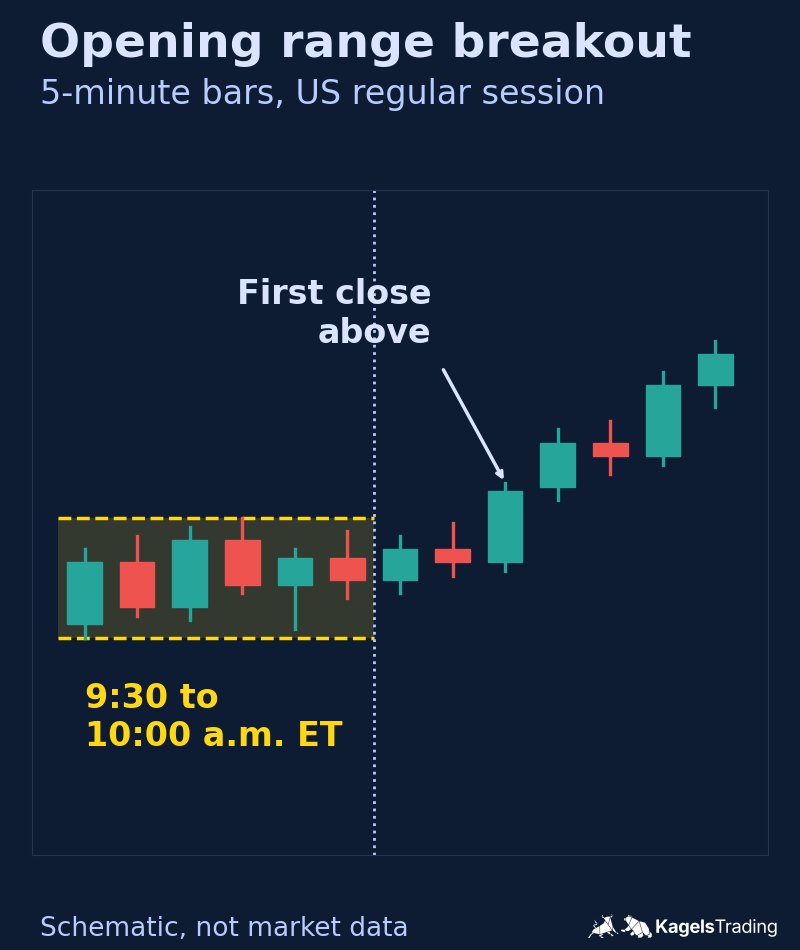
The opening range breakout is a breakout method with fixed times. It is best known through Toby Crabel, who wrote the standard book on it in 1990. You mark the high and low of the first minutes after the open and trade the first break of that range. In the US stock market the regular session opens at 9:30 a.m. Eastern Time, so a 30-minute opening range runs from 9:30 to 10:00 a.m.
 Click to enlarge
Source: Kagels Trading, own drawing.
The same idea can be built with very different targets. A separate DAX backtest on our German site reported high win rates with small targets, but remained sensitive to period and filters and to occasional large losses. It was not evidence of a robust live strategy.
Carlo Zarattini and Andrew Aziz tested a design with large targets. In their study on the Nasdaq ETF QQQ (first version April 2023, checked version of September 2025), covering January 2016 to February 2023, they used a modified opening range approach. They entered at 9:35 a.m. ET in the direction of the first five-minute candle, without waiting for a separate break of its high or low, and skipped days when that candle was a doji. The stop was at the other end of the first candle, the target ten times the risk, and open trades closed at the end of the day. With such a ratio, a low win rate can be enough. The study charges a commission but assumes no slippage and has no explicit spread allowance, so real results can be weaker.
Choose one design before your first trade. If you set a target of ten times the risk and switch to a target as far away as the stop after four losses in a row, you end up with the drawbacks of both designs and the benefits of neither.
Risk management for breakout traders
Without risk management, no breakout strategy lasts. Set clear rules before you trade, and write them into your trading plan. The full set is explained in the guide to risk management in trading:
- Risk per trade: risk only a small share of your account on each trade, for example 0.5 to 2 %. The Kelly criterion shows why the full value from that formula is far too large for trading.
- Daily loss limit: stop trading for the day after a set loss, so you do not try to win it back with bad trades.
- Target versus risk: choose a target that fits your win rate. With many false breakouts, a target of about twice the initial risk is a common starting point to test, not a rule.
Trade what you tested. If a setup works in your tests, trade it the same way. Every change on the fly distorts your results and makes it hard to see what works. Discipline is the part of breakout trading that no filter can do for you.
Pros and cons of breakout trading
Breakouts give clear rules and pay for them with many false signals. Weigh both sides before your first breakout order and check them against your own tests.
| Pros | Cons |
|---|---|
| Objective entry: once the range is drawn, the level is fixed | Most breakouts fell back in our count: 68.4 % within ten trading days |
| Planned risk defined before entry: the range gives a natural place for a stop | Large targets usually mean fewer winners, and long losing streaks are hard to sit through |
| Early in the move: you enter near the start of a possible trend | No consolidated volume in spot forex, so one common filter works differently there |
| Works in many markets: stocks, indexes, futures, forex and crypto form ranges | Quiet sideways markets can produce one false breakout after another |
Conclusion: plan for the breakout that fails
Breakout trading is a clear, testable way to enter the market, but it is not a shortcut. In our data most breakouts fell back into the range, and breakouts with the trend fell back less often than those against it. What decides the result is not a single breakout, but how you size, stop and repeat your trades.
Start with one market, one time frame and one set of rules. Test it, write down every trade and change one thing at a time. If you use levels from your own charts, the guide to support and resistance shows how to draw them with a stated rule. Intraday traders can combine breakouts with the VWAP indicator as a reference for the day’s average price.
Frequently asked questions about breakout trading
What is breakout trading?
Breakout trading means entering a position when price moves beyond a level or range that held before. That level can be resistance, support or the boundary of a chart pattern. Traders buy on an upside breakout and sell short on a downside breakout, either at the break or after a retest of the broken level.
Is breakout trading a good strategy?
It can be, if the rules are tested and every trade has a stop. It is not a simple one: in our count of 1,472 breakouts in three stock indexes, 68.4 % closed back inside the range within ten trading days. Breakout traders need small losses on the many false breakouts and larger gains on the few that run.
What is the win rate of breakout trading?
There is no general number, because it depends on the trigger, the stop, the target and the market. With all other rules the same, a closer target is usually hit more often than a distant one, but no win rate is guaranteed. Our count of how often breakouts fell back (68.4 %) is a measure of price behavior, not a win rate, because it contains no stop, target or costs.
What is a false breakout?
A false breakout, or fakeout, is a move beyond a level that does not last. Price closes back inside the range soon after the break. Common signs are a long wick back into the range, low volume and a break against the larger trend. None of them is a guarantee.
Which time frame is best for breakout trading?
No time frame is best for everyone. Daily charts give fewer signals and more time to decide; intraday charts, such as a five-minute opening range, give more signals and need faster decisions. Choose the time frame that fits the time you have, and test your rules on it. Our guide to swing trading shows a daily-chart routine alongside a day job.
Which indicators help with breakout trading?
Volume and a long moving average are commonly used. Higher volume on the breakout day shows more shares or contracts traded, at least in stocks and futures, but it does not predict success by itself. A long moving average such as the 200-day average shows the larger trend; in our data breakouts with that trend fell back less often. On weekly charts, Stage Analysis combines both checks with the 30-week average. In spot forex, chart volume is usually the broker’s tick volume.
This US edition is based on our German edition on kagels-trading.de and has been adapted for US readers.
More Chart Techniques guides
- Draw key levels
Support and Resistance: How to Draw and Use Key Levels
Where useful levels come from, how to draw zones with a stated rule and how to turn a level into a trade plan.
- Read price action
Price Action Trading: How to Read Charts Without Indicators
Market structure, key zones and three bar patterns, with a core setup and a real SPY example where the signal failed.
- Draw and trade trendlines
Trendline Trading: How to Draw Trendlines and Trade Them
How to draw trendlines with a fixed rule, four strategies for bounces, breaks and retests, and a real SPY line break without a lasting reversal.
- Use Fibonacci levels
Fibonacci Retracement Levels: How to Draw and Trade Them
How to calculate and draw retracement levels, trade pullbacks with confluence and a stop at the structure, and what a ten-year test says about the levels.
- Set Fibonacci targets
Fibonacci Extension: Levels, How to Draw It and Calculator
Three-point extension targets from the end of a pullback, why they differ from levels beyond 100%, a free calculator and three SPY swings, one without a single target reached.
- Trade gaps
Gap Trading Strategy: How to Trade Gaps and When Gaps Fill
Opening and full gaps, the four classic gap types, how often SPY gaps filled in our count since 2001, and plans for gap fill and gap and go.
- Calculate pivot points
Pivot Points: Formulas, Types and How to Trade Them
Formulas for standard, Fibonacci, Woodie, Camarilla and DeMark pivots, a free calculator, which session counts and a real SPY day.
- Swing trade
Swing Trading: 4 Strategies, Risk and Real Examples
Four swing trading strategies on the daily chart, position size, gap risk and US rules, with two hypothetical SPY pullbacks: one hit its target, one was stopped out.
- Identify market stages
Stage Analysis: Stan Weinstein's Four Market Stages
Stan Weinstein's four stages on the weekly chart, a Stage 2 checklist and two TSMC breakouts: one ran for a year, one gapped through its stop.
- Read Wyckoff ranges
Wyckoff Method: Accumulation, Distribution and Springs
Accumulation and distribution with phases A to E, springs and upthrusts as optional tests, and two real TSMC ranges read with and without hindsight.
- Trade Darvas boxes
Darvas Box Strategy: Rules, Entries and Stop Losses
The box rules step by step, when the edges become known, where the stop goes, and a mechanical test on TSMC in 2024 with two honest results.
- Count Elliott waves
Elliott Wave Theory: Rules, Patterns and Fibonacci
The five-wave pattern, three hard rules, zigzags, flats and triangles, Fibonacci ratios and a real DAX count, from the first German translator of the standard work.
- Trade order blocks
Order Blocks: How to Spot, Draw and Trade the Zone
The three conditions behind a valid order block, entry and stop at the zone, two SPY cases from 2026 and a 25-year count where a fixed rule lost money.
- Interpret volume
Volume Analysis in Trading: How to Read Volume Honestly
What volume counts in stocks, futures, forex and crypto, how to read it against its own average, and our SPY test of high-volume days since 2001.