
DAX Forecast: Coming Days, Next Week and Long Term


The DAX closed the week at 25,154 points, above the September low. It is about 1,500 points below the all-time high and moves between the January high and last year's high. On Friday it tested the September low at 25,054; the wick on the 4-hour chart could point to a recovery tendency. For the start of the week the focus is on the 25,000 mark and last year's high at 24,770.
DAX forecast in 30 seconds
Weekly close
Closed at 25,154, just above the September low at 25,054. The momentum of the correction from the all-time high is tiring; last year's high at 24,770 has held so far.
Coming days
After the test of the September low the focus is on the 25,000 mark. The wick on the 4-hour chart could point to a recovery tendency; below follow the areas around 24,800 and 24,700.
The levels
Above, the January high at 25,510, then the all-time high at 26,620. Below, the September low at 25,054, the 200-day line at 24,856 and last year's high at 24,770.
Long term
The 3-month chart shows a long-term uptrend that remains intact. The October bar on the monthly chart is undecided; the monthly close is pending.
On this page
- DAX forecast in 30 seconds
- DAX forecast for Monday: after the test of the September low the focus is on the 25,000 mark
- DAX forecast for next week on the daily chart: a double-edged situation between last year's high and the January high
- What can move the DAX next: two central bank dates
- DAX forecast for the coming weeks on the weekly chart: momentum of the correction tires at last year's high
- Three scenarios: which level decides
- DAX forecast 2026 and for the year end: October bar undecided, monthly close pending
- DAX forecast long term: the uptrend on the 3-month chart
- How this forecast is made
- Conclusion: the DAX holds above the September low, last year’s high in focus
- Frequently asked questions
- Please note
DAX forecast for Monday: after the test of the September low the focus is on the 25,000 mark
For Monday, 26 October 2026
 Click to enlarge
All charts on this page are by Karsten Kagels and from now on show the prices of the DAX CFD from Capital.com. Because the CFD also trades outside Xetra hours, it shows the moves overnight and gives a better view of the markets. Depending on the provider, prices can differ slightly; for the analysis this does not matter. All charts were exported on 24 October 2026 between 12:16 and 12:27 CEST and show Friday's weekly close. Each caption names its own state. Anyone trading the DAX future also sees slightly different prices.
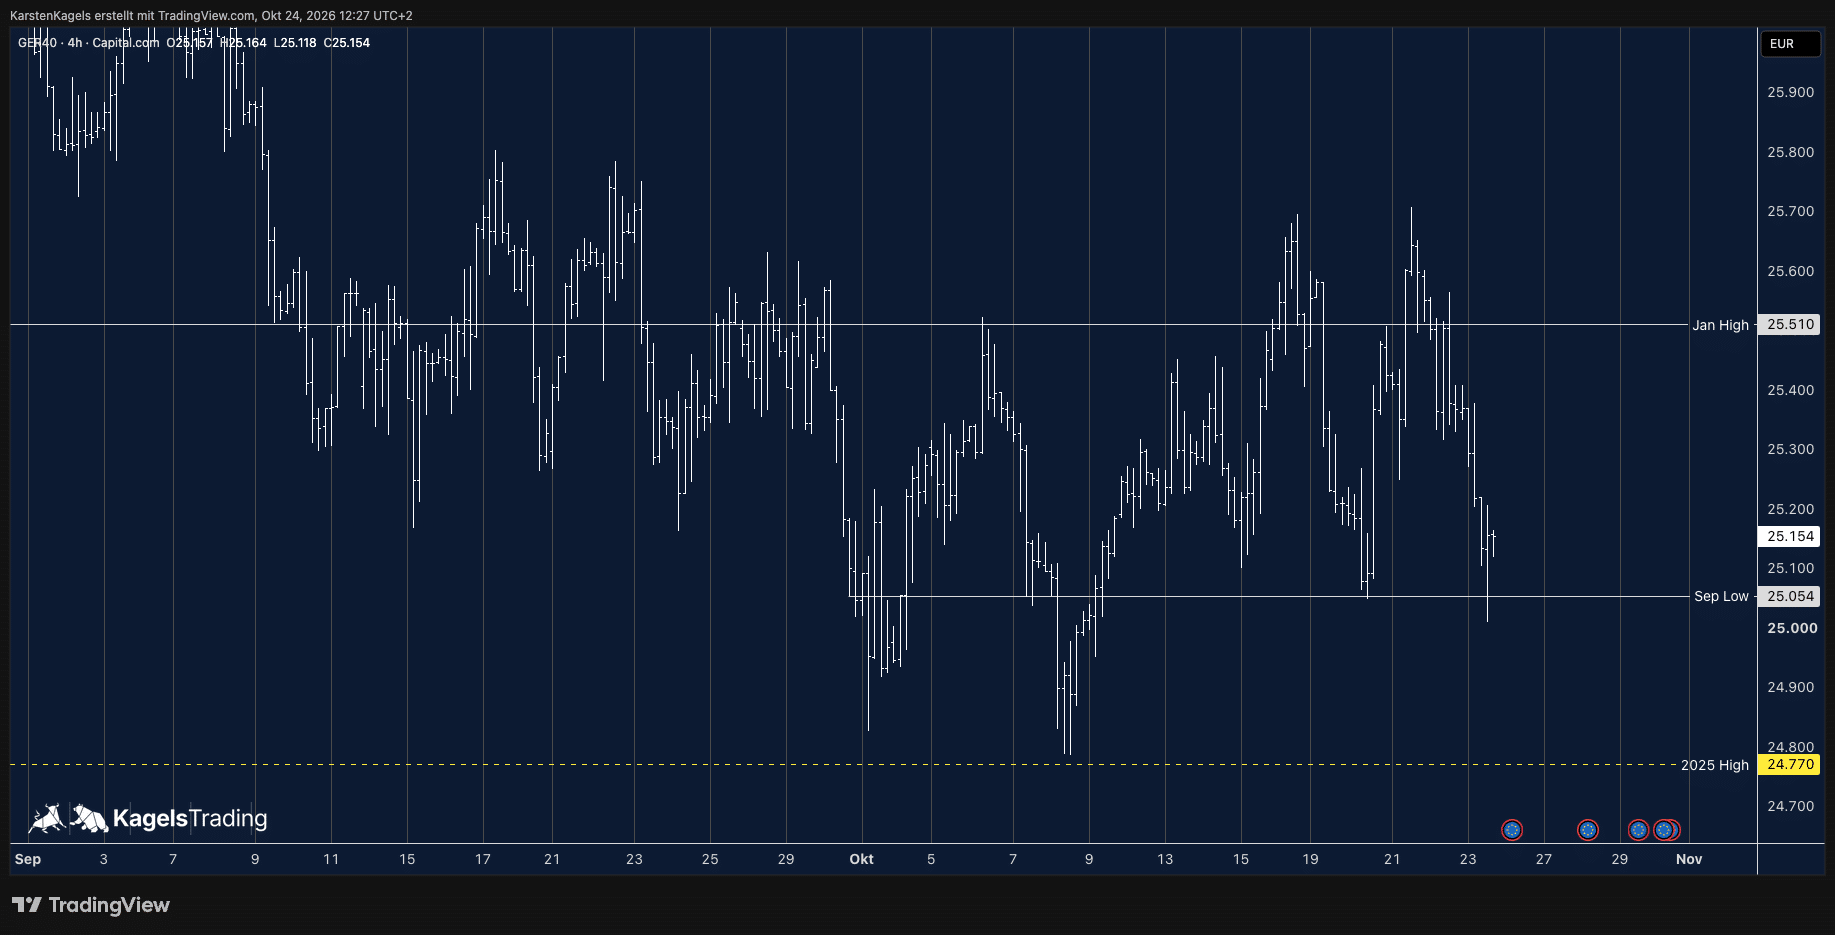
On the 4-hour chart the DAX tested the September low on Friday. It fell to 25,010, briefly below the September low at 25,054, and closed at 25,154, above it again. The prominent wick of Friday's candle points to demand in this area and could be read as a sign of a recovery tendency in the coming week.
The round 25,000 mark stays in focus. A break below it would send the DAX toward the areas around 24,800 and 24,700, where support is expected first. The price behavior there could give a signal. A decisive break without a big struggle around last year's high at 24,770 would likely signal stronger downward pressure.
At the start of the week it remains to be seen whether the recovery tendency prevails. The DAX CFD already trades before the open. If the DAX holds above the September low and the 25,000 mark, the sideways tendency at last year's high can continue. A recovery above the January high at 25,510 would amount to a kind of reversal pattern. What counts are the levels from the 4-hour and daily chart: the January high above, the 25,000 mark and last year's high below.
Resistance
- 26,620
- 25,624
- 25,510
Price at analysis25,154
Support
- 25,054
- 24,856
- 24,770
DAX forecast for next week on the daily chart: a double-edged situation between last year's high and the January high
Week of 26 October 2026
 Click to enlarge
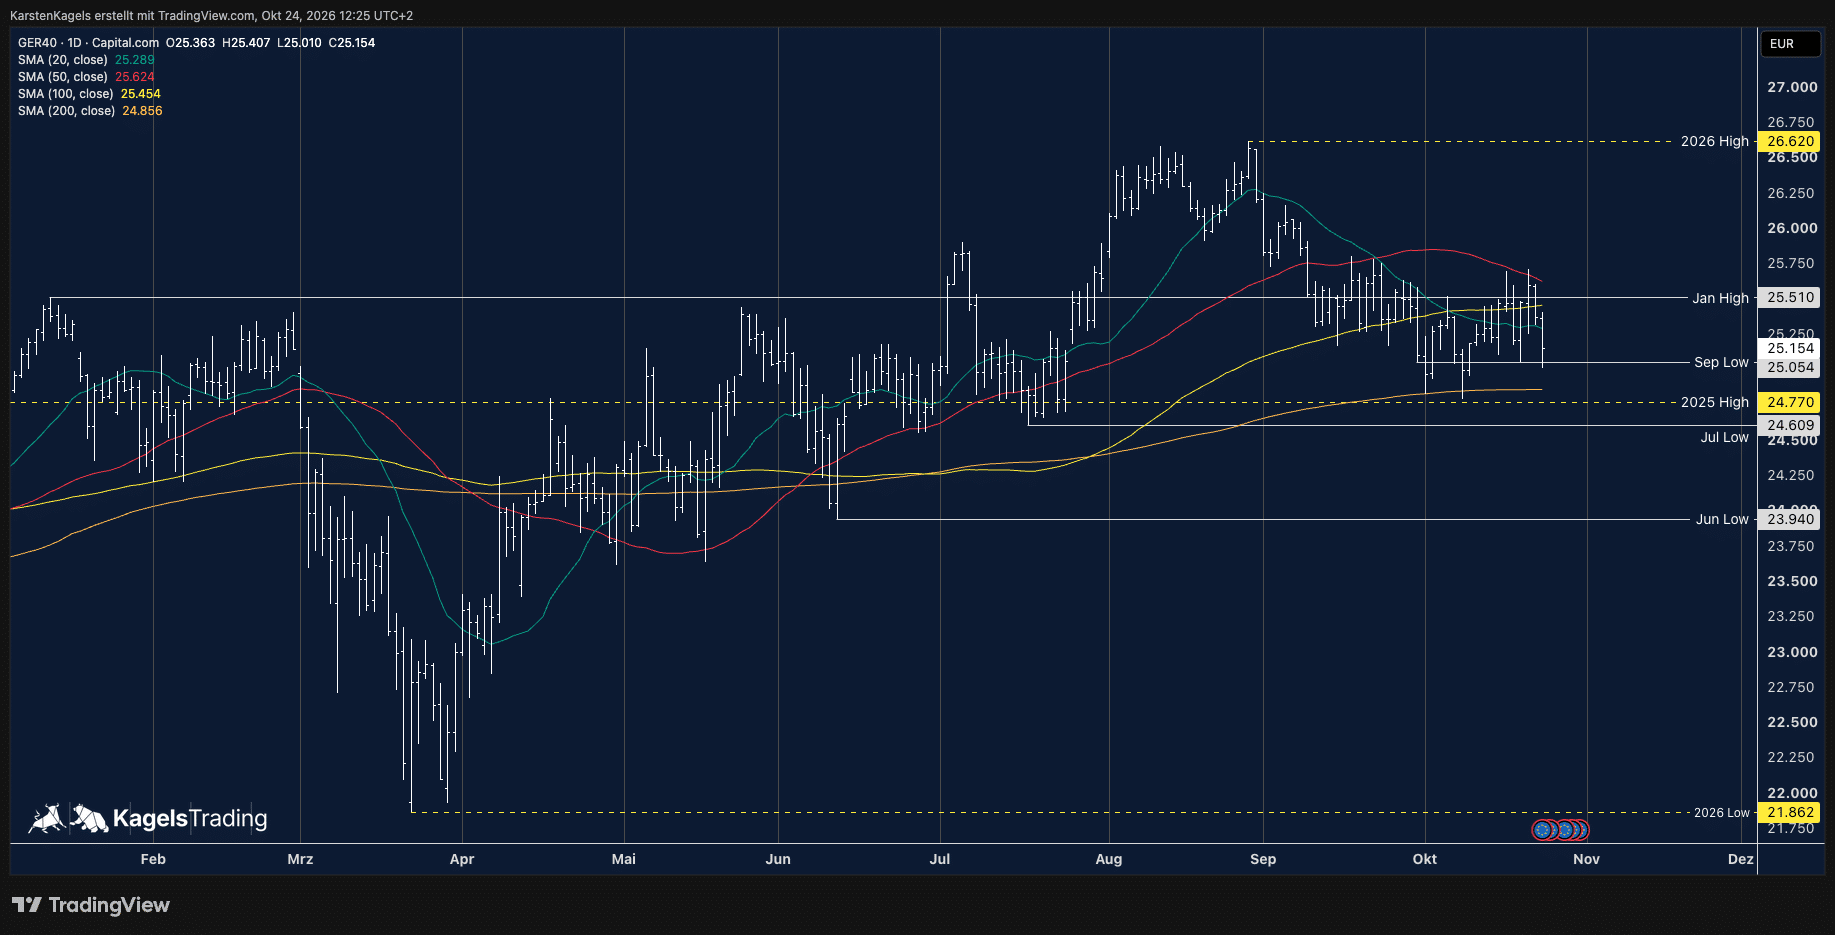
On the daily chart the situation is double-edged. On Friday the DAX opened at 25,363, reached a high of 25,407 and a low of 25,010 and closed at 25,154, 356 points below the January high at 25,510. On the downside the 200-day line at 24,856, flattened and together with last year's high at 24,770, continues to act as support.
Above, the shorter averages form a cluster at the January high. The 20-, 50- and 100-day lines are at 25,289, 25,624 and 25,454. A clear signal remains to be seen: either a breakout above the 50-day line and the weekly high at 25,708, or a break of the 200-day line or last year's high. A break down would likely start a next leg with targets in the area of 23,600; upward, the year's high at 26,620, also the all-time high, is first the target.
Resistance
- 26,620
- 25,624
- 25,510
Support
- 25,054
- 24,856
- 24,770
What can move the DAX next: two central bank dates
Two central bank dates are coming up in the next few weeks. They are reasons to read the chart again, not a forecast of a particular reaction. The Fed time is Eastern Time, with central European time in brackets.
28 October, usually 2:00 p.m. ET (19:00 CET): Fed rate decision after the meeting of 27 and 28 October (FOMC calendar).
29 October, 14:15 CET: ECB rate decision after the meeting of 28 and 29 October (ECB calendar).
For the euro area, the ECB sets interest rates. What is at stake at the meeting is explained in our article on the ECB rate decision; the US side is covered by the Fed rate decision and the US inflation data.
DAX forecast for the coming weeks on the weekly chart: momentum of the correction tires at last year's high
 Click to enlarge
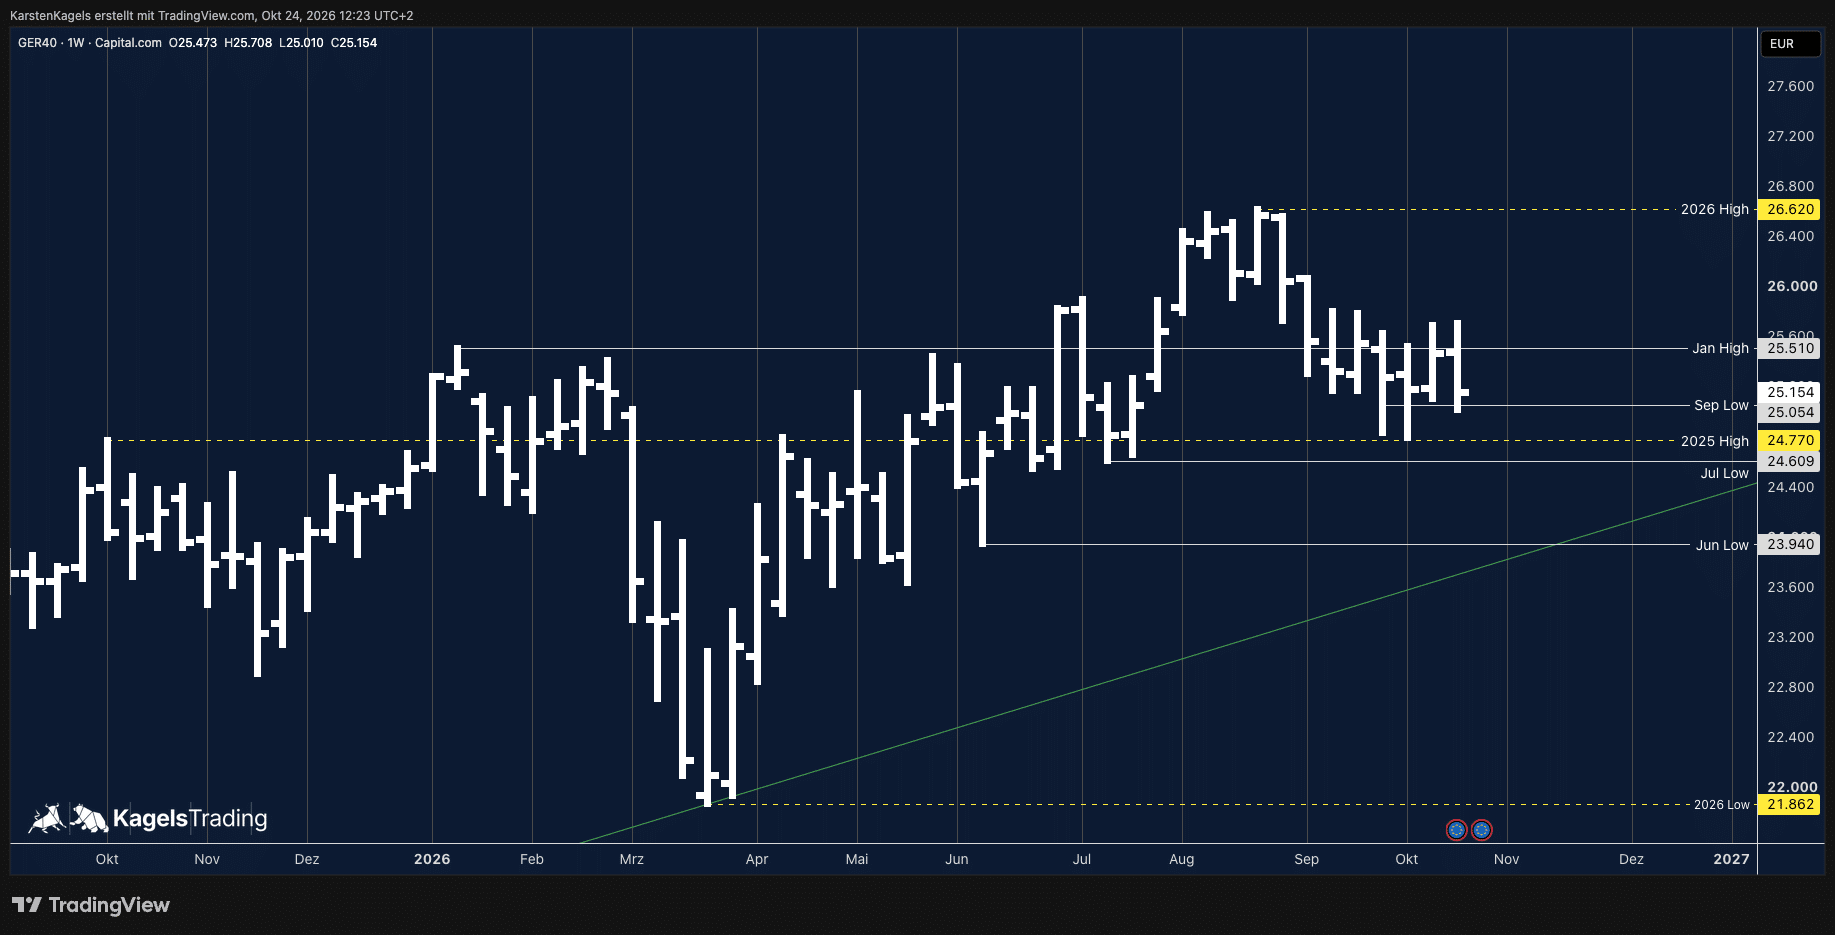
The momentum of the correction from the all-time high is tiring. From the year's high at 26,620, also the all-time high, the DAX has come back about 1,500 points, and at last year's high at 24,770 it has found support so far. The 2026 low from March is at 21,862.
The September low at 25,054 stays an interesting level on the weekly chart. The week opened at 25,473, rose to 25,708, fell to 25,010 and closed at 25,154. At the low it found support at the September low, and the close is above it.
That could lead to a continuation of the sideways tendency. As long as the round 25,000 mark stays in view psychologically and last year's high holds, the sideways phase remains. A recovery back above the January high at 25,510 would amount to a kind of reversal pattern. Closes above 25,700 at the weekly close would let a next test of the all-time high at 26,620 be expected.
Below the market two more supports are marked: the July and the June low. The July low is at 24,609, the June low at 23,940. Lower follow the green long-term uptrend line and the 2026 low at 21,862. For next week the focus is on the 25,000 mark and last year's high at 24,770. If this zone holds, the sideways tendency can continue; a break below it would send the DAX toward the areas around 24,800 and 24,700. This reading is an editorial guideline; the price levels come from Karsten's charts.
Resistance
- 26,620
- 25,510
Support
- 25,054
- 24,770
- 24,609
- 23,940
- 21,862
Three scenarios: which level decides
The last completed trading day decides which path applies. Exactly one applies at any time. After the weekly close at 25,154, it is the wait path. The price levels come from Karsten's charts; the closing condition is an editorial guideline. They are reference levels, not order rules.
Bullish: a close above the January high
Applies as long as the last close is above the January high at 25,510. That is not the case now: the weekly close at 25,154 is 356 points below it. A close above it supports the recovery from last year's high and would amount to a kind of reversal pattern. The next level above is the 50-day line at 25,624. Closes above 25,700 at the weekly close would let a next test of the all-time high at 26,620 be expected.
Wait: a close between 24,770 and 25,510
Applies as long as the last close is between the two levels, the levels themselves included. That is the case now: the weekly close at 25,154 is 356 points below the January high and 384 points above last year's high. In this situation neither side has decided. A close just below the 200-day line but above 24,770 weakens the picture but does not change the path. No setup is also a result.
Bearish: a close below last year's high
Applies as long as the last close is below last year's high at 24,770. Then the DAX would also be below the 200-day line, and a next leg with targets in the area of 23,600 would likely begin. A decisive break without a big struggle around last year's high would likely signal stronger downward pressure. The next supports on the weekly chart are the July low at 24,609 and the June low at 23,940, below them the 2026 low at 21,862.
Resistance
- 26,620
- 25,624
Support
- 24,770
- 24,609
- 23,940
- 21,862
DAX forecast 2026 and for the year end: October bar undecided, monthly close pending
 Click to enlarge
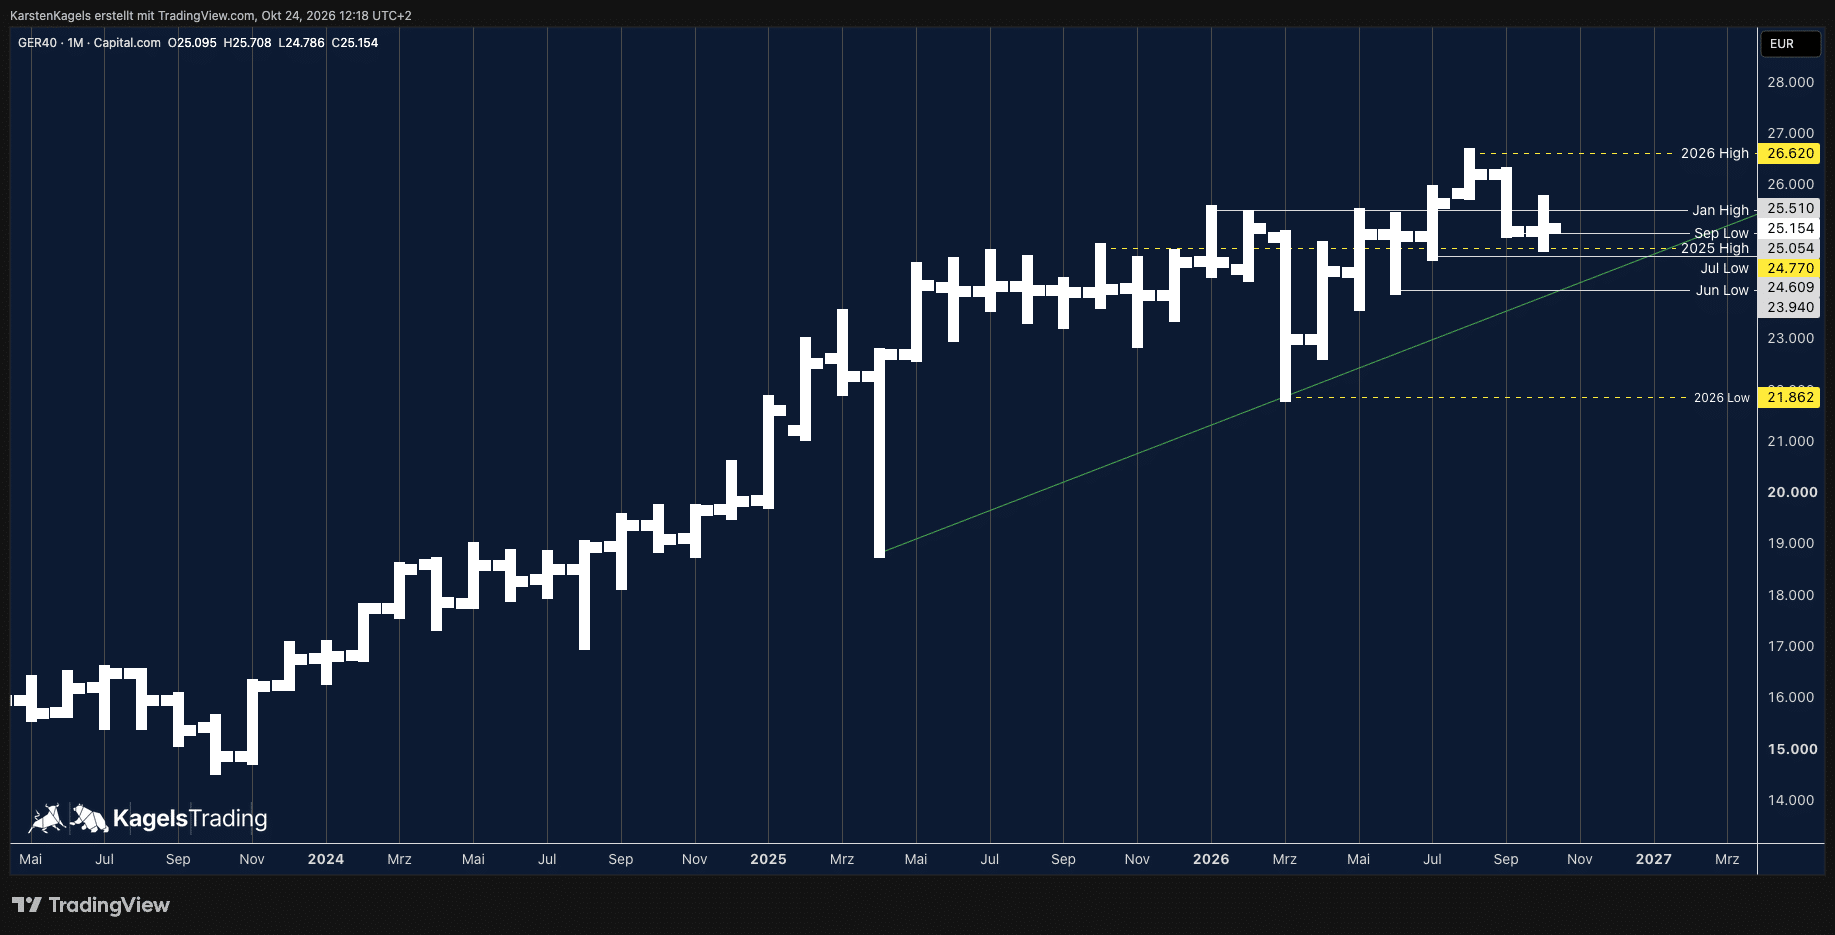
On the monthly chart the January high is the significant level. The price is between the January high and last year's high. October opened at 25,095, rose to 25,708, fell to 24,786 and stands at 25,154. The bar looks relatively undecided, which could point to a possible stabilization after the correction from the all-time high. For a clear statement the monthly closing price remains to be seen.
Prices above the January high keep the friendly outlook alive. Until the monthly close on 30 October, the January high at 25,510 remains the level at which the direction is decided. If the DAX holds above it, the all-time high at 26,620 is the next hurdle. If it falls below, last year's high at 24,770, the July low at 24,609 and the June low at 23,940 come into view.
The green long-term uptrend line lies below the market. It runs from the low in April 2025 through the 2026 low in March. Should the DAX fall below 24,770, a next leg with targets in the area of 23,600 would likely begin.
Resistance
- 26,620
- 25,510
Support
- 24,770
- 24,609
- 23,940
- 21,862
DAX forecast long term: the uptrend on the 3-month chart
 Click to enlarge
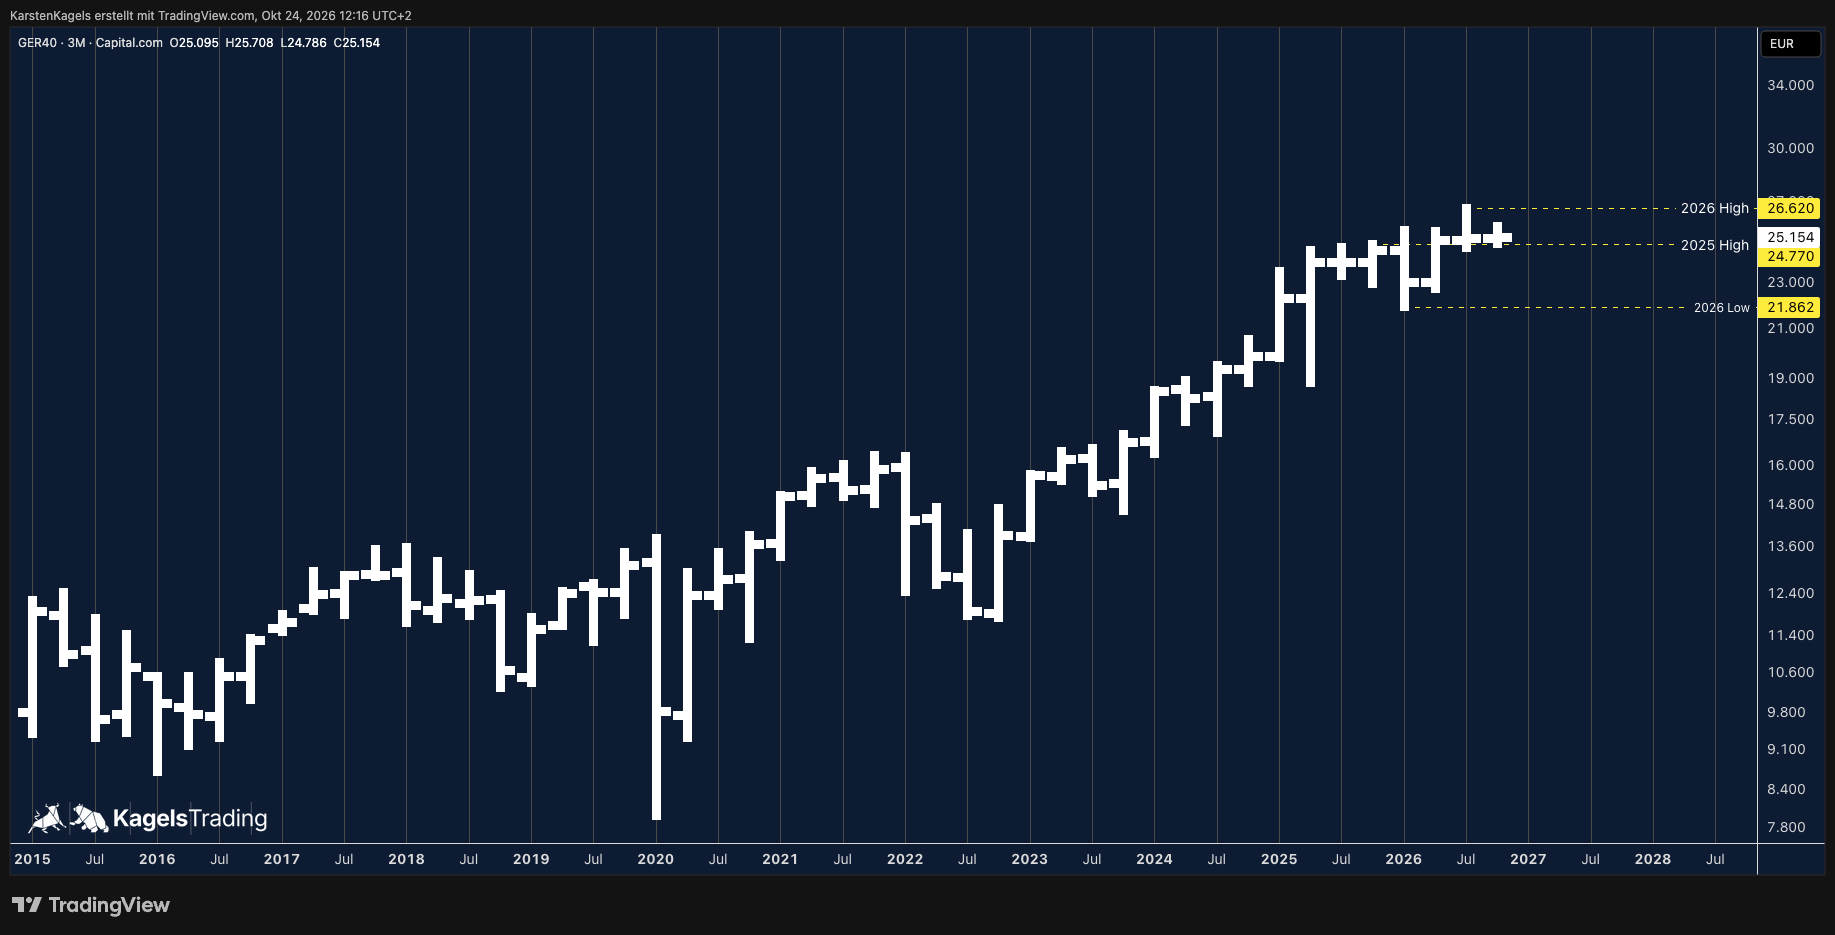
The logarithmic 3-month chart shows the long-term uptrend in the DAX. Each bar is one quarter. The logarithmic scale shows percentage moves at the same size, whether the index stands at 8,000 or at 25,000 points.
The uptrend structure is fundamentally intact in the long term. The DAX has come back about 1,500 points from the all-time high at 26,620 and fell to 21,862 in March. On Friday it closed at 25,154, above last year's high at 24,770 but below the all-time high. The focus is on last year's high as support.
The 3-month chart gives no target level for 2027. The level from which the DAX starts the new year is decided by the year's close in 2026. The benchmark is last year's high at 24,770.
For 2028, too, the long-term trend remains the guide. After the slumps of 2020 and 2022, new highs followed on the 3-month chart; over the whole history since 2015 it shows a long-term upward development. A target level for 2028 cannot be read from it.
There is no reliable point forecast for 2030 or 2050. The 3-month chart describes a direction, not a target price. Anyone planning that far ahead thinks in decades, not in price levels; numbers for 2050 would be guesswork.
Resistance
- 26,620
Support
- 24,770
- 21,862
How this forecast is made
The charts are my own and show the DAX CFD from Capital.com, from the 4-hour to the 3-month chart. The 4-hour and daily charts give the levels for the next trading days, the weekly and monthly charts put them in context, and the 3-month chart shows the long-term trend. Every version carries the date and time of its charts. How such levels work is explained in our guide to support and resistance. The charts were made with TradingView, and this page follows our editorial policy.
The DAX rarely moves on its own. Where the US indices stand is shown in the Dow Jones forecast, the S&P 500 forecast and the Nasdaq forecast, each built on the same chart method.
Conclusion: the DAX holds above the September low, last year’s high in focus
As an active trader since 1980, I see the correction from the all-time high losing momentum. Below, last year’s high at 24,770 has held so far, together with the 200-day line and the September low at 25,054. Above, after the weekly close at 25,154, the January high at 25,510 and the 50-day line at 25,624 are the resistance.
My assessment for the coming days: at the start of the week it remains to be seen whether the recovery tendency from the 4-hour chart prevails. The round 25,000 mark and last year’s high stay in focus, and prices above the January high would amount to a kind of reversal pattern. In the long term the 3-month chart still shows an uptrend.
Frequently asked questions
Will the DAX keep rising?
In the long term the 3-month chart shows an uptrend; in the short term the correction from the all-time high has lost momentum. In the week to 23 October 2026 the DAX closed at 25,154, above the September low at 25,054. A recovery above the January high at 25,510 would amount to a kind of reversal pattern; with closes above 25,700 at the weekly close, a next test of the all-time high at 26,620 would be expected.
How will the DAX move in the next few days?
That is decided by the position between last year’s high and the January high. The DAX ended the week at 25,154, between the January high at 25,510 and last year’s high at 24,770. The round 25,000 mark stays in focus; in case of a break below it, the areas around 24,800 and 24,700 are the first support. A recovery only shows with a breakout above the 50-day line at 25,624 (daily chart of 24 October 2026, 12:25 CEST, weekly close 25,154).
What is the DAX forecast for 2026?
At the weekly close on 23 October 2026 the DAX stood at 25,154, about 1,500 points below the all-time high at 26,620 and above last year’s high at 24,770. It reached the 2026 low at 21,862 in March. If the DAX falls below last year’s high, a next leg with targets in the area of 23,600 would likely begin.
Where will the DAX be in five or ten years?
There is no reliable point forecast for that. The logarithmic 3-month chart shows a long-term uptrend; after the slumps of 2020 and 2022, new highs followed later. It describes a direction, not a target price.
Please note
The price levels and chart observations come from Karsten Kagels; the closing conditions of the paths are an editorial guideline. Both describe possible price developments and are not a certainty. This is market analysis, not investment advice. Keep your position sizes in line with your own risk management.
This forecast is translated from the German edition on kagels-trading.de.
How our forecasts are made and reviewed: How we work.