
Fibonacci Extension: Levels, How to Draw It and Calculator


Contents
- Fibonacci extension in 30 seconds
- What is a Fibonacci extension?
- Fibonacci extension levels
- How to calculate Fibonacci extension levels
- Fibonacci extension calculator
- How to draw a Fibonacci extension in TradingView
- Three real examples: two targets reached, one swing that failed
- How I trade with extension targets
- Fibonacci extension vs retracement
- Pros and cons of Fibonacci extensions
- Common Fibonacci extension mistakes
- How reliable are Fibonacci extension targets?
- Conclusion: plan the exit before the entry
- Frequently asked questions about Fibonacci extensions
- About the author
A Fibonacci extension projects possible price targets for the next leg of a trend. Where the Fibonacci retracement asks how deep a pullback goes, the extension asks how far the move after the pullback can run. Many traders use it to plan where they take profits.
I use the extension in my own trading to set targets, and I treat those targets as places, not as promises. This guide explains the three-point tool, why it gives different prices than the levels beyond 100% you see in many tutorials, how to calculate and draw it in TradingView, and three real SPY examples, including one where no target was reached. This article follows our editorial policy.
Fibonacci extension in 30 seconds
- Three points: the start of a move (A), its end (B) and the end of the pullback (C). The targets are measured from C.
- The common targets: 61.8%, 100% and 161.8% of the A-B distance, added to C in an uptrend and subtracted from C in a downtrend.
- Not the same as levels beyond 100%: 127.2% or 161.8% of the swing itself is a two-point calculation and gives different prices.
- Targets, not signals: the extension tells you where to plan profit taking. It does not tell you when to enter or whether the target will be reached.
- No proven hit rate: I know of no solid test of extension targets. The swing you choose decides the result.
What is a Fibonacci extension?
A Fibonacci extension is a technical analysis tool that projects price targets from the end of a pullback using multiples of the prior move. You mark three points on the chart: A, where the move starts, B, where it ends, and C, where the pullback against that move ends. The tool takes the distance from A to B, multiplies it by Fibonacci ratios and adds the result to C.
TradingView calls this tool the Trend-Based Fib Extension. Its help page describes the same three points: the start of a move, the end of the move and the end of the retracement against it. The ratios come from the Fibonacci sequence, explained in my retracement guide linked above.
Depending on the depth of the pullback, a target can lie below, at or beyond B. A deep pullback puts C far from B, so the 61.8% target can end up below the old high. A shallow pullback puts every target beyond it. That is why I always check where the targets sit relative to B before I plan a trade.
Fibonacci extension levels
Three extension levels are enough for most trades: 61.8%, 100% and 161.8%. They are the levels TradingView names in its alert guide for profit targets, and they are the ones my calculator below shows. Other tools offer more levels; the table shows the common ones and what they mean.
| Level | Origin and calculation | How traders commonly read it |
|---|---|---|
| 61.8% | From C: C ± 0.618 × (A to B) | First target, may lie below the old high |
| 100% | From C: C ± 1 × (A to B) | The second leg as long as the first, often called a measured move |
| 161.8% | From C: C ± 1.618 × (A to B) | Extended target, the golden ratio |
| 127.2% | From A, two-point convention: A ± 1.272 × (A to B) | Level beyond the swing, the square root of 1.618 |
| 261.8% | From A, two-point convention: A ± 2.618 × (A to B) | Level beyond the swing, 1.618 squared, for very strong moves |
The descriptions in the table are common usage, not measured hit rates. “A to B” is the length of the swing, always a positive number. I know of no test that shows one level working better than the others. Pick a small, fixed set and use it the same way every time, so you can review your trades later.
Three-point versus two-point: why your targets differ
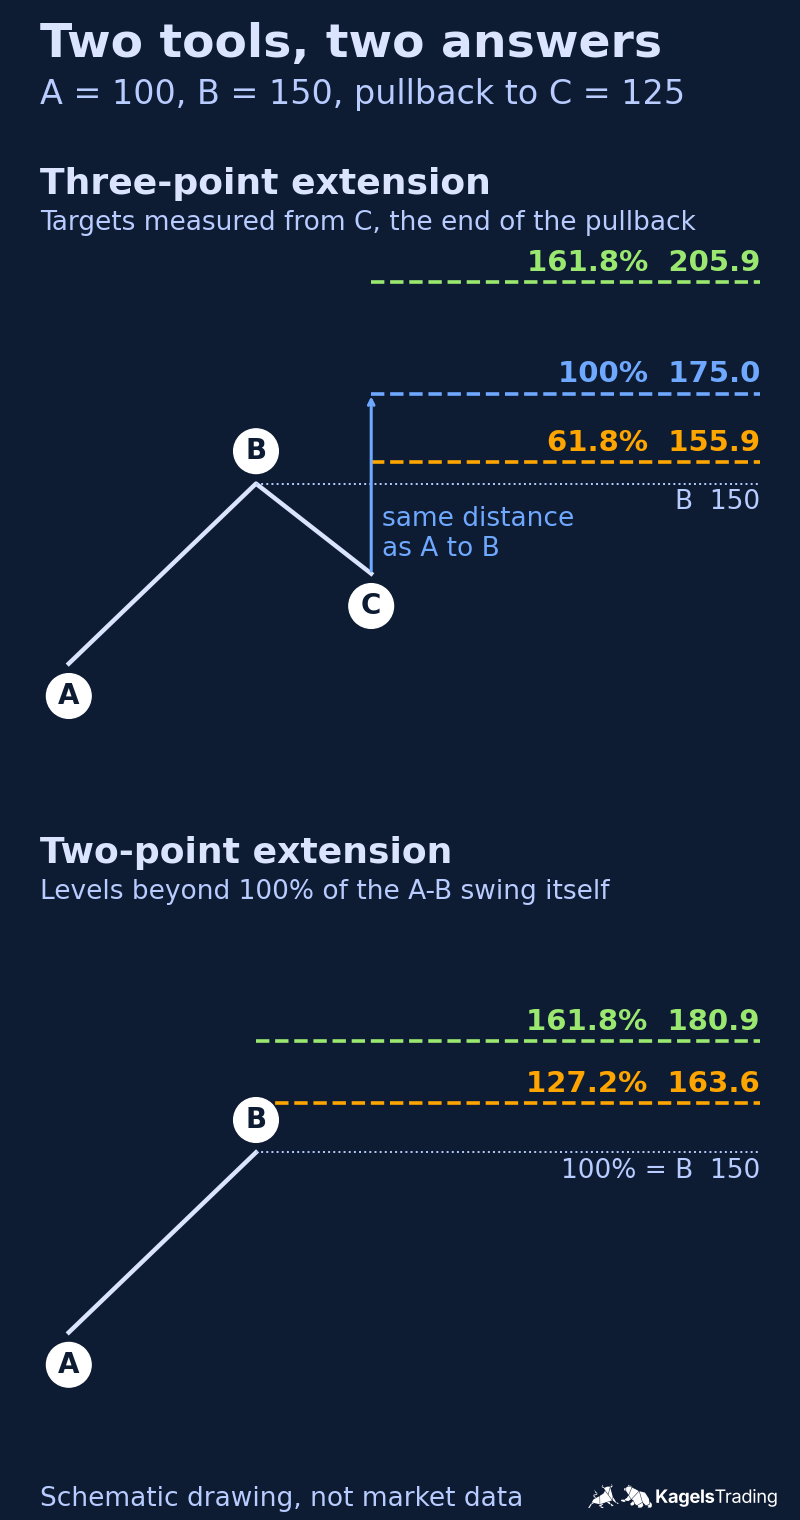
The most common confusion about Fibonacci extensions is that two different calculations share one name. The three-point extension measures from C, the end of the pullback. The two-point extension uses only A and B and extends the retracement tool beyond 100%, so its levels such as 127.2% and 161.8% are measured from the start of the swing. What separates the two is the origin, not the ratio: a three-point tool can also show 127.2% or 261.8%, measured from C.
A simple example shows the gap between them. Take a move from 100 to 150 and a pullback to 125. The three-point tool puts the 161.8% target at 125 + 50 × 1.618 = 205.9. The two-point tool puts its 161.8% level at 100 + 50 × 1.618 = 180.9. Same ratio, same swing, two prices about 25 points apart.
 Click to enlarge
Source: Kagels Trading, own drawing.
Neither version is wrong, but you have to know which one you use. If a tutorial draws three points but calculates the prices from A, it mixes the two methods. I use the three-point tool for targets because it accounts for the pullback, and everything below in this guide uses it.
How to calculate Fibonacci extension levels
You do not have to calculate the targets by hand, but the formula shows you what the tool does. It is the same arithmetic for every market. For an uptrend:
Extension target = C + (B − A) × ratio
In a downtrend the formula is mirrored. A is the swing high, B the swing low and C the high of the rebound. The target is C − (A − B) × ratio, so the targets lie below C.
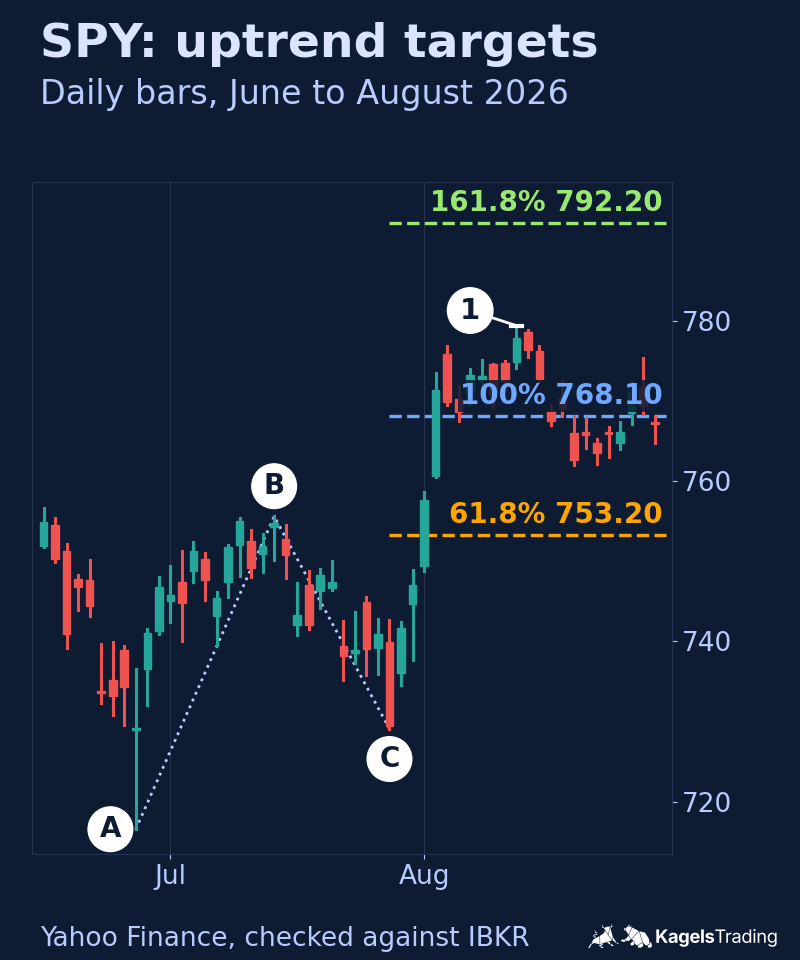
A real example from the SPY daily chart of the summer of 2026. SPY rose from a low of 716.58 on June 26 (A) to a high of 755.58 on July 15 (B), a distance of 39.00. The pullback ended at 729.10 on July 29 (C):
- 61.8% target: 729.10 + 39.00 × 0.618 = 753.20
- 100% target: 729.10 + 39.00 × 1 = 768.10
- 161.8% target: 729.10 + 39.00 × 1.618 = 792.20
The first target, 753.20, lies below B, because the pullback was deep. It gave back about 68% of the A-B move. With the 61.8% target below the old high, the first place to take profits came before the market had even made a new high. The examples section shows what SPY did next.
Fibonacci extension calculator
Enter the swing high, the swing low and point C, and the calculator gives you the three extension targets. Choose the trend first. In an uptrend the swing low is A, the swing high is B and C is the low of the pullback. In a downtrend the swing high is A, the swing low is B and C is the high of the rebound. The start values are the SPY swing from above; the calculator also shows the retracement levels of the same swing.
Updates as you type. Use a dot for decimals (1.20830). A comma only as a thousands separator together with a dot (4,643.00).
| Level | Price |
|---|---|
| Retracement levels | |
| 0% (swing high) | 755.58 |
| 23.6% | 746.38 |
| 38.2% | 740.68 |
| 50% | 736.08 |
| 61.8% | 731.48 |
| 78.6% | 724.93 |
| 100% (swing low) | 716.58 |
| Extension targets from C | |
| 61.8% | 753.20 |
| 100% | 768.10 |
| 161.8% | 792.20 |
Extension targets use the A-B range from point C (three-point extension), so a target can lie below, at or beyond the old high; a target below zero is not shown as a price. Retracement: uptrend = high − range × ratio, downtrend = low + range × ratio. Prices from 0.0001 to 1,000,000 with up to five decimals; results are rounded half away from zero to the decimals you enter, between two and five. Calculated levels, not a forecast.
The calculator only does the arithmetic; the hard part is choosing A, B and C. Use the same swing rule every time and check the result against your chart. Nothing you type is stored or sent anywhere; the calculation runs in your browser.
How to draw a Fibonacci extension in TradingView
In TradingView the three-point tool is called Trend-Based Fib Extension. You find it in the left toolbar, in the same group of Fibonacci tools as the Fib Retracement. If you are new to the platform, my TradingView guide explains the basics.
Step 1: click A, B and C
In an uptrend, click the swing low (A), then the swing high (B), then the low of the pullback (C). In a downtrend, click the swing high, the swing low and the high of the rebound. TradingView draws the target lines from the third point.
Step 2: choose your levels
Double-click the drawing to open the settings. Under Style you can switch levels on or off, enter your own values, fill the zones and extend the lines to the right. I keep 61.8%, 100% and 161.8% and switch off the rest.
Step 3: set an alert
Right-click the drawing and choose “Add alert on trend-based fib extension”. For target levels, TradingView recommends the condition “Greater Than” or “Crossing”. That way you do not have to watch the screen until the target is reached.
One setting matters on log charts. If your chart uses a logarithmic scale, TradingView offers the option “Fib levels based on log scale”, which calculates the levels differently. My calculator and the formulas in this guide use the linear calculation, so the two can differ on a log chart.
Three real examples: two targets reached, one swing that failed
Examples teach more when they include the misses. The three SPY swings below were found with the same swing rule: a low or high counts as a turn once a later daily high or low has moved at least 3% away from it. That rule confirms C only days after the fact, so these charts show where the targets lay in hindsight, not trades anyone could have planned on the day of C. They are selected to explain the tool, not a statistic.
Uptrend: two targets reached, the third one missed
The summer of 2026 is the example from the calculation above. After C on July 29, SPY reached the 61.8% target at 753.20 on August 3 and the 100% target at 768.10 on August 4. The rally topped at 779.37 on August 13. Through August 31, the 161.8% target at 792.20 was not reached.
 Click to enlarge
In hindsight the first two targets look useful, but not for a trade planned with my rules. The 3% rule confirmed C only on August 3, the day SPY traded through the first target. A buy stop above that day’s high of 758.58 would already have been above the 61.8% target, and SPY opened the next day at 760.63, above that entry, so my opening check would have skipped the trade. The 161.8% target was never needed: SPY fell back to 762.04 on August 20.
Downtrend: the same pattern on the way down
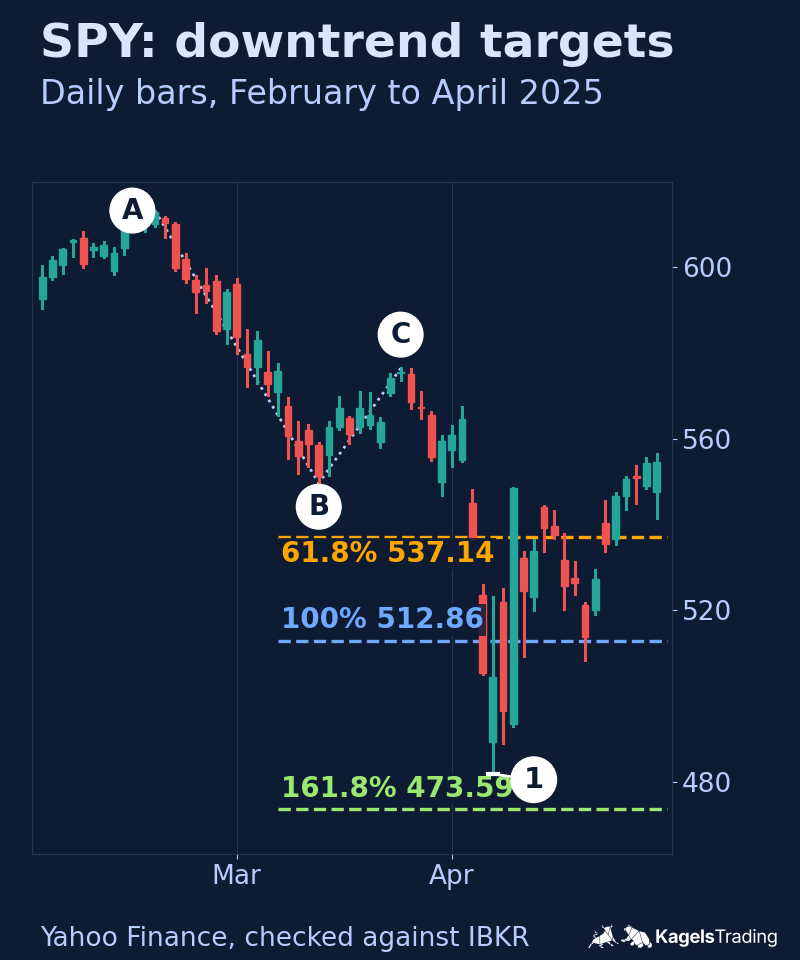
The extension works the same way in a falling market. SPY fell from 613.23 on February 19, 2025 (A) to 549.68 on March 13 (B) and rebounded to 576.41 on March 25 (C). The targets were 537.14 at 61.8%, already below B, 512.86 at 100% and 473.59 at 161.8%.
Two targets were reached within two days. SPY traded down to the 61.8% target on April 3 and through the 100% target on April 4. The 3% rule had confirmed C on March 28, before the first target traded. The sell-off ended at 481.80 on April 7, about eight points above the 161.8% target, which was not reached through April 30, the end of the chart. Two days later SPY rallied 10.5% and closed at 548.62, about one dollar below B.
 Click to enlarge
A swing that failed: no target reached
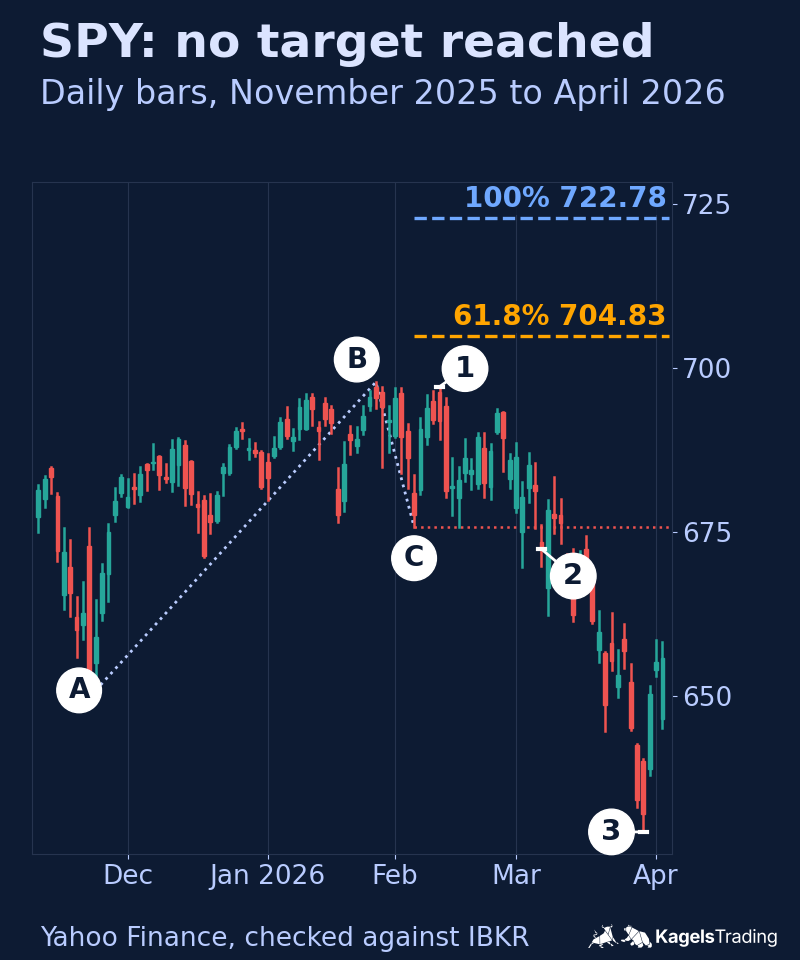
Not every A-B-C leads to a second leg. SPY rose from 650.85 on November 21, 2025 (A) to 697.84 on January 28, 2026 (B) and pulled back to 675.79 on February 5 (C). The first target was 704.83, above B.
The rebound stopped short of the old high. SPY reached 697.14 on February 11, 70 cents below B, and turned down. On March 6 it closed at 672.38, the first close below C, and fell to 629.28 by March 30. None of the targets was reached through April 2, 2026, the end of the chart; the 3% rule had confirmed C on February 10.
 Click to enlarge
This chart also shows why the stop does not belong exactly at C. On February 17 SPY traded at 675.78, one cent below C, and closed at 682.85. A stop right at C would have been hit while the structure was still intact. One example does not tell you the right distance, which depends on the market and your time frame. The next section explains where I put the stop instead.
How I trade with extension targets
For me, the extension answers one question only: where do I plan to take profits? The entry comes from somewhere else: a pullback into a support zone, a reaction of the candles, a break of a trendline. The extension then gives me the targets for that trade.
- Wait for C to be confirmed: C is only the end of the pullback when price has turned and a signal bar has closed away from it. That is a judgment, not a fixed formula. Before that, the tool moves with every new low. I use the close of the signal bar, not an intraday touch.
- Define the entry after the close: for a long, a buy stop above the signal bar’s high; for a short, a sell stop below its low; valid for the next session only. If the market opens beyond my invalidation or already beyond my entry, I skip the trade.
- Check the targets against the entry: before the order goes in, the first target has to lie beyond the planned entry and far enough away to justify the risk. If the market has already traded through it, there is no trade on this swing.
- Stop beyond C, with room: the protective stop goes a little below the low of C in an uptrend and a little above the high of C in a downtrend, not exactly at the level. It can be hit during the day even if the bar closes back on the right side of C; the close rule below does not undo a filled stop.
- First target before the old high: if the 61.8% target lies below B, I take the first profits there. The old high itself is a level where sellers may appear.
- Scale out: I take part of the position at the first target, more at the 100% target, and let a small rest run with a trailing stop. I do not wait for the 161.8% target with the whole position.
- Cancel the plan when C breaks: a close beyond C means the swing has failed. The targets are no longer valid, whatever the chart looked like before.
A target is not a guaranteed fill. A sell limit order exactly at the target may not be executed when the daily high only touches it. In a fast market, price can also gap through a target overnight; a limit order may then execute at a better price, and a triggered stop order becomes a market order whose price is not guaranteed. That is why I treat each target as a zone.
Every trade needs a planned loss in money before the order goes in. The formula is: planned loss = shares × stop distance × point value. For stocks the point value is 1. With 50 shares and a stop $8.00 away, the planned loss before costs is 50 × $8.00 × 1 = $400. A gap can make the real loss larger than planned, so keep each planned loss to a small, fixed share of your account.
Fibonacci extension vs retracement
Retracement and extension use the same ratios for two different jobs. The retracement looks back into the pullback and marks possible entry zones. The extension looks forward from the end of the pullback and marks possible targets. Together they give you a frame for entry and exit.
| Retracement | Extension | |
|---|---|---|
| Question | How deep does the pullback go? | How far can the next leg run? |
| Points | Two: swing low and swing high | Three: A, B and C |
| Typical levels | 38.2%, 50%, 61.8% | 61.8%, 100%, 161.8% |
| Use | Entry zones, stop at the structure | Profit targets |
| TradingView tool | Fib Retracement | Trend-Based Fib Extension |
Pros and cons of Fibonacci extensions
The extension is useful for planning, but it has clear limits. Here is my honest summary from daily practice:
| Pros | Cons |
|---|---|
| Targets before the trade: you know in advance where you plan to take profits | Subjective points: two traders choose different A, B and C and get different targets |
| Adapts to the pullback: a deep pullback gives closer targets, a shallow one wider targets | No proven edge: I know of no test that shows extension targets are hit more often than other prices |
| Works with any market and time frame without settings | C is only known later: the pullback can go deeper and move the whole projection |
| Easy to combine with support and resistance zones | Two methods, one name: three-point and two-point levels are often mixed up |
Common Fibonacci extension mistakes
The first mistake is mixing the two tools. A chart with three points whose prices are calculated from A instead of C does not show three-point targets. Decide which method you use and label it.
The second is drawing the tool before C is confirmed. As long as the pullback is still running, C keeps moving and so do all the targets. Wait until price has turned away from C and closed, then draw the extension.
The third is treating the last target as the plan. Many traders wait for 161.8% because it is the famous number. In two of the three examples above, the 161.8% target was not reached, and in the third no target was reached at all. Plan your first profits at the closer targets.
The fourth is ignoring the levels on the chart. An extension target that sits just below an old resistance zone is a different target than one in empty space. I check every target against the levels from my guide to support and resistance and against the pivot points of the day, explained in my guide to pivot points.
How reliable are Fibonacci extension targets?
I know of no solid evidence that extension targets are reached more often than other prices. A widely cited test by the American trader Adam Grimes measured retracements in stocks, futures and currencies over ten years and found no clustering at Fibonacci ratios (Testing Fibonaccis, Adam Grimes). He also measured the move after the pullback, but the study does not test a hit rate of extension targets like the ones in this guide, and I have not run a test large enough to publish a hit rate.
What I can show is how much the result depends on the swing rule. I searched the same two years of SPY daily data with three rules. With a 2% rule, the swing from November 2025 has its B on December 11 (689.25) and its C on December 17 (671.20); the 61.8% target at 694.93 was reached on January 9, 2026. With the 3% rule used above, the same swing ends at the January 28 high, and no target was reached. The 5% rule changes another part of the chart: the summer swing of 2026 disappears completely, and the targets of the larger swing from March 30 were not reached through September 30.
Same chart, three rules, three answers. That does not make the extension useless, but it means any hit rate you read says as much about the swing definition as about the tool. Fix your rule before you draw, write it down and review your trades with it.
Conclusion: plan the exit before the entry
The Fibonacci extension is a planning tool for targets. It turns three points on the chart into a few prices where you decide in advance what to do with your position. Used with the three-point method, a stop beyond C and partial profits at the first targets, it gives your trade a clear exit plan.
What it is not: a forecast. The examples show two targets reached in an uptrend, two in a downtrend, and a swing where none was reached. Treat every target as a zone, check it against the levels on the chart, and cancel the plan when C breaks. If you want to learn how to find the entry first, start with my guide to the Fibonacci retracement and my guide to swing trading.
Frequently asked questions about Fibonacci extensions
What is a Fibonacci extension?
A Fibonacci extension is a tool that projects price targets from the end of a pullback using multiples of the prior move. You mark the start of the move (A), its end (B) and the end of the pullback (C). The targets are typically at 61.8%, 100% and 161.8% of the A-B distance, measured from C.
How do you draw a Fibonacci extension?
In TradingView, choose the Trend-Based Fib Extension and click three points. In an uptrend: the swing low, the swing high and the low of the pullback. In a downtrend: the swing high, the swing low and the high of the rebound. The target lines appear from the third point.
How do you calculate Fibonacci extension levels?
In an uptrend: target = C + (B − A) × ratio. With A at 716.58, B at 755.58 and C at 729.10, the 100% target is 729.10 + 39.00 = 768.10. In a downtrend, subtract the distance from C instead. The calculator above does it for you.
What is the 61.8% Fibonacci level?
In a retracement, 61.8% is the golden level inside the pullback; in an extension, it is the first target. The ratio 0.618 is the inverse of the golden ratio of about 1.618. As an extension target, 61.8% of the A-B distance is added to C, so after a deep pullback it can lie below the old high.
What are the 7 Fibonacci levels?
There is no official list of seven levels. A common set for the retracement is 23.6%, 38.2%, 50%, 61.8% and 78.6%; for the extension, 61.8%, 100% and 161.8%, with 127.2% and 261.8% as two-point levels. Charting platforms ship different defaults, and you can add your own.
What are the strongest Fibonacci levels?
I know of no test that shows one Fibonacci level is stronger than the others. Traders most often watch 61.8% for retracements and 161.8% for extensions, because both come from the golden ratio. A level gets more weight when it meets an old support or resistance zone.
What is the difference between Fibonacci retracement and extension?
The retracement measures how far a pullback goes and gives you entry zones. The extension projects how far the next leg can run and gives you targets. The retracement needs two points, the three-point extension needs three.
What is the difference between a Fibonacci extension and a projection?
Many traders use projection as another name for the three-point extension. Others call the three-point tool an expansion and keep the word extension for levels beyond 100% of a two-point swing. Check which calculation a tool or tutorial uses before you compare its levels: what matters is whether the prices are measured from A or from C.
This article was written by Karsten Kagels, a discretionary price action trader. The chart examples are historical and built from Yahoo Finance data, with the key prices checked against Interactive Brokers daily bars; they are selected to explain the tool, are not trades I executed and are not a statistic. This is educational content, not investment advice. Trading can lose you money, costs and slippage reduce results, and leverage in forex or futures magnifies losses as well as gains.
A German edition of this article is available on kagels-trading.de.
More Chart Techniques guides
- Draw key levels
Support and Resistance: How to Draw and Use Key Levels
Where useful levels come from, how to draw zones with a stated rule and how to turn a level into a trade plan.
- Read price action
Price Action Trading: How to Read Charts Without Indicators
Market structure, key zones and three bar patterns, with a core setup and a real SPY example where the signal failed.
- Read candlestick charts
How to Read Candlestick Charts: Body, Wicks and Context
Open, high, low and close in one candle, body and wicks, two real Gold candles read step by step and how often patterns really occur.
- Know candlestick patterns
Candlestick Patterns: 10 to Know, Tested on Real Data
Ten patterns with rules and a cheat sheet, counted on DAX, S&P 500, EUR/USD and Gold since 2014: most are rare, none is a signal on its own.
- Trade breakouts
Breakout Trading Strategy: Entries and False Breakouts
How often breakouts fell back into the range in our count of 1,472, and how to plan entry, stop and position size.
- Draw and trade trendlines
Trendline Trading: How to Draw Trendlines and Trade Them
How to draw trendlines with a fixed rule, four strategies for bounces, breaks and retests, and a real SPY line break without a lasting reversal.
- Use Fibonacci levels
Fibonacci Retracement Levels: How to Draw and Trade Them
How to calculate and draw retracement levels, trade pullbacks with confluence and a stop at the structure, and what a ten-year test says about the levels.
- Trade gaps
Gap Trading Strategy: How to Trade Gaps and When Gaps Fill
Opening and full gaps, the four classic gap types, how often SPY gaps filled in our count since 2001, and plans for gap fill and gap and go.
- Calculate pivot points
Pivot Points: Formulas, Types and How to Trade Them
Formulas for standard, Fibonacci, Woodie, Camarilla and DeMark pivots, a free calculator, which session counts and a real SPY day.
- Swing trade
Swing Trading: 4 Strategies, Risk and Real Examples
Four swing trading strategies on the daily chart, position size, gap risk and US rules, with two hypothetical SPY pullbacks: one hit its target, one was stopped out.
- Identify market stages
Stage Analysis: Stan Weinstein's Four Market Stages
Stan Weinstein's four stages on the weekly chart, a Stage 2 checklist and two TSMC breakouts: one ran for a year, one gapped through its stop.
- Read Wyckoff ranges
Wyckoff Method: Accumulation, Distribution and Springs
Accumulation and distribution with phases A to E, springs and upthrusts as optional tests, and two real TSMC ranges read with and without hindsight.
- Trade Darvas boxes
Darvas Box Strategy: Rules, Entries and Stop Losses
The box rules step by step, when the edges become known, where the stop goes, and a mechanical test on TSMC in 2024 with two honest results.
- Count Elliott waves
Elliott Wave Theory: Rules, Patterns and Fibonacci
The five-wave pattern, three hard rules, zigzags, flats and triangles, Fibonacci ratios and a real DAX count, from the first German translator of the standard work.
- Trade order blocks
Order Blocks: How to Spot, Draw and Trade the Zone
The three conditions behind a valid order block, entry and stop at the zone, two SPY cases from 2026 and a 25-year count where a fixed rule lost money.
- Trade fair value gaps
Fair Value Gap (FVG): How to Spot, Trade and Test It
The three-candle rule, bullish, bearish and inverse FVG, two SPY cases from 2026 and a 25-year count of how often gaps were revisited and traded.
- Read liquidity sweeps
Liquidity Sweep: How to Spot It and Trade the Reversal
Sweep or run, buy-side and sell-side liquidity, internal and external targets, SPY reversal, continuation and failed-reversal examples and a 25-year count of a fixed sweep rule.
- Interpret volume
Volume Analysis in Trading: How to Read Volume Honestly
What volume counts in stocks, futures, forex and crypto, how to read it against its own average, and our SPY test of high-volume days since 2001.