
Stage Analysis: Stan Weinstein's Four Market Stages


Contents
- Stage Analysis in 30 seconds
- What is Stage Analysis?
- Stan Weinstein and his book
- The four stages of Stage Analysis
- Checklist for a Stage 2 breakout
- Example: one stock through all four stages
- Example 1: the breakout of January 2024
- Example 2: the breakout of January 2022 that failed
- How to apply Stage Analysis each week
- Limits of Stage Analysis
- Conclusion
- Frequently asked questions about Stage Analysis
- About the author
Stocks rarely move in a straight line. They build a base, rise, run out of steam at the top and fall again. Stan Weinstein’s Stage Analysis turns this pattern into a set of rules: it sorts every chart into one of four stages and tells you in which stage to buy, to hold, to tighten your stop or to stay away.
This guide explains the four stages on the weekly chart and shows them on one real stock. You get a checklist for a good Stage 2 breakout, two hypothetical trades in TSMC shares (one that ran for a year and one that failed within five weeks) and the limits of the method. This article follows our editorial policy.
Stage Analysis in 30 seconds
- Origin: a method for stocks described by Stan Weinstein in his 1988 book Secrets for Profiting in Bull and Bear Markets.
- Four stages: Stage 1 base, Stage 2 advance, Stage 3 top, Stage 4 decline.
- Tools: a weekly chart, the 30-week moving average, volume and relative strength against the market. Relative strength here is a ratio, not the RSI indicator.
- When to buy: on a breakout into Stage 2, ideally when the market and the sector are also healthy.
- When to stay out: Stage 4. A stock below a falling 30-week average is not a bargain in this method.
- The catch: the stage is an interpretation. A base can fail, a top can turn into a pause, and a stop does not guarantee your exit price.
What is Stage Analysis?
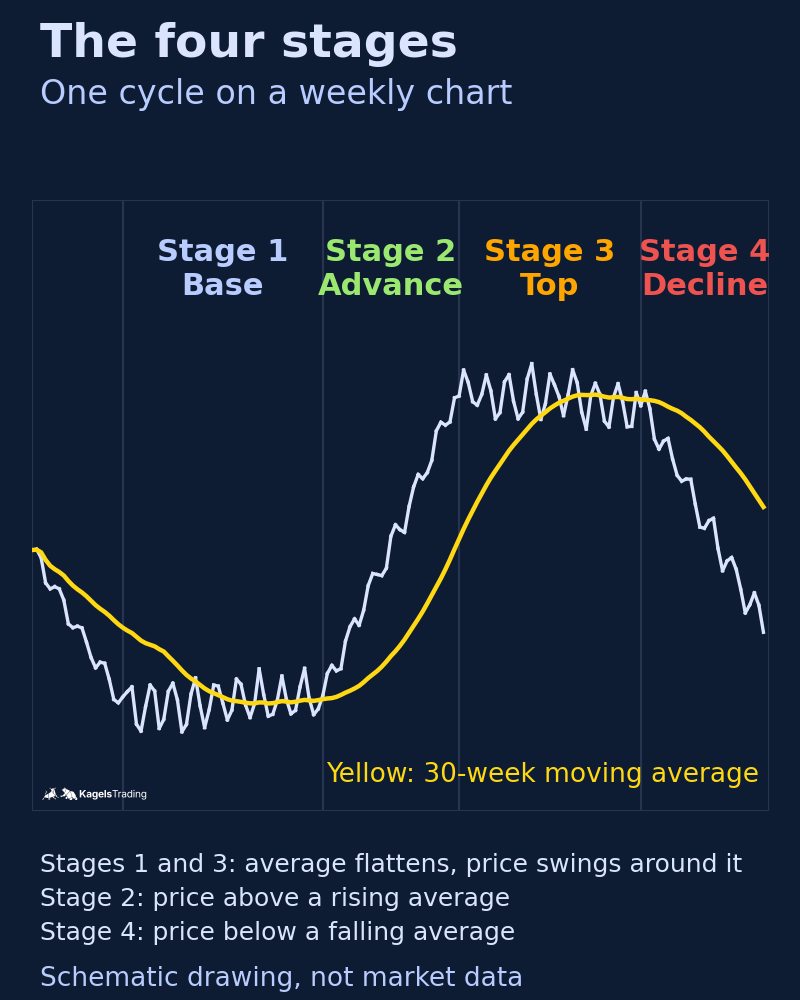
Stage Analysis is a trend-following method that divides the life cycle of a stock into four stages, judged on the weekly chart by the price relative to its 30-week moving average and by the slope of that average.
The idea is to own a stock only while it is in an uptrend. You do not try to buy the lowest price. You wait until a new uptrend has visibly started, buy the breakout into Stage 2 and sell when the trend shows signs of ending. The rest of the cycle, Stage 1 and Stage 3, is for watching, and Stage 4 is for avoiding (or, for experienced traders, for short selling).
Because the analysis runs on weekly charts, Stage Analysis belongs to position trading. One review per week, usually at the weekend, is enough to judge the stage of your stocks. This makes the method practical if you have a job, but it also means wide stops and holding periods of months. It is not a method for day trading, and it is slower than swing trading, which works on daily charts.
 Click to enlarge
Source: Kagels Trading, own drawing.
Stan Weinstein and his book
Stan Weinstein is an American technical analyst who published the newsletter The Professional Tape Reader from 1972 to 2000. In 1981 the Christian Science Monitor described it as a twice-monthly letter. From the late 1970s he was a frequent guest on the PBS programme Wall $treet Week, and in 1990 he founded Global Trend Alert, a research service for institutional clients.
His book “Stan Weinstein’s Secrets for Profiting in Bull and Bear Markets” first appeared in 1988 at Dow Jones-Irwin. Later paperback editions carry the McGraw-Hill imprint, and the book is still sold as a paperback, e-book and audiobook. It covers the four stages, stock selection, stop placement and short selling in Stage 4.
A note on our sources: we could not check the book’s text for this guide. The rules below follow published summaries, mainly Thomas Bulkowski (ThePatternSite), a book summary by Shortform and a 2008 user-group handout that cites the book’s pages. Where these sources only describe a modern practice and not Weinstein’s own rule, we say so. Websites that teach the method today, such as stageanalysis.net, are third parties and not run by Weinstein.
The four stages of Stage Analysis
Each stage has its own mix of price, moving average, volume and relative strength. The table is a summary; the sections after it explain what each stage means for you. Relative strength in this guide means the stock’s price divided by a market index such as the S&P 500. If the line rises, the stock does better than the market.
| Stage 1: base | Stage 2: advance | Stage 3: top | Stage 4: decline | |
|---|---|---|---|---|
| Price | moves sideways after a decline | higher highs and higher lows | moves sideways after an advance | lower highs and lower lows |
| 30-week average | stops falling, flattens | rises, price stays above it | flattens, price crosses it often | falls, price stays below it |
| Volume | often low, may pick up late | expands on the breakout | often heavy, without progress | can spike at the start |
| Relative strength | stops falling | rising | flattening or falling | falling |
| What to do | watch, set an alert | buy the breakout, hold | protect profits, tighten the stop | stay out of long positions |
| Main uncertainty | the base can break down | a breakout can fail | the top can be a pause | the decline can last for years |
Stage 1: the base
Stage 1 is the base: after a decline, the price stops making new lows and moves sideways around a flattening 30-week average. Sellers and buyers are roughly in balance. The base can last months or even years, so a stock in Stage 1 ties up capital without a trend to carry it.
Use Stage 1 to prepare, not to buy. Put the stock on a watchlist, mark the top of the base as a resistance zone and note whether the relative strength line stops falling. Volume that increases towards the end of the base is often read as a sign of growing interest. It is not proof that large investors are buying; the chart shows only price and volume, not who is behind them.
Stage 2: the advance
Stage 2 begins when the price breaks out above the top of the base and trades above a rising 30-week average. This is the only stage in which Weinstein’s method buys. Ideally the breakout comes with a clear increase in volume and a rising relative strength line.
You can enter on the breakout itself or on a pullback towards the breakout level. A pullback entry gives a closer stop but can miss the move, because strong stocks do not always come back. The summaries describe the first stop below the low of the last pullback before the breakout, and later a trailing stop below the 30-week average or below the latest correction low, which is only ever raised. Bulkowski adds that Weinstein placed stops below round numbers such as 50.00, because many orders cluster there.
Stage 3: the top
Stage 3 is the top: after an advance, the price stops making progress and the 30-week average flattens. The price swings above and below the average, often on heavy volume, and the relative strength line weakens. This is when many holders take profits.
Stage 3 is the hardest stage to read in real time. You often know only later whether it was a top or just a pause within Stage 2. The practical answer is not to guess but to tighten the stop: if the stock breaks down, you are out with most of the gain; if it breaks out again, you are still in.
Stage 4: the decline
Stage 4 begins when the price falls below the Stage 3 range and below a 30-week average that turns down. The stock now makes lower highs and lower lows. Declines can be fast at the start and then turn into a slow slide with falling volume.
In Stage 4 the rule is simple: no new long positions. A stock that looks cheap after a big drop can get much cheaper. Weinstein’s book also covers short selling in Stage 4, protected by a buy stop above resistance. Short selling has its own risks, including unlimited losses in theory, and is not covered in this guide. Only when a new Stage 1 base forms is the stock worth watching again.
Checklist for a Stage 2 breakout
A good Stage 2 candidate passes several checks, from the broad market down to the single stock. Summaries of the book describe this order as working from “the forest to the trees”: first the market, then the sector, then the stock. The checklist below follows that order. It improves your selection; it does not make a breakout safe.
- Market: is the main index, for example the S&P 500, above a rising 30-week average? In a Stage 4 market even good breakouts fail more often.
- Sector: is the stock’s industry group also in Stage 1 to Stage 2, not in Stage 4? A sector index or sector ETF shows this on the weekly chart.
- Base: has the stock built a sideways base after a decline, with a 30-week average that has stopped falling? A range that forms after a big advance may be a Stage 3 top instead.
- Breakout: has a completed weekly bar closed above the top of the base? A price above the base on Wednesday is not yet a weekly close.
- Volume: is breakout volume clearly higher than in the prior weeks? Many followers today ask for at least twice the average of the four prior weeks. That number is a modern rule of thumb from websites such as stageanalysis.net; we could not confirm it as Weinstein’s own wording.
- Relative strength: is the stock’s ratio to the index rising, or back above its own one-year average? Remember that this is not the RSI.
- Overhead resistance: is there little old trading activity just above the breakout? Old highs above the price are where earlier buyers may sell to get out at break-even. The sources give no fixed number of years to look back.
- Risk: where is the stop, how far away is it, and how many shares does that allow? With weekly charts, a stop distance of 10 % or more is not unusual, so position size matters more than usual.
Example: one stock through all four stages
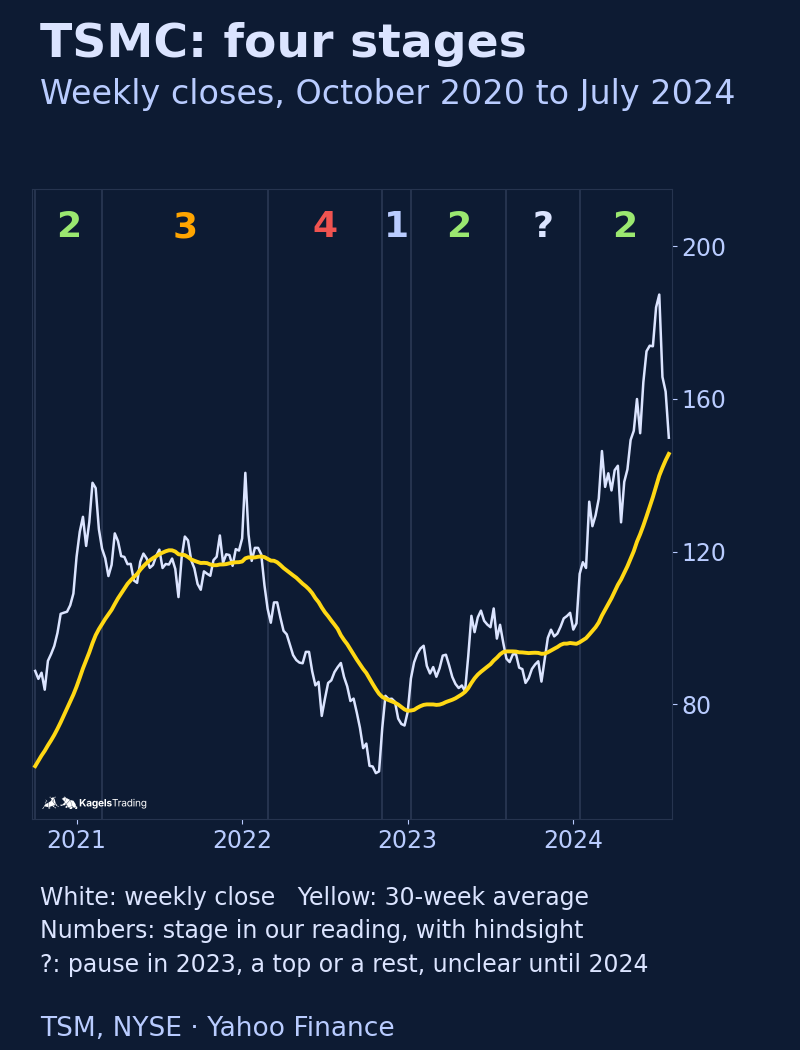
TSMC, the world’s largest contract chip maker, went through a full cycle between 2020 and 2024. We use its American depositary shares (ticker TSM, NYSE) because they trade in US dollars with high volume. It is an example to show the stages, not a recommendation, and the same reading works for stocks on any exchange with reliable volume data.
 Click to enlarge
The labels in the chart are our reading with hindsight. After the advance of 2020, TSM topped out in February 2021 at $142.20 and moved sideways for a year around a flat average (Stage 3). In February 2022 it fell below that range, and a Stage 4 decline took it to $59.43 in October 2022. A short base followed, and from January 2023 the average rose again (Stage 2). From August 2023 the stock paused for five months, and at that time nobody could know whether this was a new top or a rest in the uptrend.
Example 1: the breakout of January 2024
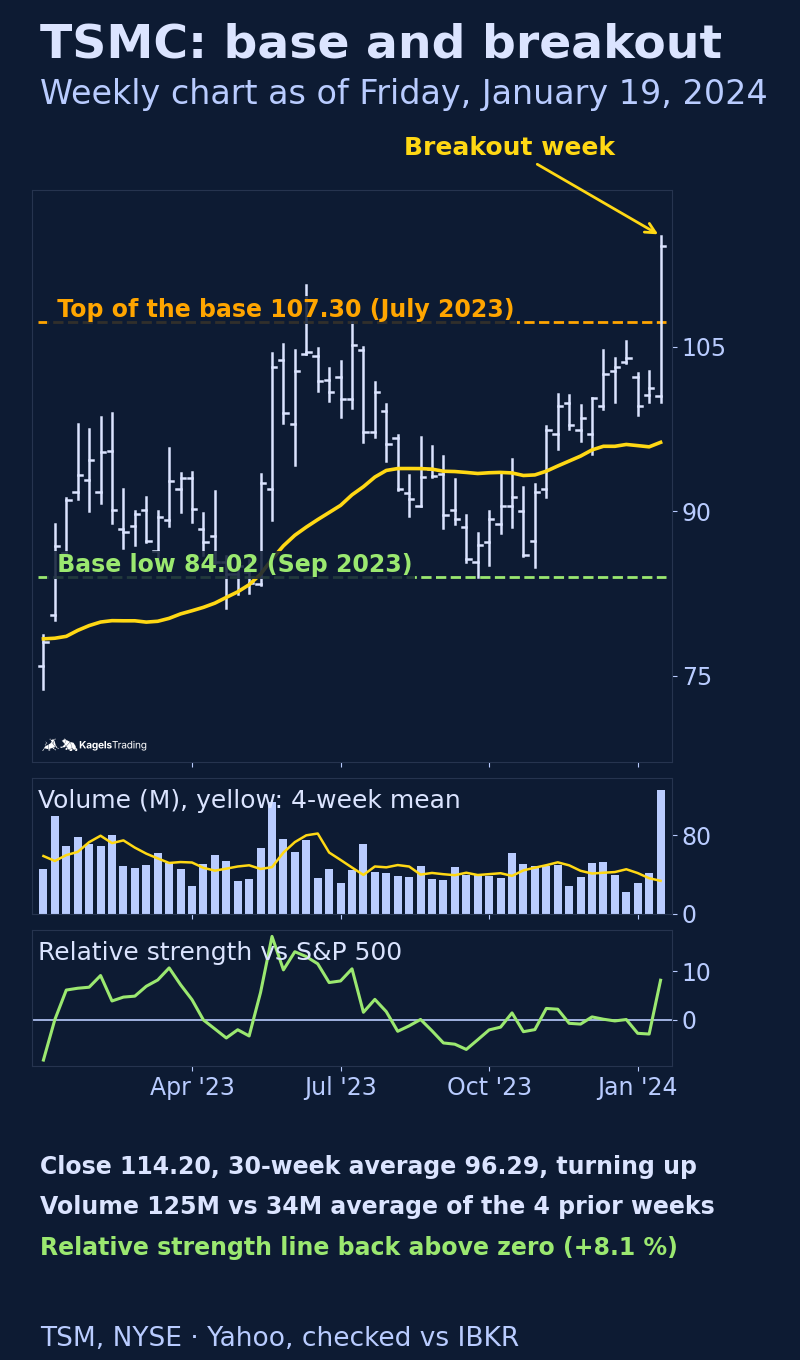
On Friday, January 19, 2024, TSM closed at $114.20, above the top of its six-month range at $107.30, the high of July 2023. The chart shows only what was known at that close. This was not a breakout from a classic Stage 1 base after a decline, but a continuation breakout: the stock had been rising since the end of 2022 and broke out of a pause in a Stage 2 that was already under way.
 Click to enlarge
Source: Data from Yahoo Finance and IBKR, chart by Kagels Trading.
Most points of the checklist were met at that weekly close. The S&P 500 closed the week at 4,839.81, a record weekly close, above a rising 30-week average. The Philadelphia Semiconductor Index (SOX) also closed at a new high above its rising average. TSM’s 30-week average had turned up ($96.29 after $95.88), and the relative strength line rose above its one-year average. Weekly volume was 125.4 million shares, 3.7 times the mean of the four prior weeks and 3.1 times the mean of the ten prior weeks.
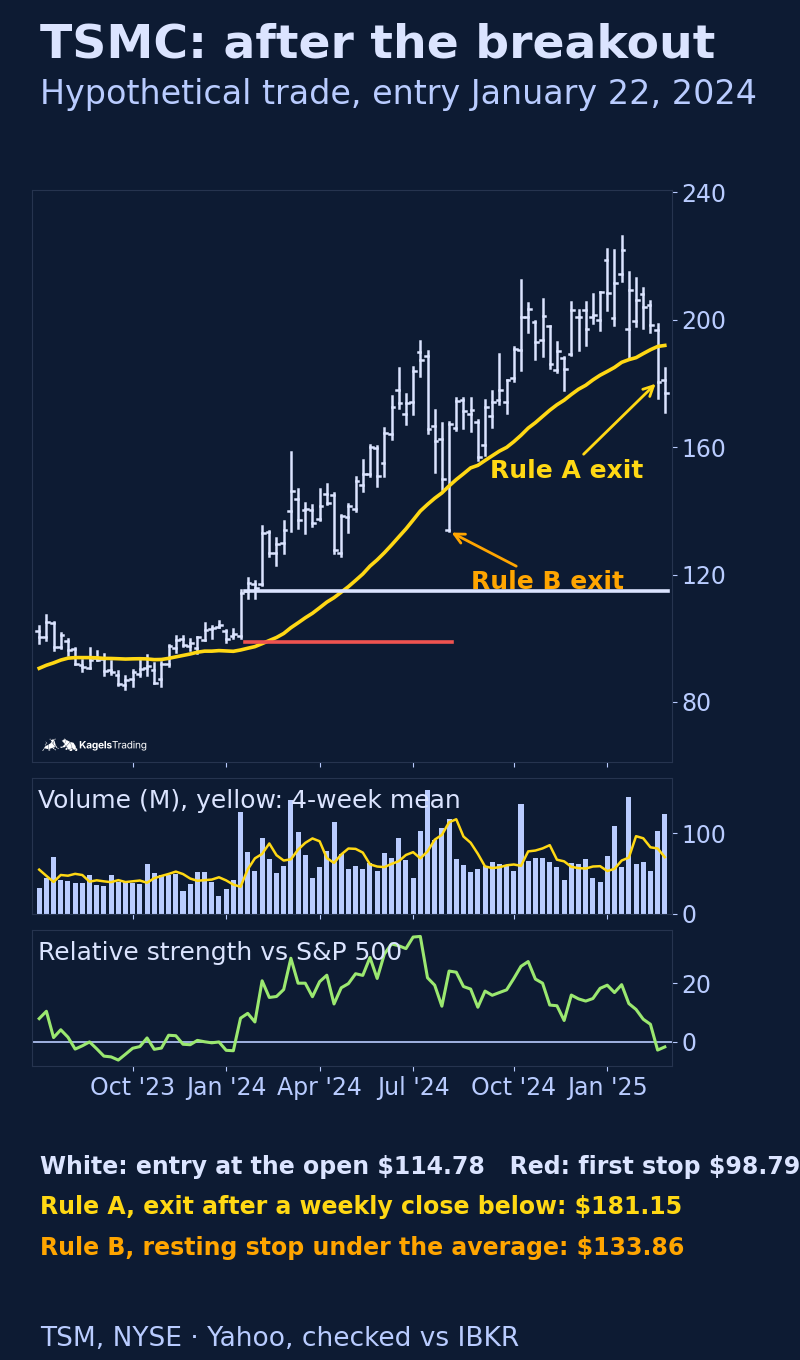
One detail matters: the breakout came from a gap after quarterly results. TSMC reported its fourth-quarter numbers on January 18, 2024, and the stock opened that day at $111.20 after a close of $102.95. Someone with a buy stop just above $107.30 would have been filled near the gap open, not at $107.30. Our hypothetical trade therefore uses the open of the following week, $114.78 on January 22, after the weekly close had confirmed the breakout.
The first stop goes below the last pullback before the breakout. That low was $98.80 on January 5, 2024, so the hypothetical stop is $98.79. The risk per share is $15.99, or 13.9 % of the entry price. If you risk 1 % of a $50,000 account, that is $500 and allows 31 shares (a position of about $3,558). These numbers are an assumption to show the calculation, not a rule.
 Click to enlarge
Source: Data from Yahoo Finance and IBKR, chart by Kagels Trading.
What happened next depends heavily on the exit rule, and we show both rules on purpose. The stop at $98.79 was never reached. With Rule A (sell at the next weekly open after a weekly close below the 30-week average), the trade stayed open until the close of February 28, 2025 and exited on March 3, 2025 at $181.15: a gain of $66.37 per share, about 4.2 times the initial risk. With Rule B (a resting stop one cent below the average, raised every week), a sharp market sell-off on August 5, 2024 opened the stock at $133.86, below the stop at $145.61. The gain was then $19.08 per share, about 1.2 times the risk.
Neither rule is “right”; they answer different questions. Rule A ignores short drops inside a week and accepts a larger give-back. Rule B reacts faster but can be gapped and shaken out. Decide on your rule before the trade, and do not pick the one that looks best in an old chart.
Example 2: the breakout of January 2022 that failed
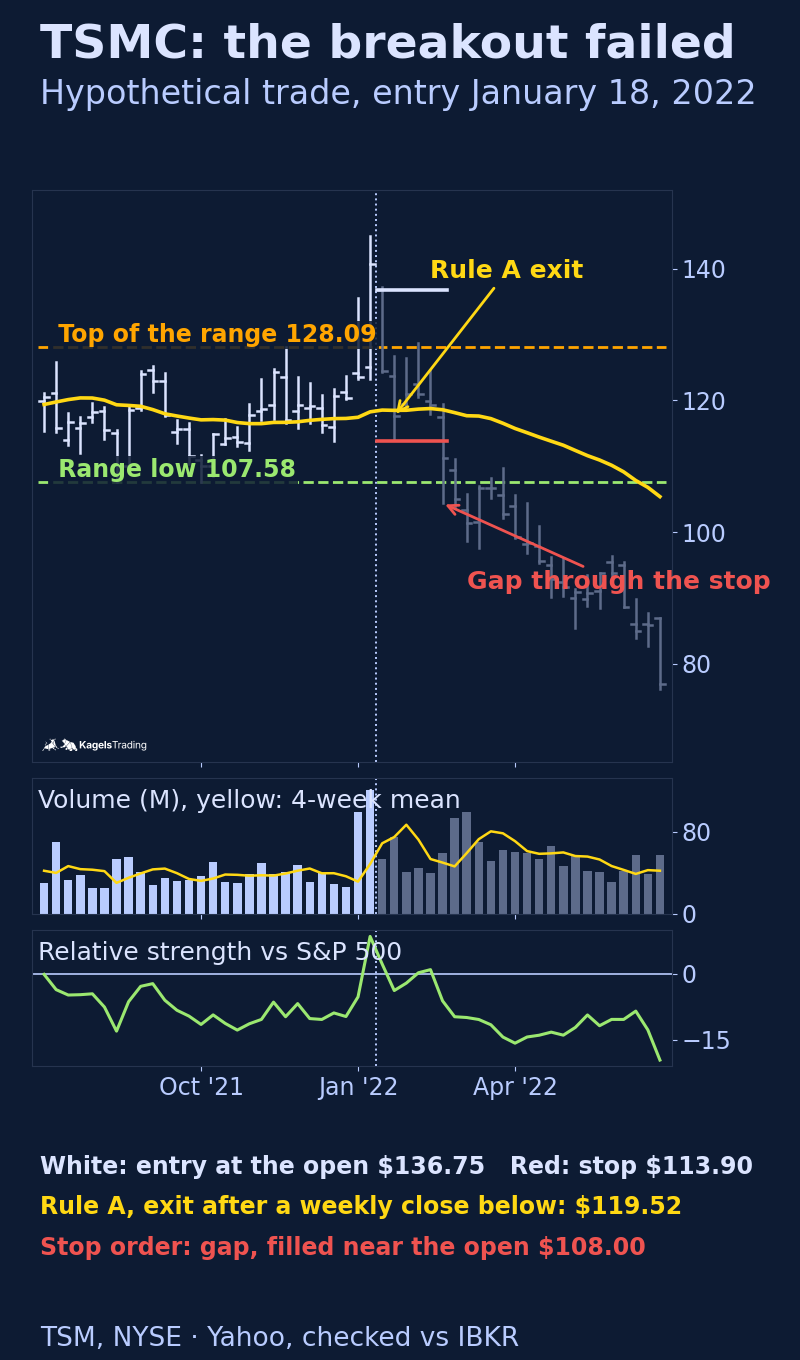
On Friday, January 14, 2022, TSM closed at $140.66, above a seven-month range whose top was $128.09. Volume was 120.6 million shares, 2.5 times the mean of the four prior weeks. The 30-week average was rising slightly ($118.27 after $117.44), and the relative strength line jumped above zero. The breakout again came on the day of quarterly results, January 13, 2022.
 Click to enlarge
Source: Data from Yahoo Finance and IBKR, chart by Kagels Trading.
On paper this looked like a Stage 2 breakout, and the market filters did not object. On the decision date the S&P 500 and the SOX both closed above rising 30-week averages. The hypothetical entry was the next open, $136.75 on January 18, 2022, with a stop at $113.90, one cent below the pullback low of $113.91 from December 20, 2021. That is a risk of $22.85 per share, or 16.7 %.
Within one week, the stock closed back inside the range at $124.53. One week later it closed below its 30-week average at $117.61. Under Rule A, the exit came at the open on January 31, 2022, at $119.52: a loss of $17.23 per share, about 0.75 times the planned risk. A stop order at $113.90 would have been triggered on February 24, 2022, when TSM opened at $108.00 after the Russian invasion of Ukraine. The loss would then have been $28.75 per share, about 1.26 times the planned risk. A stop is a trigger, not a price guarantee.
The warning signs were in the chart before the breakout, but they were signs, not signals. The range had formed after a big advance and a peak in February 2021, which is the typical location of a Stage 3 top. During most of the range, the relative strength line was below zero: TSM had done worse than the market for months. And the S&P 500 had closed the week 2.2 % below its highest weekly close, set at the end of December 2021. A trader who required a clean Stage 1 base after a decline and rising relative strength before the breakout would have skipped this trade. One who did not would have taken a loss. Both are legitimate outcomes of a rule set.
How to apply Stage Analysis each week
A weekly routine keeps the method simple and stops you from reacting to every daily move. The review needs completed weekly bars, so the weekend is a good time. This is a practical workflow, not a rule from the book.
- Check the market: find the stage of the main index you trade. If it is in Stage 4, keep new buys small or skip them.
- Check the sectors: sort the sector indices or sector ETFs by stage and relative strength.
- Scan for candidates: a stock screener can list stocks above a rising 30-week average (about the same as a 150-day average on daily data) with rising relative strength. Our TradingView screener guide shows what the free plan can filter on the weekly timeframe. A screener produces candidates, not confirmed signals.
- Read each chart: decide the stage yourself. Mark the top of the base and the stop level, then set a price alert.
- Review open positions: raise stops where the rule allows, never lower them, and note any stock whose average is flattening (possible Stage 3).
Write down your rules once and use them every week. Which index is your market filter, what counts as a base, what volume you require, where the first stop goes and which exit rule you use. Without written rules, the stage of a stock tends to become whatever you want it to be. For the breakout itself, our guide to breakout trading shows how often breakouts fall back into the range and how to plan entry and stop.
Limits of Stage Analysis
Stage Analysis is a framework for reading charts, not a system with a proven edge. We found no performance figures from Weinstein himself. Thomas Bulkowski published the results of his own trades from 1987 to 2010, sorted by the stage in which he bought: on average +13.2 % for buys in Stage 1 (127 trades), +4.1 % in Stage 2 (116), −5.9 % in Stage 3 (69) and −8.3 % in Stage 4 (127). These are one trader’s personal results, not a controlled backtest, and they say nothing about your future returns.
The weekly chart makes the method slow, and that cuts both ways. It filters out much of the daily noise, but signals come late and stops are far away. A 15 % stop distance is normal, so a few failed breakouts in a row cost real money if the position size is too large. Gaps over a weekend or after earnings can move the price far past your stop.
The stage is a judgement, and different traders will label the same chart differently. Moving averages lag, ranges can break both ways, and a stock can stay in Stage 1 for years. The method also needs reliable volume data. Weinstein built it for stocks; on markets with incomplete volume data, such as spot forex, the volume part does not work in the same way.
Conclusion
Stage Analysis gives you a clear structure: buy strength in Stage 2, protect profits in Stage 3 and avoid Stage 4. It needs only a weekly chart, the 30-week average, volume and relative strength, and one review per week. The TSMC examples show both sides: a breakout that ran for a year, and one with a similar setup that failed within weeks and gapped through its stop. Use the method with written rules, a position size that survives a series of losses, and the honest expectation that the stage of a stock is an interpretation, not a fact.
Frequently asked questions about Stage Analysis
What is Stage Analysis in trading?
Stage Analysis is Stan Weinstein’s method of dividing a stock’s price cycle into four stages: base, advance, top and decline. The stage is judged on the weekly chart from the price relative to the 30-week moving average, the slope of that average, volume and relative strength. Buys are made only in Stage 2.
What are the four stages of the stock market?
In Stage Analysis the four stages are Stage 1 (base), Stage 2 (advance), Stage 3 (top) and Stage 4 (decline). In Stage 1 the price moves sideways after a decline, in Stage 2 it rises above a rising average, in Stage 3 it moves sideways after an advance, and in Stage 4 it falls below a falling average.
What is the 30-week moving average?
The 30-week moving average is the average of the last 30 weekly closing prices, recalculated every week. Most sources describe it as a simple average. On a daily chart, a 150-day average gives a similar line, because 30 weeks have about 150 trading days. In Stage Analysis, its slope matters as much as the price’s position above or below it.
How do I find Stage 2 stocks?
A stock screener can narrow the list to stocks above a rising 30-week or 150-day average with rising relative strength. You then check each chart yourself: is there a base, has a completed weekly bar closed above it, and did volume increase? The screener finds candidates; the decision about the stage stays with you.
Is relative strength the same as the RSI?
No, relative strength in Stage Analysis compares a stock with the market, while the RSI measures the momentum of a single price series. Weinstein’s relative strength is the stock price divided by an index such as the S&P 500. The Mansfield version shows this ratio against its own 52-week average, so values above zero mean the stock did better than its one-year norm. The RSI by Welles Wilder is a different indicator.
Can Stage Analysis be used for ETFs, crypto or forex?
The four-stage logic works on any weekly chart, but the method was built for stocks. For ETFs and liquid futures the price and volume parts carry over well. In spot forex there is no central exchange volume, so the volume check is weaker. For cryptocurrencies, volume differs between exchanges, so use one consistent source.
This English edition is based on our German edition on kagels-trading.de and has been adapted for international readers.
More Chart Techniques guides
- Draw key levels
Support and Resistance: How to Draw and Use Key Levels
Where useful levels come from, how to draw zones with a stated rule and how to turn a level into a trade plan.
- Read price action
Price Action Trading: How to Read Charts Without Indicators
Market structure, key zones and three bar patterns, with a core setup and a real SPY example where the signal failed.
- Trade breakouts
Breakout Trading Strategy: Entries and False Breakouts
How often breakouts fell back into the range in our count of 1,472, and how to plan entry, stop and position size.
- Draw and trade trendlines
Trendline Trading: How to Draw Trendlines and Trade Them
How to draw trendlines with a fixed rule, four strategies for bounces, breaks and retests, and a real SPY line break without a lasting reversal.
- Use Fibonacci levels
Fibonacci Retracement Levels: How to Draw and Trade Them
How to calculate and draw retracement levels, trade pullbacks with confluence and a stop at the structure, and what a ten-year test says about the levels.
- Set Fibonacci targets
Fibonacci Extension: Levels, How to Draw It and Calculator
Three-point extension targets from the end of a pullback, why they differ from levels beyond 100%, a free calculator and three SPY swings, one without a single target reached.
- Trade gaps
Gap Trading Strategy: How to Trade Gaps and When Gaps Fill
Opening and full gaps, the four classic gap types, how often SPY gaps filled in our count since 2001, and plans for gap fill and gap and go.
- Calculate pivot points
Pivot Points: Formulas, Types and How to Trade Them
Formulas for standard, Fibonacci, Woodie, Camarilla and DeMark pivots, a free calculator, which session counts and a real SPY day.
- Swing trade
Swing Trading: 4 Strategies, Risk and Real Examples
Four swing trading strategies on the daily chart, position size, gap risk and US rules, with two hypothetical SPY pullbacks: one hit its target, one was stopped out.