
Trendline Trading: How to Draw Trendlines and Trade Them


Contents
- Trendline trading in 30 seconds
- What is a trendline?
- How to draw trendlines
- Four trendline strategies
- John Hill’s test: how strong is the pullback?
- A complete trendline system with entry, stop and target
- A real SPY example: a line break without a lasting reversal
- Common trendline mistakes
- Conclusion: a trendline is a frame, not a signal
- Frequently asked questions about trendlines
- About the author
Two points, one line, done: few chart tools are explained as quickly as the trendline. And few are used as differently. Ten traders draw ten slightly different lines on the same chart. In my experience, that is where most of them go wrong: they look for the one perfect trendline instead of a fixed rule for drawing every line.
This guide turns the order around: first the rule, then the line, then the trade. You get four trendline strategies for bounces, breaks and retests, John Hill’s test for the strength of a pullback, a complete system with entry, stop and target, and a real SPY chart in which a line break did not become a lasting reversal. This article follows our editorial policy.
Trendline trading in 30 seconds
- Two points are enough: an uptrend line connects two rising swing lows, a downtrend line two falling swing highs. You extend it to the right.
- Support and resistance on a slope: while the line remains unbroken under your chosen break rule, it keeps describing the trend. After a break, the line can act on the other side.
- Watch the slope: very flat lines describe a sideways market, very steep lines a pace that rarely lasts.
- A break is a warning, not yet a reversal: in an intact trend, many breaks lead to no reversal. A failed retest is a stronger signal.
- Consistency beats precision: lines drawn by the same pivot rule every time can be used in real time. Perfect lines exist only in hindsight.
What is a trendline?
A trendline is a straight line on a price chart that connects at least two swing lows or two swing highs and shows the direction of the trend. An uptrend line connects rising lows and runs below price; it acts as support while the market stays above it. A downtrend line connects falling highs and runs above price; it acts as resistance while the market stays below it.
The line is not an indicator. It projects two selected pivots and does not average price. That is why it works the same way on a 3-minute chart and a monthly chart, in stocks, futures and forex. If you trade price action, you will hardly get around it.
One honest limit belongs right at the start: a trendline is not free of delay either. A swing low is only a swing low once the bars to its right have formed. With the rule I use in the SPY example below, that takes five bars. Until then the line does not exist in real time, even if it looks obvious later.
Two parallel lines make a channel. A trend channel adds a parallel line on the other side of the move: the trendline marks where you look for entries, the parallel marks a possible target area on the other side. Some intraday traders draw the channel of the previous session and watch how price treats it the next day.
When is a trendline broken?
There are three common definitions, and you have to pick one. Galen Woods lists them: the market trades through the line, it trades through by a set threshold, or a bar closes beyond the line. Waiting for the close filters out brief intraday pokes, and Galen Woods finds that it works well. Its cost shows in fast markets, where the move can be far away by the time the bar closes.
Whichever you choose, stay with it. If you count every intraday poke as a break, a healthy trend can shake you out several times. If you wait for the close, you enter later. Both are legitimate. Switching between them from trade to trade is not a rule, it is a mood.
Strengths and limits
| Strengths | Limits |
|---|---|
| One line, four pieces of information: direction, momentum, support and a possible entry area | Subjective: two traders pick different pivots and get different lines |
| Works in many markets and time frames without settings | Many false breaks: in a strong trend, many breaks do not end the trend |
| Checkable: each touch confirms or questions the line again | Hindsight trap: on a historical chart every line looks perfect |
| Nothing is smoothed: the line sits on real turning points | Not enough alone: without a trigger, context or a second tool the line is only a zone |
How to draw trendlines
Geometry is generous here: a straight line needs two points, and so does a trendline. The work lies in choosing the right two swing points and keeping the same rule every time.
For an uptrend line:
- Pick two swing lows where the market turned up.
- Check the order: the second low must be higher than the first.
- Connect them: ideally the line does not cut through the bars in between.
- Extend it to the right: only then can you trade it.
For a downtrend line, mirror everything. Use two swing highs, the second one lower, and extend the line to the right until price breaks it.
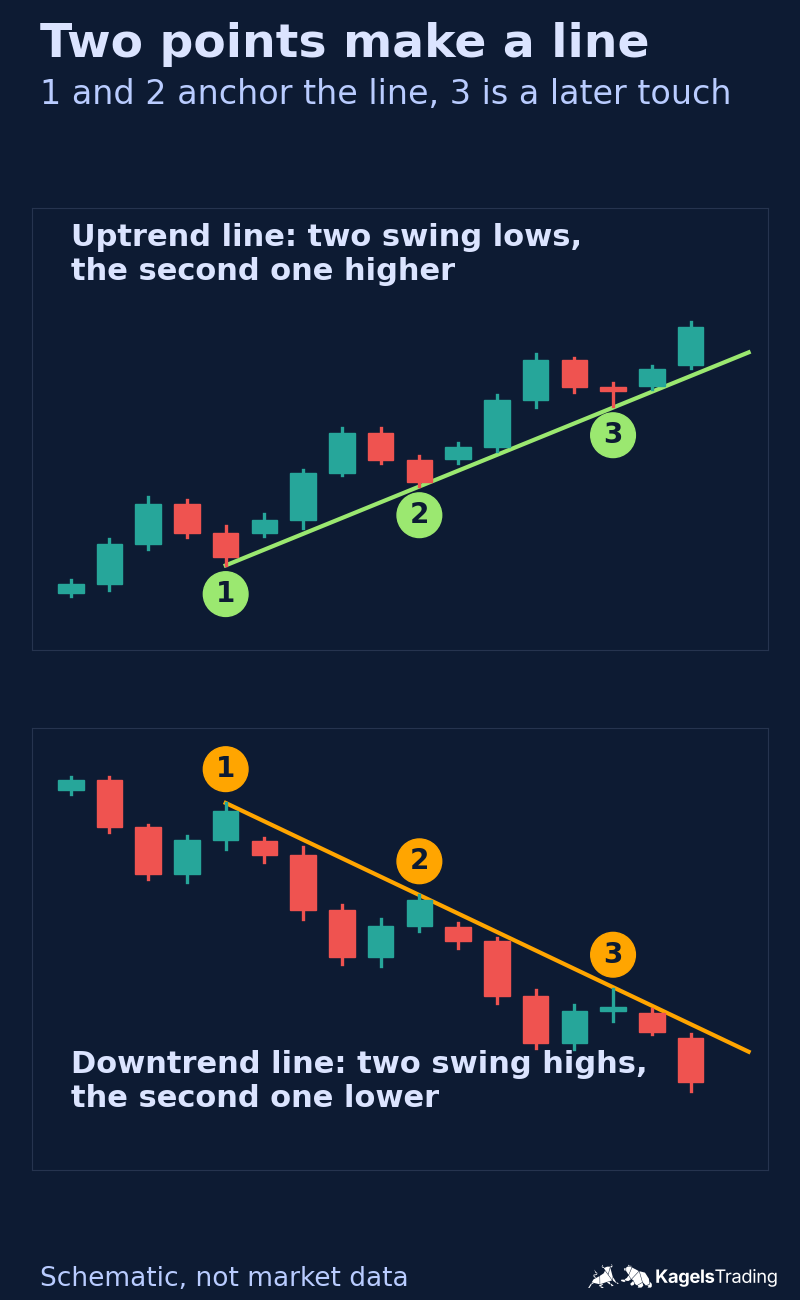 Click to enlarge
Source: Kagels Trading, own drawing.
Which pair of points is right? Often several are valid. A line through two major swing points tracks the trend over a longer period; a line through two minor points reacts faster on a short time frame. What matters is that your swing definition is fixed. In the SPY example I use a simple one: a swing low is a low that is lower than the lows of the five bars on each side.
How many touches does a valid line need? Two points define it. A third touch shows that price has respected the same projection again. More touches show the same thing more often; they do not guarantee the next touch, and I do not treat a line with five touches as a buy signal by itself.
Four trendline strategies
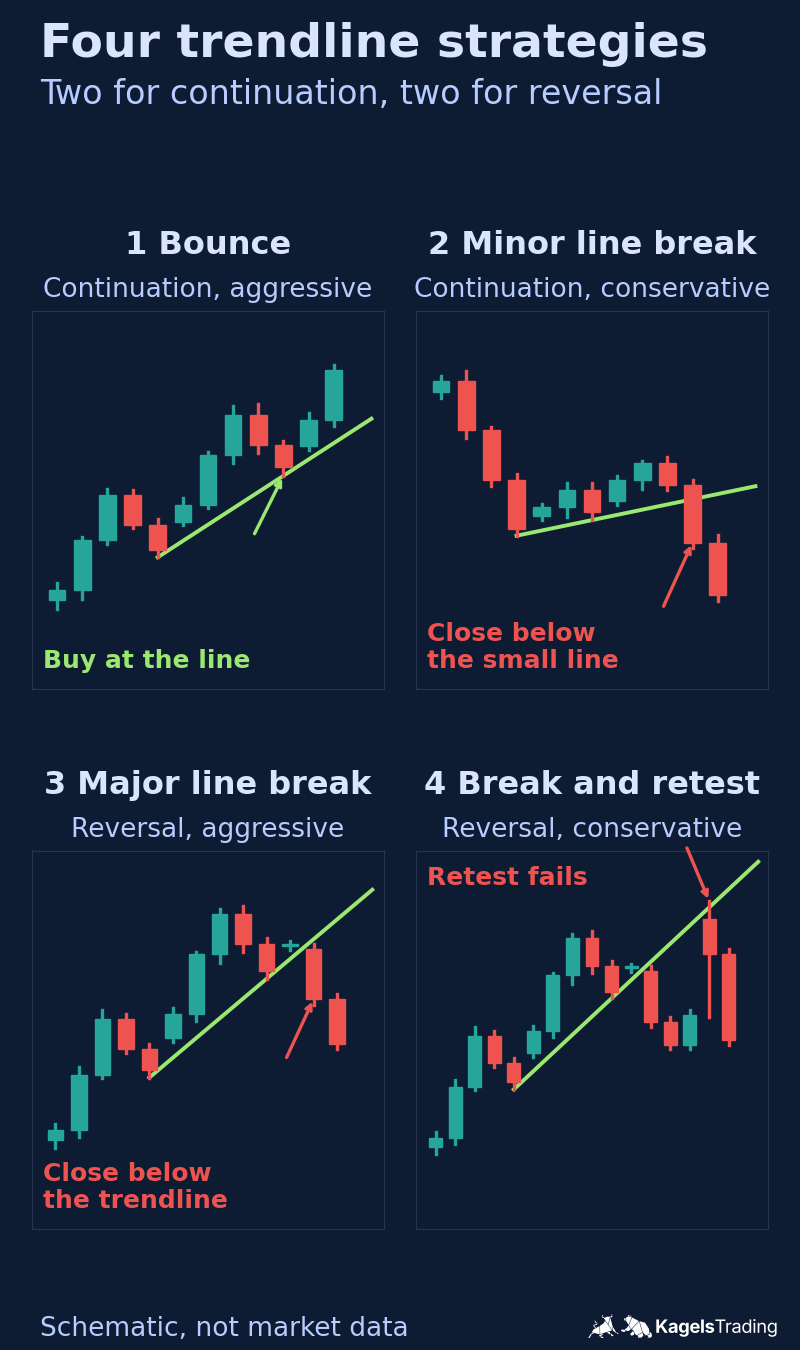
When you trade a trend, you bet either on continuation or on a reversal. Galen Woods, a price action trader and author from Singapore, sorts four trendline strategies into two pairs: for each direction of the bet, an aggressive and a conservative version. I use the same framework because it forces you to decide in advance what you are betting on.
 Click to enlarge
Strategy 1: the bounce (continuation, aggressive)
The bounce is the classic pullback trade: the trend continues exactly as the line describes. In an uptrend, price comes back to the line and turns up again. There are two ways in. The conservative one waits for a confirming bar pattern at the line, such as a bullish engulfing bar or a pin bar. The aggressive one enters with a limit order as soon as price touches the line. On the daily chart, pullback trades like this are the core of swing trading.
The limit entry gets the better price, but it has no confirmation. Galen Woods notes that its probability of success is generally lower and pairs it with a volatility stop, so normal noise does not throw you out at once. An ATR-based stop is one way to size that distance.
Strategy 2: the minor line break (continuation, conservative)
Here you do not trade the big trendline, but a small line that runs against the main trend. In a downtrend, the correction up forms a small rising line under its lows. When price breaks below it, you enter with the main trend. One line does two jobs: it defines the correction and it triggers the trade.
It needs a more complex correction, at least two legs, so that a counter line can form at all. That is why Galen Woods calls it the conservative continuation trade. He adds that the labels are not absolute: depending on the price action and how you draw your lines, a bounce can also be the more conservative choice.
Strategy 3: the major line break (reversal, aggressive)
A major trendline tracks the larger trend, and its break is technically a reversal signal. The problem: in a strong trend, the same kind of line is often broken without a reversal. A single break is not enough evidence.
Real reversals often show more than a broken line. Look for unusual volume, a change in momentum, a divergence or a clear change in market structure. Galen Woods puts it plainly: this is an aggressive reversal strategy, do not use it in isolation.
Strategy 4: break and retest (reversal, conservative)
The fourth strategy is the patient sister of the third. You do not act when the line breaks. You give the market a chance to resume the trend. If it fails, you enter in the direction of the reversal.
What you want to see is failure at the broken line. After an uptrend line breaks, price comes back up to it from below, the closes stay below the line, and a rejection bar closes back down. Then the reversal case is stronger. The price for this patience: you miss moves that never come back. A retest is not guaranteed.
John Hill’s test: how strong is the pullback?
Not every pullback deserves your money. John R. Hill, co-author of “The Ultimate Trading Guide”, describes in “Scientific Interpretation of Bar Charts” a simple test with two lines, and Galen Woods explains the method on Trading Setups Review. Hill names four criteria for judging a breakout: the trend, the number of pullback swings, the relative length of the swings and the retracement in percent. The two-line test needs a complex pullback with at least three swings.
The basic idea: the weaker the pullback, the more likely the trend continues. A strong pullback can be the first sign of a reversal, a weak pullback a pause.
- Number the points: in an uptrend, point 0 is the trend high where the pullback starts. Number the turning points of the pullback from 0 to 4; point 4 is a lower high after which price turns down again.
- Draw the 0-2 line from point 0 through point 2.
- Draw the 0-4 line from point 0 through point 4, once point 4 is confirmed as a turning point.
- Compare the slopes: if the 0-4 line is steeper, the pullback has force, skip the breakout. If the 0-2 line is steeper, the pullback is losing force, and a later breakout above the 0-4 line can be traded.
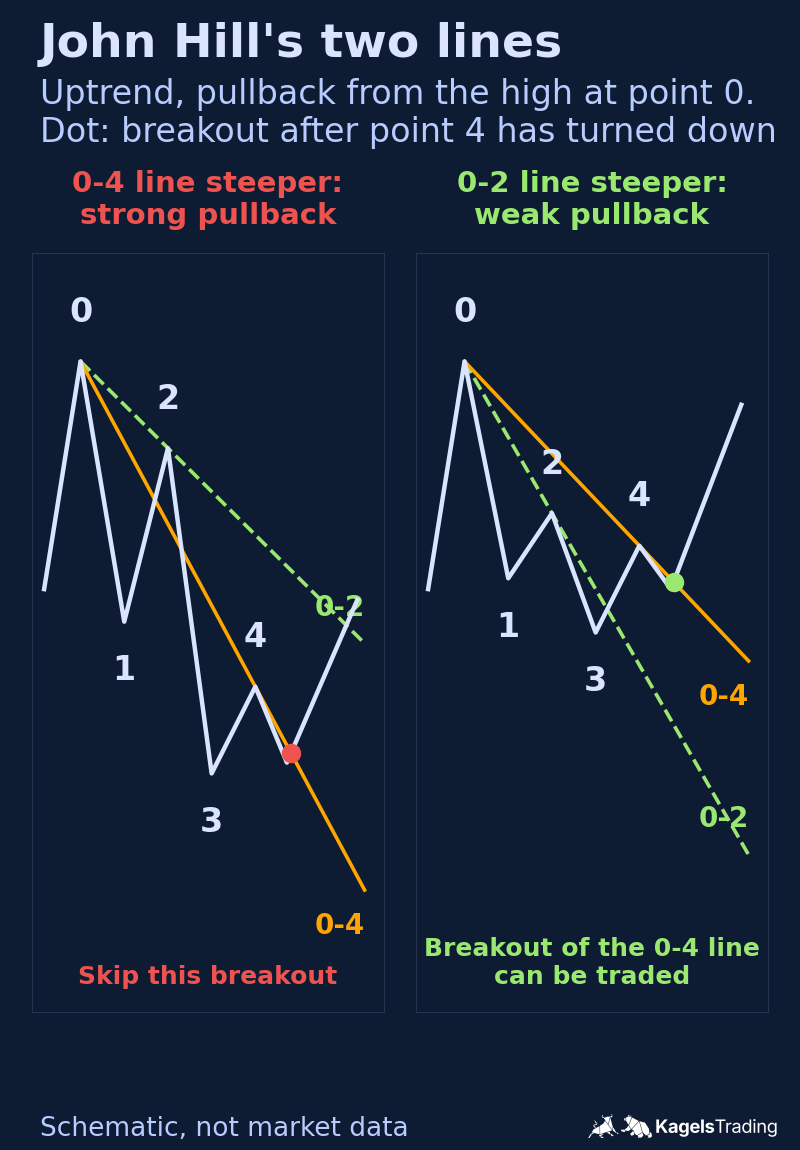 Click to enlarge
Source: Method after John Hill and Galen Woods, own drawing.
In a downtrend everything is mirrored. A short trade needs the 0-4 line to sit lower than the 0-2 line, and you sell the break below the 0-4 line. If the rules confuse you at first, look only at the 0-4 line: for a long trade it has to be the flatter one.
Galen Woods shows a winner and a loser with the same rules. Both are short trades on daily charts: McDonald’s continued down after the break of the 0-4 line, Exxon Mobil turned up instead. In the losing trade the pullback had undone most of the prior down swing. A very deep pullback can be a reversal in disguise, and the test does not remove that risk. The weak point of the method is the same as for every trendline: how you define the swing points changes the slope of both lines.
A complete trendline system with entry, stop and target
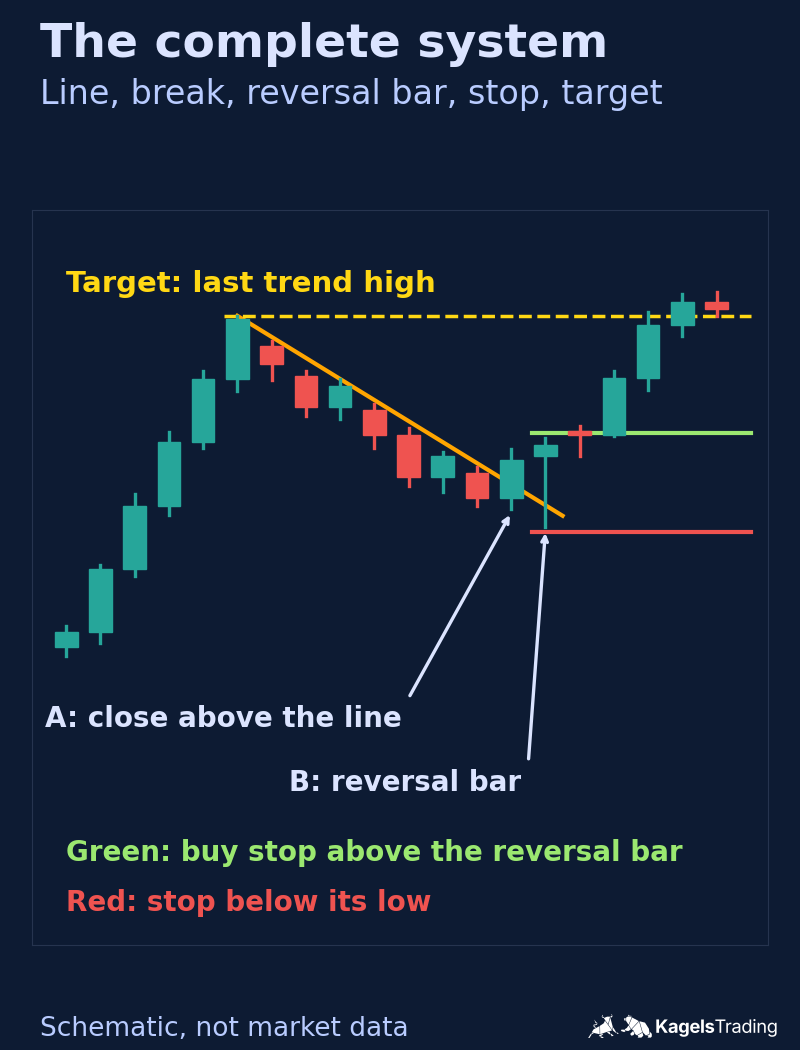
The strategies above are building blocks; this section is a complete plan. It is an adaptation of Galen Woods’s simple trendline system. He waits for the break of the line that tracks the prevailing trend; here I use a countertrend pullback line and require a closing break. The system defines entry, stop, target, when the order goes in and when it is cancelled. It is meant for trend continuation, not reversals, and not for automated trading, because drawing the lines takes judgment.
 Click to enlarge
Rules for a long trade
- Draw the line: in an uptrend, connect the lower highs of the pullback.
- Wait for the break: a close above the line shows that the pullback may be over.
- Wait for the trigger: a bullish reversal bar, a bar that trades below the low of the bar before it and closes above that bar’s close.
- Check the numbers first: planned entry = reversal bar high plus one tick, stop = reversal bar low minus one tick, target = the last trend high before the pullback. The levels must satisfy target > entry > stop, and the distance to the target must be at least 1.5 times the distance to the stop. If not, skip the trade.
- Opening check: no order goes in before the next regular session opens. If the open is below the reversal bar low, skip the trade. If the open is at or above the planned entry, skip it too, because the order would fill above the planned price. Otherwise place the buy stop at the planned entry.
- Validity and cancellation: the buy stop is valid for that session only. Cancel it if it has not filled by the close, if price trades below the reversal bar low first, or if price reaches the target first. A triggered stop becomes a market order, so in a fast market the fill can be worse than the stop price.
- Manage the trade: the protective stop one tick below the reversal bar low, the sell limit at the target.
For a short trade, mirror every rule. Draw a line over the higher lows of a rally in a downtrend and wait for a close below it. The trigger is a bearish reversal bar: a bar that trades above the high of the bar before it and closes below that bar’s close. The sell stop goes one tick below its low after the same opening check, the protective stop one tick above its high, the target at the last trend low, with the same validity and cancellation rules.
Other trigger patterns work too. I use the reversal bar here because it can be defined in one sentence. The 1.5 threshold is my choice for this guide, not a law; set your own before you trade and keep it fixed.
Why the last trend extreme is the target
The premise of the system is that the trend resumes. It has resumed when price exceeds its last trend extreme; if it stays below, the trend has not come back. So the last extreme is the most conservative target that still fits the premise. A closer target would contradict it. A target further away lowers the chance of reaching it. And a fixed price level lets you calculate the reward-to-risk ratio before you enter.
Yes, a fixed target leaves money on the table in strong moves. You can experiment with other exits. But decide before the trade, not while it runs, and write the rule into your trading plan.
Plan the loss before the entry
Every trade needs a planned loss in money before the order goes in. The formula is: planned loss = shares × stop distance × point value. For stocks the point value is 1. With 100 shares and a stop $2.00 away, the planned loss is 100 × $2.00 × 1 = $200. A gap or a fast market can make the real loss larger than planned, so keep each planned loss to a small, fixed share of your account.
A real SPY example: a line break without a lasting reversal
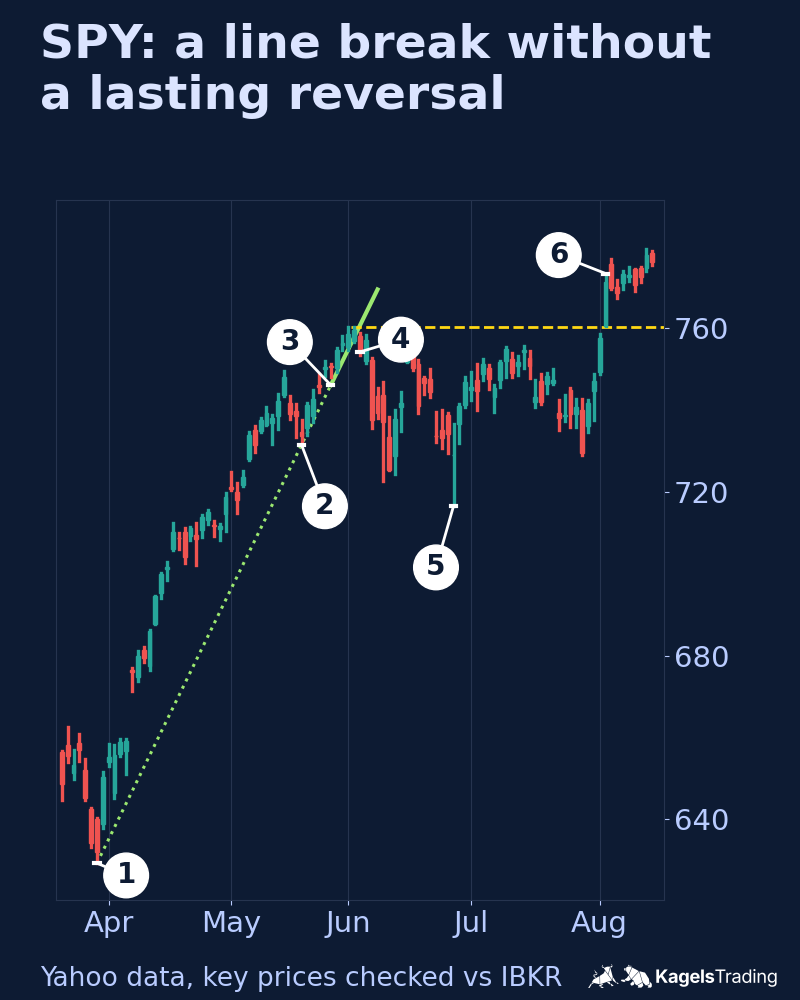
A clean trendline break can still be the wrong reversal signal. After the low of 629.28 on March 30, 2026, SPY rose into May. With my swing rule, the next swing low came on May 19 at 731.53. The line through these two lows climbed by about 2.92 points per trading day, roughly 0.4 percent a day. That is a steep line.
 Click to enlarge
In real time, that line only existed from May 27. The May 19 low was confirmed as a swing low only after five more bars. On May 27 the line stood at 746.14. On June 1 and June 2, SPY traded slightly below the line intraday and closed above it both days. Under a “trades through” definition, the line would already have been broken; under the close definition it was not.
On June 3, SPY closed at 754.24, the first close below the line, which stood at 760.74 that day. The high of the move was the June 2 high of 760.40. What followed looked like a reversal at first: SPY fell to a low of 716.58 on June 26, about 5.8 percent below the June 2 high.
On the broader horizon used here, the break did not become a lasting reversal. SPY recovered above its June high on August 4, with a high of 773.41. There was also no retest: through August 14, the last bar shown, the steep line kept rising and price never came back up to it. A trader waiting for strategy 4 would have had no trade.
What does the example teach? First: a steep line describes a pace, not a floor; its break told me the pace had ended, not that a lasting reversal had begun. Second: the break definition decides when you act; here, intraday and close rules differed by two days. Third: a break of the major line alone was not enough evidence, exactly as the strategy rules say. I chose this example because it shows a break that did not become a lasting reversal. It is one selected case, not a statistic.
Common trendline mistakes
Almost all trendline mistakes have the same root: the trader fits the line to the expectation instead of letting the line describe the market. Here are the ones I see most often, each with a short correction you can apply on your next chart:
- Too many lines: connect every possible point and you will find confirmation for any direction. Two or three lines per chart are enough.
- Moving a broken line: a broken line is broken. Redrawing it a little lower to keep a position alive is self-deception, not risk management.
- No break definition: without a fixed rule on whether a touch or a close counts, you have a mood, not a signal.
- Only one time frame: a broken 5-minute line in an intact daily trend means little. The higher time frame decides how much weight a line carries.
- Ignoring the slope: very steep lines rarely hold for long, as in the SPY example. Their break often marks a slowdown rather than a reversal.
- Confusing a trendline with a moving average: the 200-day average is recalculated with every bar; a trendline is a fixed straight line through two real turning points. They behave differently.
- Trading without a trigger: the line gives you the zone, the bar pattern gives you the signal.
One chart type sidesteps the subjectivity problem by design. On a point and figure chart, the classic trendlines run at a fixed 45-degree angle, so two traders draw the same line. The room for judgment moves to the choice of box size.
Conclusion: a trendline is a frame, not a signal
The trendline has lasted so long because it claims almost nothing. It records where the market turned and extends that to the right. Everything else comes from context: the bar pattern at the touch, the higher time frame, the behavior after the break.
That is why the four strategies differ in how aggressive they are, not in how good they are. The bounce trades the running move, the minor break the return to the trend, the major break the reversal and the retest the confirmed reversal. Which one suits you depends on how much confirmation you need before you risk money.
If you take one thing from this guide, take this: the rule comes before the line. In my more than 45 years in the markets, lines drawn by a fixed pivot rule have looked unspectacular in hindsight and have been usable in real time. Lines drawn to fit a chart have looked perfect and have been useless the moment the next bar printed.
Frequently asked questions about trendlines
What is a trendline in trading?
A trendline is a straight line on a price chart that connects at least two swing lows or two swing highs. It shows the direction of the trend and acts as support or resistance. Unlike an indicator, it does not average price; it projects two selected pivots to the right.
How do you draw a trendline correctly?
You need two points and a fixed rule for choosing them. In an uptrend, connect two swing lows with the second one higher; in a downtrend, two swing highs with the second one lower. Then extend the line to the right and leave it unchanged.
Is a trendline strategy profitable?
No tool is profitable on its own, and trendlines are no exception. Results depend on your swing definition, your break rule, the trigger, the stop, costs and the market. Test your exact rules on your own market, including losing trades, before you risk money.
What is the best time frame for trendline trading?
Trendlines can be drawn on every time frame. Shorter charts contain more short-term fluctuations, so judge a signal on a short chart in its broader context, for example against the daily or weekly chart.
What happens when a trendline breaks?
A break is a warning, but often not yet a reversal. In a strong trend, many breaks are false signals, as in the SPY example above. A break gains weight when price fails to get back to the other side of the line on a retest, or when other signs such as a change in market structure confirm it.
How many touches does a valid trendline need?
Two points define the line. A third touch shows that price has respected the same projection again. Further touches repeat that observation; they are not a guarantee for the next touch and not a buy signal by themselves.
What is the difference between a trendline and a moving average?
A trendline is a fixed straight line, a moving average a curve that is recalculated with every bar. The trendline sits on two real turning points and no longer changes. The moving average adapts to each new bar and therefore trails price.
Can you trade with trendlines alone?
I would not trade the line on its own. The line gives you the zone, not the signal. Without a trigger such as a reversal bar, a chart pattern or confirmation from volume, you trade a guess. Only the combination of line and trigger gives you a setup with a defined stop.
This US edition is based on our German edition on kagels-trading.de and has been adapted for US readers.
More Chart Techniques guides
- Draw key levels
Support and Resistance: How to Draw and Use Key Levels
Where useful levels come from, how to draw zones with a stated rule and how to turn a level into a trade plan.
- Read price action
Price Action Trading: How to Read Charts Without Indicators
Market structure, key zones and three bar patterns, with a core setup and a real SPY example where the signal failed.
- Trade breakouts
Breakout Trading Strategy: Entries and False Breakouts
How often breakouts fell back into the range in our count of 1,472, and how to plan entry, stop and position size.
- Use Fibonacci levels
Fibonacci Retracement Levels: How to Draw and Trade Them
How to calculate and draw retracement levels, trade pullbacks with confluence and a stop at the structure, and what a ten-year test says about the levels.
- Set Fibonacci targets
Fibonacci Extension: Levels, How to Draw It and Calculator
Three-point extension targets from the end of a pullback, why they differ from levels beyond 100%, a free calculator and three SPY swings, one without a single target reached.
- Trade gaps
Gap Trading Strategy: How to Trade Gaps and When Gaps Fill
Opening and full gaps, the four classic gap types, how often SPY gaps filled in our count since 2001, and plans for gap fill and gap and go.
- Calculate pivot points
Pivot Points: Formulas, Types and How to Trade Them
Formulas for standard, Fibonacci, Woodie, Camarilla and DeMark pivots, a free calculator, which session counts and a real SPY day.
- Swing trade
Swing Trading: 4 Strategies, Risk and Real Examples
Four swing trading strategies on the daily chart, position size, gap risk and US rules, with two hypothetical SPY pullbacks: one hit its target, one was stopped out.
- Identify market stages
Stage Analysis: Stan Weinstein's Four Market Stages
Stan Weinstein's four stages on the weekly chart, a Stage 2 checklist and two TSMC breakouts: one ran for a year, one gapped through its stop.
- Read Wyckoff ranges
Wyckoff Method: Accumulation, Distribution and Springs
Accumulation and distribution with phases A to E, springs and upthrusts as optional tests, and two real TSMC ranges read with and without hindsight.
- Trade Darvas boxes
Darvas Box Strategy: Rules, Entries and Stop Losses
The box rules step by step, when the edges become known, where the stop goes, and a mechanical test on TSMC in 2024 with two honest results.
- Count Elliott waves
Elliott Wave Theory: Rules, Patterns and Fibonacci
The five-wave pattern, three hard rules, zigzags, flats and triangles, Fibonacci ratios and a real DAX count, from the first German translator of the standard work.
- Trade order blocks
Order Blocks: How to Spot, Draw and Trade the Zone
The three conditions behind a valid order block, entry and stop at the zone, two SPY cases from 2026 and a 25-year count where a fixed rule lost money.
- Trade fair value gaps
Fair Value Gap (FVG): How to Spot, Trade and Test It
The three-candle rule, bullish, bearish and inverse FVG, two SPY cases from 2026 and a 25-year count of how often gaps were revisited and traded.
- Interpret volume
Volume Analysis in Trading: How to Read Volume Honestly
What volume counts in stocks, futures, forex and crypto, how to read it against its own average, and our SPY test of high-volume days since 2001.