
Andrews Pitchfork: How to Draw It, Trade It and Test It


Contents
- Andrews Pitchfork in 30 seconds
- What is Andrews Pitchfork?
- How to draw Andrews Pitchfork in three steps
- Three decisions to make before you trust a fork
- Original, Schiff and Modified Schiff: which handle?
- How I use the pitchfork in a trade plan
- Real example: GLD, median line reached in 2023
- Real example: SPY, the median line ran away in 2026
- Does price reach the median line 80% of the time? My count
- Common mistakes with the pitchfork
- Conclusion: a clear map with an unproven promise
- Frequently asked questions about Andrews Pitchfork
- About the author
Most chart tools describe what price has done; Andrews Pitchfork tries to project a trend forward. You mark three turning points, and the tool draws a sloping median line with one parallel on each side. The result looks convincing on almost any chart, which is exactly why it is worth testing before you rely on it. The tool is built into almost every charting platform.
This guide explains the tool and then checks its most famous claim. I show how to draw the fork step by step, what the Schiff and Modified Schiff versions change and how I use it in a trade plan. Then I counted how often price really reached the median line in 746 pitchforks in SPY, GLD and TLT since 2006. In my sample, the rate was clearly below the 80% you often read. This article follows our editorial policy.
Andrews Pitchfork in 30 seconds
- Three points, three parallel lines: the median line runs from point A through the midpoint of B and C. Two parallels run through B and C.
- The median line is the classic target: the idea is that price tends to return to it. The outer lines act as support and resistance inside the trend.
- The handle sets the slope: Schiff and Modified Schiff move the start of the median line, which flattens a normal trend fork.
- The 80% rule did not hold in my count: price reached the median line within 70 trading days after C in 59.9% of 746 cases, and in 52.9% of the forks that slope with the trend.
- I use the fork for targets and exits, not for entries: the entry comes from a level I would trade anyway, and a close beyond the parallel through C ends the idea.
What is Andrews Pitchfork?
Andrews Pitchfork is a drawing tool that builds a trend channel from three pivot points: a median line from the first pivot through the midpoint of the next two, plus two parallel lines through those two pivots.
The name comes from the shape and from the man who taught it. Alan Andrews developed the method, which is why you also see the spelling Andrews’ Pitchfork and the term median line method. The handle is the line from the first pivot, and the two outer lines are the tines of the fork. StockCharts sums up the core idea in its ChartSchool article on Andrews’ Pitchfork: in an uptrend, prices should reach the median line regularly, and a failure to reach it shows weakness.
I could not verify where the famous 80% figure comes from. Summaries of Patrick Mikula’s book The Best Trendline Methods of Alan Andrews report it as Andrews’ view that price returns to the median line about 80% of the time. I have not checked the original passage, and I found no published test behind the number, so I ran my own count further down.
On our German site, the pitchfork article is a translation of Galen Woods. Galen is the price action trader behind Trading Setups Review and a valued partner of Kagels Trading. His original Andrew’s Pitchfork Trading Strategy shows his own entry rules and examples. This English guide is written from scratch: it does not translate his article and does not use his examples or charts.
How to draw Andrews Pitchfork in three steps
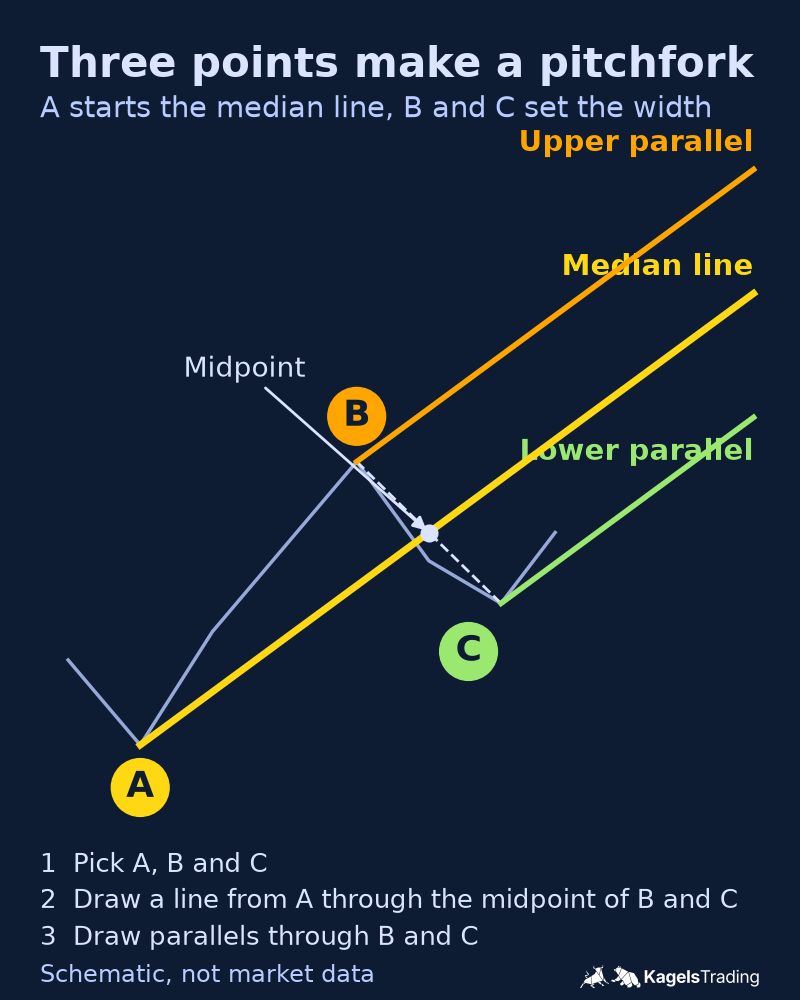 Click to enlarge
Source: Construction as described in StockCharts ChartSchool, drawing by Kagels Trading.
You need three pivots that alternate: low, high, low or high, low, high. A pivot is a clear turning point in price, a swing low with higher lows on both sides or a swing high with lower highs on both sides. The rules on this page use the same idea as our guide to drawing trendlines with a fixed rule, just with one more point.
Step 1: pick points A, B and C
For a rising fork, A is a major low, B the next high and C the next low. In a healthy uptrend, C sits above A. For a falling fork, everything is mirrored: A is a major high, B the next low and C the next high, ideally below A. The fork always points in the direction of the line from A to the midpoint of B and C.
Step 2: draw the median line
Draw a line from A through the point exactly halfway between B and C. Halfway means the middle in price and the middle in time. This median line sets the slope of the whole fork, so the choice of A matters more than anything else.
Step 3: draw the two parallels
Draw one line through B and one through C, both parallel to the median line. In a rising fork, the line through B is the upper resistance line and the line through C is the lower support line. Most platforms, including TradingView and thinkorswim, do steps 2 and 3 for you once you click A, B and C. If you are new to the TradingView drawing tools, our guide on how to use TradingView shows where they are.
Three decisions to make before you trust a fork
Write down your pivot rule before you draw. In my count, a pivot needed ten sessions on each side, and C only counted after those ten sessions. You can use another rule, but use the same one every time. If you pick pivots by eye after the fact, almost every chart seems to confirm the tool.
Choose the variant before you look at what happened after C. The three versions in the next section can give very different slopes. Switching until one fits the past is curve fitting, and it makes any later result worthless.
Define where the fork is wrong before you trade it. For me that is a daily close beyond the parallel through C. In the SPY example below, this happened four sessions after C was confirmed, and from that day on the median line was no longer a realistic target.
Original, Schiff and Modified Schiff: which handle?
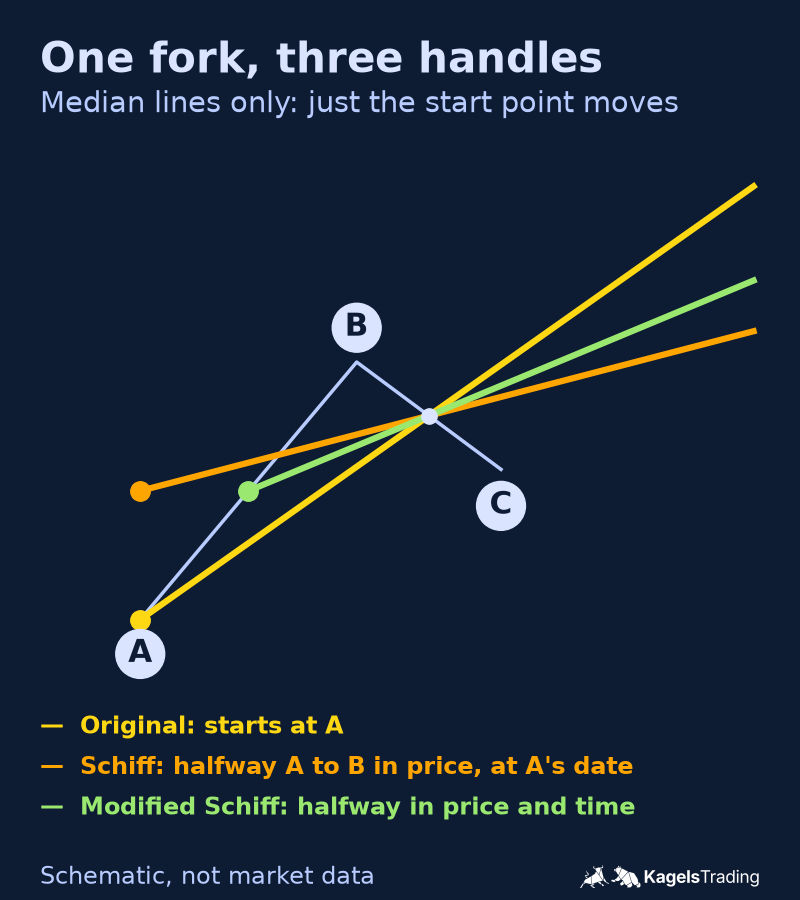 Click to enlarge
Source: Variants as defined by LuxAlgo, drawing by Kagels Trading.
The three versions use the same B and C and only move the start of the median line. In the original pitchfork, the median line starts at A. In the definition the drawing follows, which LuxAlgo describes the same way, the Schiff pitchfork starts halfway between A and B in price, at the date of A. The Modified Schiff starts halfway between A and B in both price and time.
In a normal trend fork, moving the start point makes the fork flatter. That is the reason to use it: when the original fork is clearly too steep for the market, a Schiff or Modified Schiff can fit the swings better. TradingView’s help page for the Modified Schiff pitchfork says it often fits shallower trends better.
Be careful with the exact definitions, because platforms disagree. TradingView’s help page for the Schiff pitchfork describes the start halfway between the first two points in price and time, the same words it uses for the Modified Schiff and the Inside pitchfork. TradeStation’s help uses the two names the other way round. Before you rely on a variant, look at where your platform places the handle.
How I use the pitchfork in a trade plan
I do not take entries from the fork alone. In my count, price reached the median line in only about half of the forks that slope with the trend, so a touch of a fork line is not enough reason to open a position. The entry comes from a setup I would trade anyway, usually at a horizontal level as described in our guide to support and resistance. The fork adds two things: a target and an exit.
- Find your entry at a level first. The fork only helps if the trade already makes sense without it: a level, a clear signal and a stop where the setup is wrong.
- Check the distance to the median line. If the target distance is less than about twice the distance to your stop, the median line is not worth the risk as a target. Our guide to the risk-reward ratio explains why.
- Take part of the position off at the median line. In my count the median line was missed in many cases, so I do not count on a median-line touch being followed by more; locking in a partial profit there is my trading choice, not a tested rule.
- Exit the rest on a close beyond the parallel through C. That close says the fork no longer describes the trend. After the next confirmed pivot, I draw a new fork instead of moving the old one.
In a falling fork, the plan is mirrored. The entry comes from a short setup at a resistance level, the median line below is the target, and a close above the parallel through C ends the idea. The stop stays where the short setup itself is wrong.
Other ways traders read the fork
- Median line as a magnet: when price leaves the parallel through C and heads for the median line, some traders hold until the line is reached.
- A miss as a warning: if price turns before the median line and then breaks the parallel through C, many read it as a sign that the trend is losing strength.
- Extra parallels outside the fork: many platforms let you add more lines outside the fork at set multiples of its width. Traders read them like further support and resistance once price has left the fork.
Real example: GLD, median line reached in 2023
 Click to enlarge
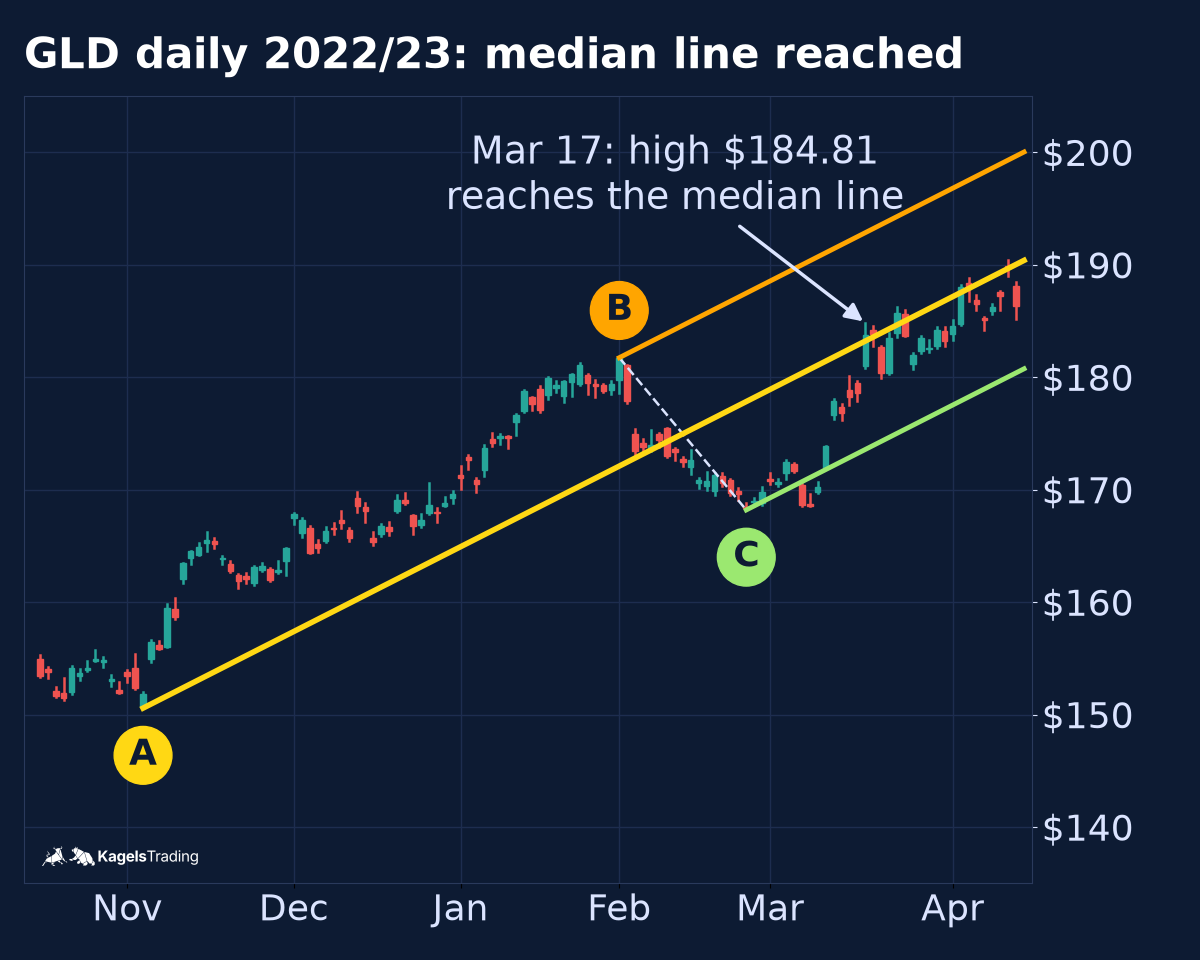
This and the next example show how the lines behaved, not trades. I picked them to show one fork that worked as described and one that did not. Neither contains an entry, a stop or a result, and two charts prove nothing about how often a pitchfork works.
This fork in gold did what the textbook describes. A is the November 3, 2022 low at $150.57, B the February 1, 2023 high at $181.73 and C the February 24 low at $168.19. Ten sessions later, on March 10, C was confirmed with a close at $173.87, and the median line was near $181.42.
Price reached the median line one week after the fork was confirmed. On March 17, 2023, GLD traded up to $184.81, above the median line at about $183.21. The fork also held on the downside for weeks: the first close below the lower parallel came on May 1, 2023.
Real example: SPY, the median line ran away in 2026
 Click to enlarge
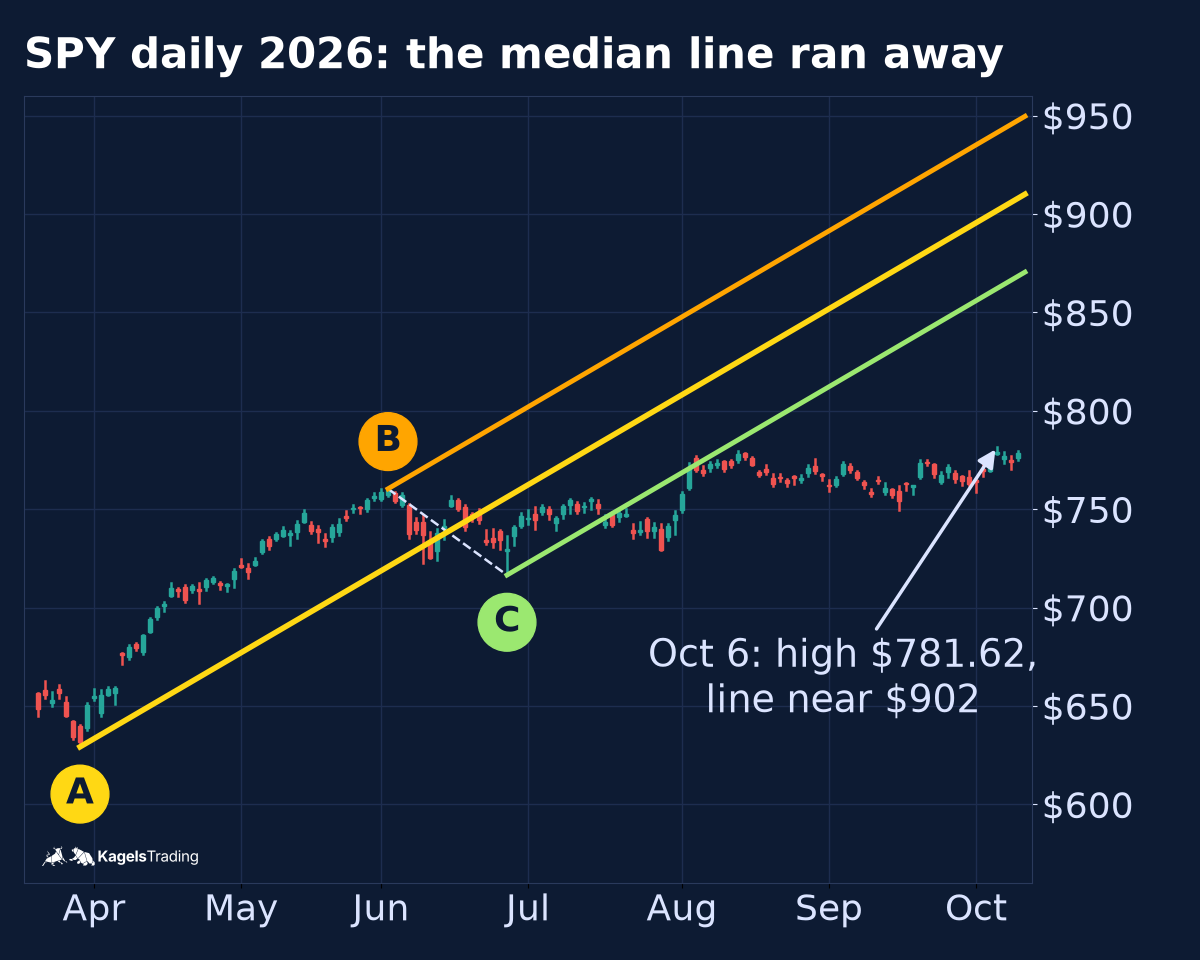
This fork looked fine at first and was broken after four sessions. A is the March 30, 2026 low at $629.28, B the June 2 high at $760.40 and C the June 26 low at $716.58. On July 13, when C was confirmed, SPY closed at $749.17 and the median line was near $776.97, only about 4% higher.
The slope was the problem in this case, not a crash. The median line rose about $2.08 per session, which is about 5.5% every 20 sessions, roughly a month, for SPY at that price. SPY moved sideways instead. On July 17 it closed at $743.29, below the lower parallel. On October 6 it made a high of $781.62, while the median line was near $902.
The fast rally from the March low was projected into the future. A fork that starts at that low assumes the same speed later on. A Schiff handle or a later A would have given a flatter fork. With the exit rule from above, the close on July 17 was the point to delete this fork, not to wait for the median line.
Does price reach the median line 80% of the time? My count
 Click to enlarge
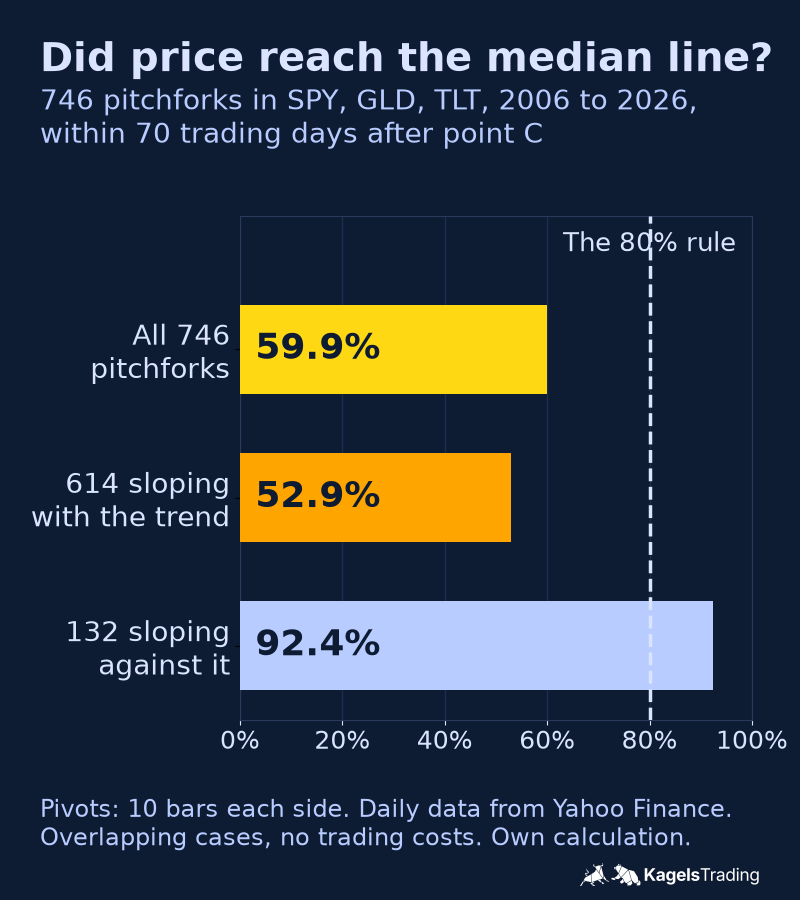
I fixed the pivot rule, the fork rule and the main measurement before I ran the count. The data are daily bars of SPY, GLD and TLT from January 2006 to November 11, 2026. A pivot high needs ten sessions with lower highs on each side, a pivot low the mirror image. Every three alternating pivots form one original pitchfork, and C counts as confirmed ten sessions after the pivot. The fixed measurement was the next 60 sessions after that confirmation.
Within 70 trading days after C, price reached the median line in 59.9% of 746 pitchforks. This view adds the ten confirmation sessions to the 60 that follow, and the split by slope below is an added breakdown of the same data, not part of the fixed plan. For the 614 forks whose median line slopes in the direction of the trend, the large majority in my sample, the rate was 52.9%. The 132 forks that slope against the trend reached it in 92.4%, because their median line runs toward price.
| Group | Pitchforks | Median line reached within 70 days after C |
|---|---|---|
| All | 746 | 447 (59.9%) |
| Sloping with the trend | 614 | 325 (52.9%) |
| Sloping against the trend | 132 | 122 (92.4%) |
| SPY | 213 | 132 (62.0%) |
| GLD | 268 | 158 (59.0%) |
| TLT | 265 | 157 (59.2%) |
After the confirmation, the median line was reached far less often. In 293 cases, price had already touched the median line while C was being confirmed. Of the remaining 453 forks, price reached it within the next 60 sessions in 34.0%, and before a close beyond the parallel through C in 23.6%. For forks sloping with the trend, the rate was 28.8%.
My fixed control line was not a fair comparison. I placed a line with the same slope at the same distance on the other side of price. It was reached in 86.1% of the 453 cases and in 88.9% of the 406 forks sloping with the trend. In a trend fork that line slopes toward price, while the median line slopes away, so the gap says more about geometry than about the tool.
An extra flat line, added after I saw these results, points the same way. A horizontal line at the same distance on the other side of price was reached in 57.6% of the forks sloping with the trend, against 28.8% for the median line. Because I added it afterwards, I treat it as a hint, not a result.
What the count shows and what it does not. The cases overlap, because each pivot belongs to up to three forks, so they are not independent. Mechanical pivots are not the swings an experienced trader would pick, the touch rule and the time window are my choices, and the count includes no trading costs or returns. It shows what this rule set produced on three markets. It does not disprove every reading of the 80% claim, but it does not support it either.
Common mistakes with the pitchfork
- Choosing C too early: the fork changes with every new low until C is confirmed.
- Accepting a steep fork: if the median line climbs much faster than price, it can turn from a target into a line nobody reaches.
- Switching handles after the fact: picking the variant that fits best in hindsight is curve fitting.
- Using a touch as an entry signal: a fork line alone is not a setup; the entry needs its own reason.
- No exit rule before the trade: a close beyond the parallel through C ends the idea, whatever the median line says.
Conclusion: a clear map with an unproven promise
Andrews Pitchfork is one of the clearest ways to draw a sloping trend channel. Three pivots give you a median line as a possible target, an outer line as support or resistance, and a clear point where the idea is wrong. The Schiff variants can help when the original is too steep.
Treat the median line as a target, not as a promise. In my count, price reached it within 70 trading days in about 60% of cases, and in about half of the forks that slope with the trend. That is why I take the entry from a level and use the fork for the target, a partial profit and the exit.
This article is market analysis and education, not investment advice. Every trade can lose money, and past chart examples do not show what will happen next. Test any pitchfork rule on your own market and timeframe before you use real money.
Frequently asked questions about Andrews Pitchfork
What is Andrews Pitchfork in simple terms?
It is a trend channel drawn from three turning points. A median line runs from the first point through the midpoint of the next two, and two parallel lines run through those two points.
How do you draw Andrews Pitchfork?
Pick three alternating pivots A, B and C. Draw a line from A through the midpoint of B and C, then draw parallels through B and C. On most charting platforms you only click the three points.
Does price really return to the median line 80% of the time?
It did not in my count of 746 pitchforks. In SPY, GLD and TLT since 2006, price reached the median line within 70 trading days after C in 59.9% of cases, and in 52.9% of the forks that slope with the trend.
What is the difference between Andrews Pitchfork and a Schiff pitchfork?
Only the start of the median line differs. The original starts at A. In the common definition, the Schiff starts halfway between A and B in price and the Modified Schiff halfway in price and time. Platforms do not all use the same definitions.
Which timeframe works best for Andrews Pitchfork?
The tool works on any timeframe with clear swings. Daily and weekly charts give the most obvious pivots. On intraday charts the fork changes faster, so wait even longer for a confirmed point C. Our guide to multi-timeframe analysis shows how to combine two timeframes.
What does it mean when price breaks out of the pitchfork?
A close beyond the parallel through C means the channel no longer describes the trend. It can be a reversal or only a slower trend. Either way, the fork has done its job, and you need a new drawing.
Can you combine Andrews Pitchfork with Fibonacci levels?
Yes, many traders look for overlaps. When a parallel of the fork meets a Fibonacci retracement level, the zone has two reasons to hold. The combination is still no guarantee and should be tested like any other rule.
A German edition of this article is available on kagels-trading.de.
More Chart Techniques guides
- Draw key levels
Support and Resistance: How to Draw and Use Key Levels
Where useful levels come from, how to draw zones with a stated rule and how to turn a level into a trade plan.
- Read price action
Price Action Trading: How to Read Charts Without Indicators
Market structure, key zones and three bar patterns, with a core setup and a real SPY example where the signal failed.
- Read candlestick charts
How to Read Candlestick Charts: Body, Wicks and Context
Open, high, low and close in one candle, body and wicks, two real Gold candles read step by step and how often patterns really occur.
- Know candlestick patterns
Candlestick Patterns: 10 to Know, Tested on Real Data
Ten patterns with rules and a cheat sheet, counted on DAX, S&P 500, EUR/USD and Gold since 2014: most are rare, none is a signal on its own.
- Trade the hammer candle
Hammer Candlestick: Spot It, Trade It, Know Its Limits
Three features, the difference to inverted hammer and hanging man, entry and stop, and how rarely the hammer appeared in four markets since 2014.
- Spot a morning star
Morning Star Candlestick: Rules, Real Cases, Limits
Three measurable rules, every morning and evening star in four markets since 2014, and two real cases: one reached its target, one hit its stop.
- Spot a topping tail
Topping Tail Candlestick: Rules, Silver Example and Limits
Six measurable rules for the bearish rejection candle, a silver candle from January 2026 checked step by step, the difference from the shooting star and how to trade it with a stop.
- Combine timeframes
Multi-Timeframe Analysis: A Weekly and Daily Workflow
How to combine the weekly chart for context and the daily chart for entry under one stated rule, with a documented SPY case from June 2025.
- Trade pullbacks
Pullback Trading: Entries, Stops and Failed Setups
Pullback or reversal, limit against confirmation entry, and one fixed rule set on three real QQQ cases: a target, a stop and a cancelled setup.
- Trade sideways ranges
Range Trading: Boundaries, Orders and Two Documented Fades
A 14-session rule to draw horizontal boundaries, three order-type variants and two Alpaca-verified SPY fades, one that reached the target and one that was stopped out.
- Read a consolidation
Consolidation in Trading: What the Range Tells You
What a consolidation is, why 25 years of index data showed no stable direction edge from narrow ranges or the prior trend, and two DAX breakouts from 2026.
- Read chart formations
Chart Patterns: Reversals, Continuations and Failures
Reversal, continuation and bilateral formations with the measured-move convention per pattern and two documented SPY rectangle cases.
- Trade rising and falling wedges
Rising and Falling Wedge Patterns: How to Trade Them
How to spot both wedges, where to set entry, stop and target, and why Bulkowski ranks the rising wedge with a downward breakout last of 36 patterns.
- Trade breakouts
Breakout Trading Strategy: Entries and False Breakouts
How often breakouts fell back into the range in our count of 1,472, and how to plan entry, stop and position size.
- Draw and trade trendlines
Trendline Trading: How to Draw Trendlines and Trade Them
How to draw trendlines with a fixed rule, four strategies for bounces, breaks and retests, and a real SPY line break without a lasting reversal.
- Use Fibonacci levels
Fibonacci Retracement Levels: How to Draw and Trade Them
How to calculate and draw retracement levels, trade pullbacks with confluence and a stop at the structure, and what a ten-year test says about the levels.
- Set Fibonacci targets
Fibonacci Extension: Levels, How to Draw It and Calculator
Three-point extension targets from the end of a pullback, why they differ from levels beyond 100%, a free calculator and three SPY swings, one without a single target reached.
- Trade gaps
Gap Trading Strategy: How to Trade Gaps and When Gaps Fill
Opening and full gaps, the four classic gap types, how often SPY gaps filled in our count since 2001, and plans for gap fill and gap and go.
- Calculate pivot points
Pivot Points: Formulas, Types and How to Trade Them
Formulas for standard, Fibonacci, Woodie, Camarilla and DeMark pivots, a free calculator, which session counts and a real SPY day.
- Swing trade
Swing Trading: 4 Strategies, Risk and Real Examples
Four swing trading strategies on the daily chart, position size, gap risk and US rules, with two hypothetical SPY pullbacks: one hit its target, one was stopped out.
- Identify market stages
Stage Analysis: Stan Weinstein's Four Market Stages
Stan Weinstein's four stages on the weekly chart, a Stage 2 checklist and two TSMC breakouts: one ran for a year, one gapped through its stop.
- Read Kagi charts
Kagi Charts: Reversal Amount, Shoulders and Signals
One line, one reversal amount, thick yang and thin yin: tested on DAX hourly data and compared with Renko and point and figure.
- Screen for growth leaders
CAN SLIM: William O’Neil’s Seven Rules for Growth Stocks
William O'Neil's seven CAN SLIM criteria with thresholds, his selling rules, a free screen with real counts and what the tests really show.
- Read Wyckoff ranges
Wyckoff Method: Accumulation, Distribution and Springs
Accumulation and distribution with phases A to E, springs and upthrusts as optional tests, and two real TSMC ranges read with and without hindsight.
- Trade Darvas boxes
Darvas Box Strategy: Rules, Entries and Stop Losses
The box rules step by step, when the edges become known, where the stop goes, and a mechanical test on TSMC in 2024 with two honest results.
- Count Elliott waves
Elliott Wave Theory: Rules, Patterns and Fibonacci
The five-wave pattern, three hard rules, zigzags, flats and triangles, Fibonacci ratios and a real DAX count, from the first German translator of the standard work.
- Understand Smart Money Concepts
Smart Money Concepts (SMC): What They Are and What Holds Up
The seven SMC building blocks, BOS vs CHoCH vs MSS, one labeled SPY sequence that held, one that failed, and what a chart can and cannot show.
- Understand ICT trading
ICT Trading: Silver Bullet, Killzones and What Holds Up
Michael Huddleston's Inner Circle Trader method: Silver Bullet, Judas Swing, the 2022 model and killzones in New York time, with one SPY setup that worked and one that failed.
- Trade order blocks
Order Blocks: How to Spot, Draw and Trade the Zone
The three conditions behind a valid order block, entry and stop at the zone, two SPY cases from 2026 and a 25-year count where a fixed rule lost money.
- Trade fair value gaps
Fair Value Gap (FVG): How to Spot, Trade and Test It
The three-candle rule, bullish, bearish and inverse FVG, two SPY cases from 2026 and a 25-year count of how often gaps were revisited and traded.
- Trade inverse fair value gaps
Inverse Fair Value Gap (IFVG): Rules, Examples and a Test
When a broken gap counts as inverted, three entry styles, one SPY retest that held, one that failed, and a 25-year test with trend and sweep filters.
- Trade failed breakouts with Turtle Soup
Turtle Soup Trading: Raschke Rules, ICT Version and a Test
Linda Raschke's original rules, Turtle Soup Plus One and the ICT version side by side, two SPY examples and a 25-year test on SPY and QQQ.
- Read a break of structure
Break of Structure (BOS): Rules, CHoCH vs MSS and a Test
Which swing counts, BOS vs CHoCH vs MSS under one stated convention, two SPY breaks that won and lost, and a 25-year test against ordinary days.
- Read a change of character
Change of Character (CHoCH): Rules, BOS vs MSS and Data
The first close against the trend, close versus wick, CHoCH vs BOS vs MSS, two SPY cases and what the trend did next after 287 CHoCHs on SPY and QQQ.
- Read a market structure shift
Market Structure Shift (MSS): Rules, BOS vs CHoCH and Data
MSS as a CHoCH with a sweep and a fair value gap, the comparison with BOS and CHoCH, two 2021 cases and what 14 daily MSS on SPY and QQQ did next.
- Draw supply and demand zones
Supply and Demand Trading: Zones, Rules and Real Data
Base and departure rules, the four base patterns, how zones differ from order blocks and SMC, two SPY cases and a fixed test of 86 zone trades on SPY and QQQ.
- Read liquidity sweeps
Liquidity Sweep: How to Spot It and Trade the Reversal
Sweep or run, buy-side and sell-side liquidity, internal and external targets, SPY reversal, continuation and failed-reversal examples and a 25-year count of a fixed sweep rule.
- Spot bull and bear traps
Bull Trap vs Bear Trap: How to Spot a Trapped Market
What bull traps and bear traps are, the two signs of trapped traders, how to trade the reversal with a defined stop, and two real SPY examples from 2025.
- Interpret volume
Volume Analysis in Trading: How to Read Volume Honestly
What volume counts in stocks, futures, forex and crypto, how to read it against its own average, and our SPY test of high-volume days since 2001.