
Rising and Falling Wedge Patterns: How to Trade Them


Contents
- Wedge pattern in 30 seconds
- What is a wedge pattern?
- Rising wedge: the bearish wedge
- Falling wedge: the bullish wedge
- How reliable is the wedge pattern? Bulkowski’s numbers
- How to trade a rising wedge and a falling wedge
- False breakouts and failed wedges
- Related patterns: Wolfe wave, broadening wedge and flag
- Pros and cons of the wedge pattern
- Conclusion: the wedge shows fading strength, the breakout shows the direction
- Frequently asked questions about wedge patterns
- About the author
In most guides the rising wedge is a sell signal, yet in Thomas Bulkowski’s statistics its downward breakout does worse than any other bearish pattern. In his study of US stocks in bull markets, 51% of these breakouts fail to move even 5% lower, which puts the pattern in last place, 36 out of 36. Bulkowski is a US analyst who has measured thousands of chart patterns. The wedge is still useful, just in a different way than it is usually explained.
In this guide you learn how to spot a rising wedge and a falling wedge and how to plan a trade around them. You will see how a wedge differs from a triangle and a pennant, where to set entry, stop and target, what the statistics say about both wedges and where their limits are. You will also see why a failed wedge can be a signal in itself. This article follows our editorial policy.
Wedge pattern in 30 seconds
- What it is: two trendlines that point the same way and converge. Price swings between them in ever smaller swings.
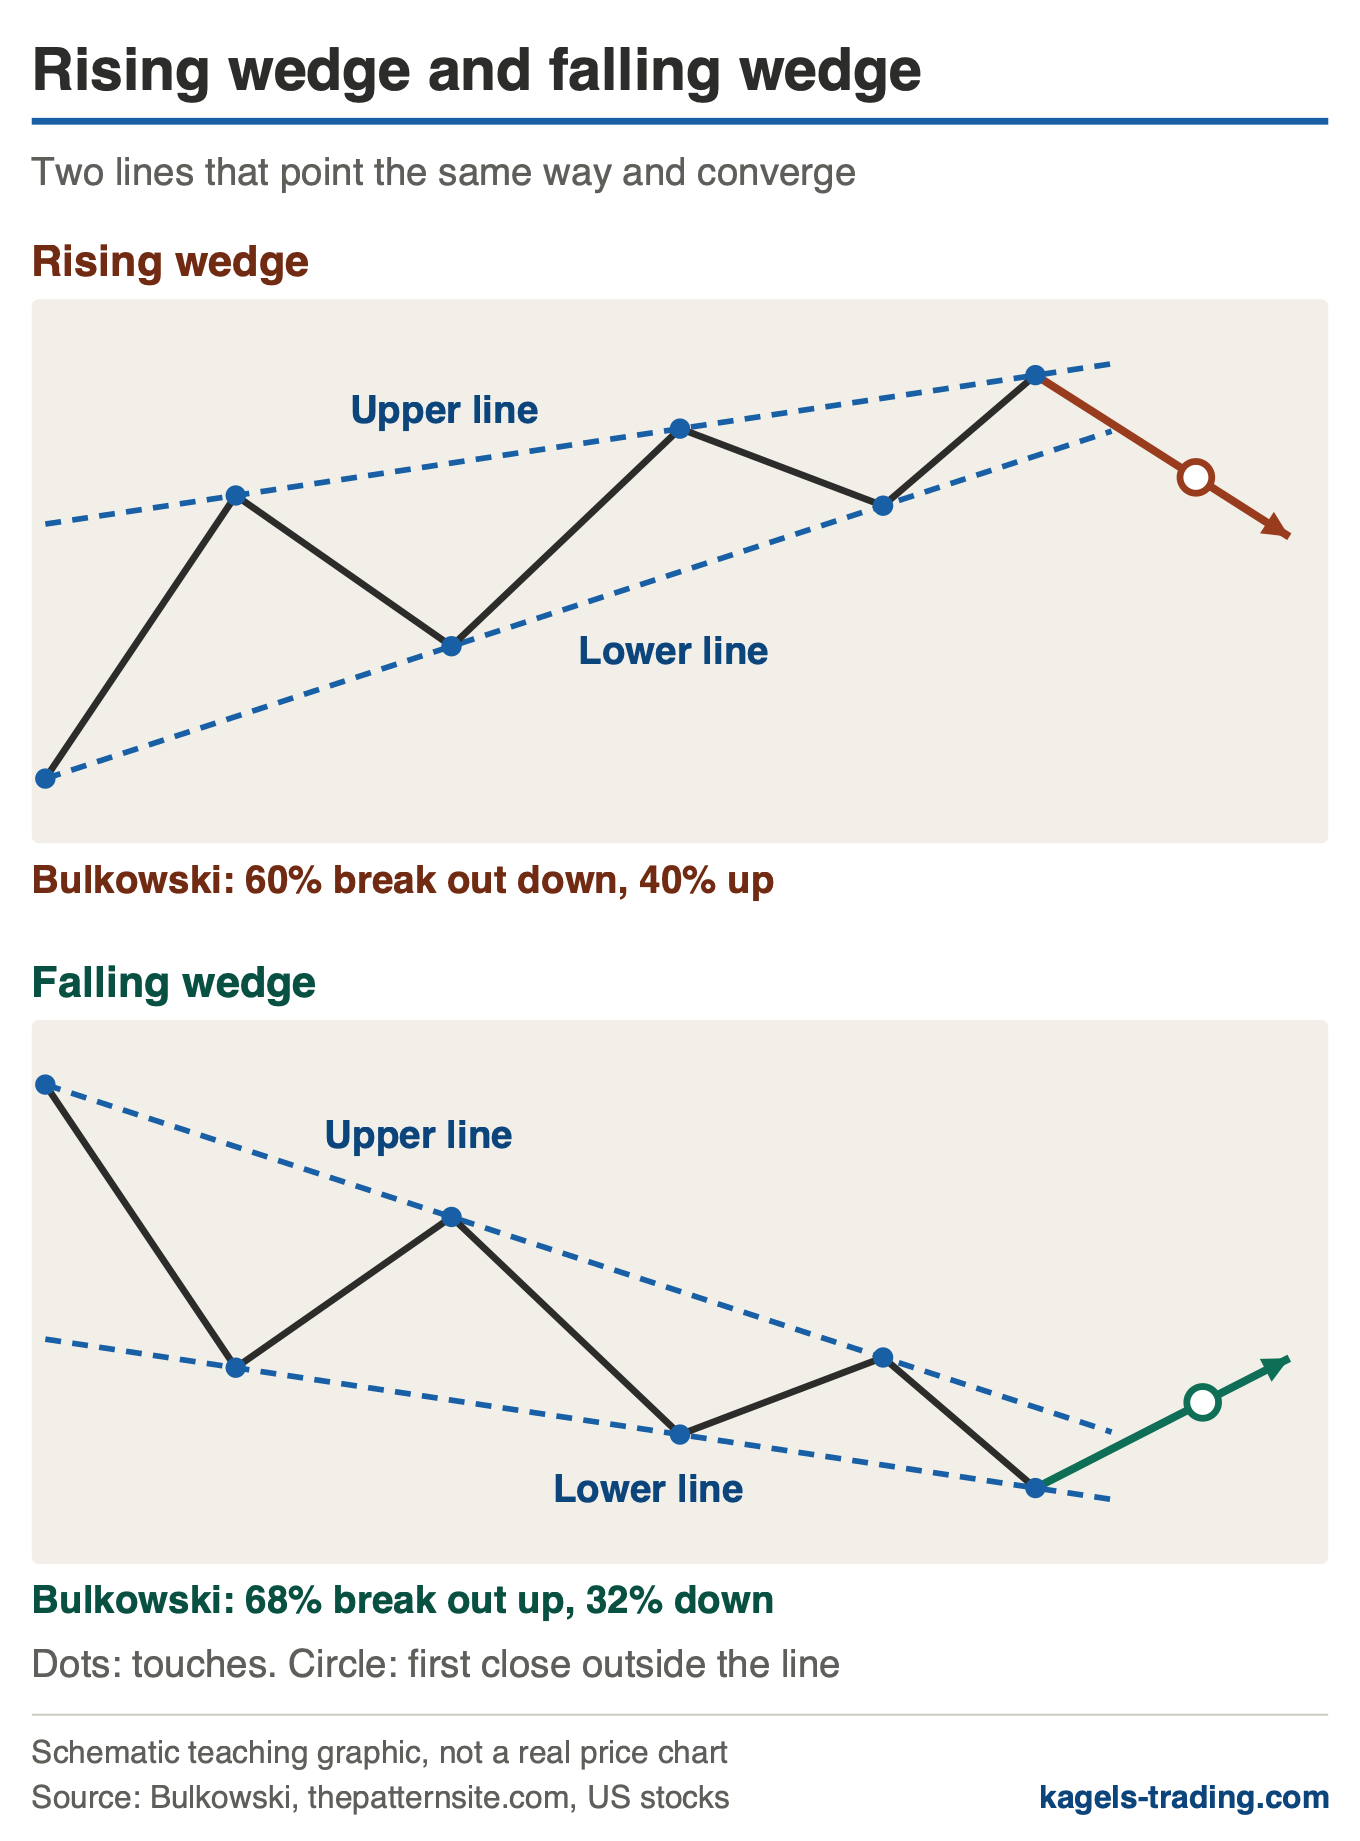
- Rising wedge: both lines rise, the lower one more steeply. It counts as bearish, but according to Bulkowski it breaks out downward in only 60% of cases.
- Falling wedge: both lines fall, the upper one more steeply. It counts as bullish and breaks out upward in 68% of cases.
- A breakout only counts once a candle closes outside a line. In 62% to 74% of cases price later returns to the breakout point.
- The numbers in context: 51% of downward breakouts from a rising wedge fail to move 5%, which is not the loss rate of a trading system. The figures come from US stocks on daily charts in bull markets; our sources give no values for forex or intraday charts.
What is a wedge pattern?
A wedge pattern is a chart pattern made of two trendlines that point in the same direction and converge, so that price swings between them in ever smaller swings.
The name describes the shape. The upper line connects the highs, the lower line connects the lows. Because the two lines move closer together, the pattern looks like a wedge lying at an angle on the chart. If it points up, it is called a rising wedge (also ascending wedge). If it points down, it is a falling wedge (also descending wedge).
The message lies in the narrowing. In a rising wedge price still makes new highs, but each new high is only a little above the last one, so buyers gain less and less ground. In a falling wedge it is the other way round: the lows keep falling, but each new low is only a little below the previous one, and the sellers lose momentum. That is why classic chart analysis expects a breakout against the slope of the wedge. The graphic below shows both wedges, with the touches, the breakout and Bulkowski’s breakout rates.
 Click to enlarge
Source: Statistics from Thomas Bulkowski, graphic by Kagels Trading.
A clean pattern needs enough touches. In his falling wedge study Bulkowski lists at least five touches as the mark of a good pattern, three on one line and two on the other, and a duration of at least three weeks. Anything shorter is a pennant for him. StockCharts’ ChartSchool says a falling wedge as a reversal pattern usually forms over three to six months, after a downtrend of at least three months. Both refer to daily charts.
Wedge, triangle or pennant: the difference
Three patterns narrow to a point, and they are often confused. What decides is the slope of the two trendlines:
| Pattern | How you recognize it |
|---|---|
| Wedge | Both lines point the same way, up or down |
| Triangle | One line is flat, or the lines come from opposite directions |
| Pennant | Like a small triangle after a steep move, usually days to three weeks |
In a triangle at least one side is flat, or the lines come from above and below. An ascending triangle has a flat upper line and rising lows, while a rising wedge has rising highs and rising lows. A pennant is a short pause after a fast move. Triangles, pennants, flags and the other formations are covered in our chart patterns guide.
Rising wedge: the bearish wedge
A rising wedge is a wedge pattern with two rising, converging trendlines in which the lower line rises more steeply than the upper line.
Price makes higher highs and higher lows, so on paper it is in an uptrend. But the lows rise faster than the highs, and each bounce from the lower line carries price a little less far. The ChartSchool on the rising wedge describes these ever shorter advances as a sign of fading buying power. According to Bulkowski, volume fell until the breakout in 79% of cases.
The rising wedge appears in two places. At the end of an uptrend it counts as a reversal pattern: the move runs out of steam, and a break of the lower line starts the turn, much like the neckline break in a head and shoulders top. Inside a downtrend it counts as a continuation pattern: price recovers slowly and then falls further. In both cases classic analysis expects a breakout downward.
The statistics dampen that expectation. In Bulkowski’s study of more than 1,400 cases, the rising wedge broke out downward in 60% of cases and upward in 40%. A wedge that breaks against the textbook in four out of ten cases is not a sell signal. It is a hint that the trend is losing strength, and only the breakout decides the direction.
Falling wedge: the bullish wedge
A falling wedge is a wedge pattern with two falling, converging trendlines in which the upper line falls more steeply than the lower line.
Price makes lower highs and lower lows, but the new lows get shallower. Sellers still push price below the last low, but only just. The ChartSchool on the falling wedge reads this as buyers stepping in earlier after each new low. According to Bulkowski, volume fell until the breakout in 72% to 75% of cases.
The falling wedge also appears in two places. After a long downtrend it counts as a bottom and signals a turn upward. Inside an uptrend it is a correction that slopes down, similar to a flag. In that case the textbook expects the uptrend to continue. The difference to a flag is that a flag has parallel lines, while the wedge narrows.
The falling wedge delivers on its promise more often than its twin. In Bulkowski’s study it broke out upward in 68% of more than 800 cases. Bulkowski still rates it as a weak pattern, because the failure rate is high and the average rise is low compared with other bullish formations. At the end of his own example he writes that it is a good example of why he avoids wedges.
How reliable is the wedge pattern? Bulkowski’s numbers
Many guides call wedges reliable, but few give a number. Thomas Bulkowski studied chart patterns in US stocks and recorded for each pattern how often it fails, how often it reaches its target and how it ranks against others. The values below apply to the bull market and to the breakout in the direction the textbook expects, so downward for the rising wedge and upward for the falling wedge:
| Measure | Rising: down | Falling: up |
|---|---|---|
| Breakout in that direction | 60% | 68% |
| Failure rate | 51% | 26% |
| Target reached | 32% | 62% |
| Return to breakout | 72% | 62% |
| Rank (1 = best) | 36/36 | 31/39 |
The ranks come from two separate ranking lists. One covers downward breakouts with 36 patterns, the other upward breakouts with 39 patterns, both in bull markets. They cannot be compared directly.
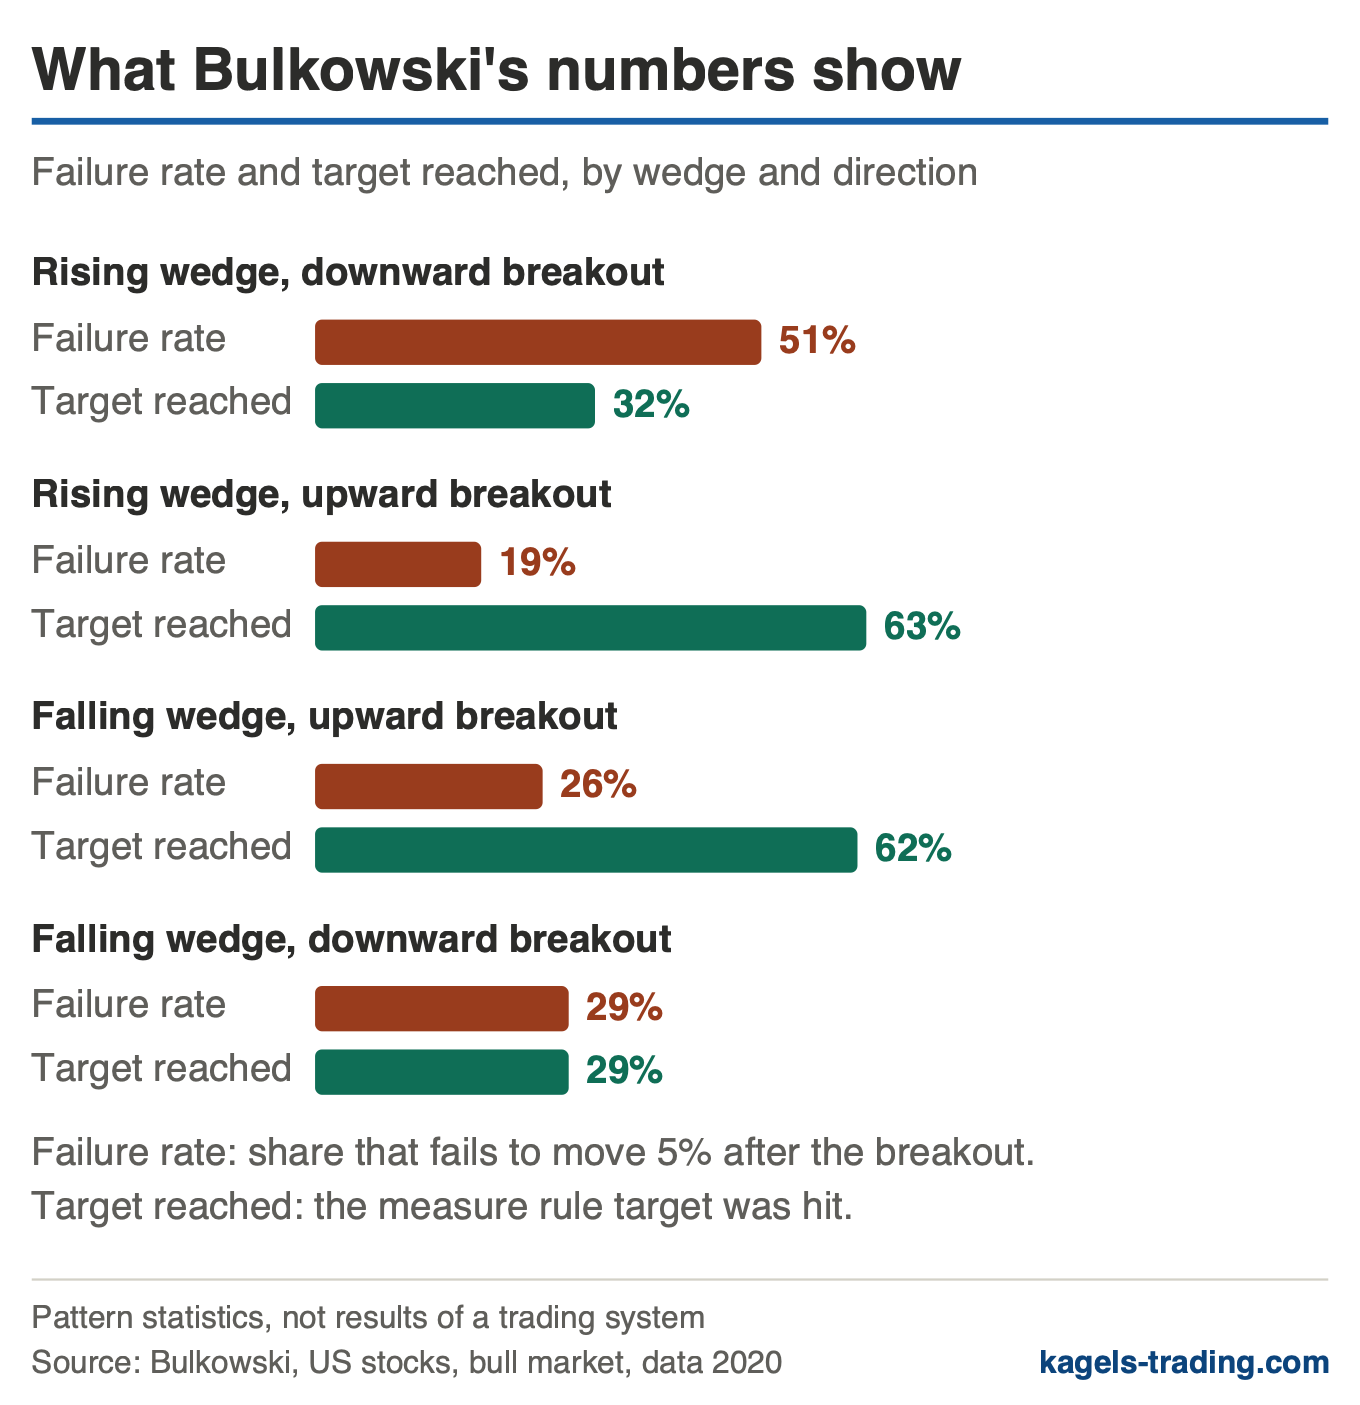
Bulkowski’s break even failure rate is the share of patterns that do not move at least 5% in the breakout direction after the breakout.
The downward breakout from a rising wedge is the weak spot. Every second one fails at this 5% hurdle, only about a third reach the price target, and among all bearish patterns it ranks last. Bulkowski writes that rising wedges, especially with downward breakouts, are some of the worst performing chart patterns. The falling wedge does better: three out of four upward breakouts clear the 5% hurdle, and almost two out of three reach the target. In the ranking it still comes only 31st out of 39.
The surprise is the breakout against the textbook. If a rising wedge breaks out upward, it fails in only 19% of cases according to Bulkowski’s rising wedge page, and 63% reach the target. Here the rarer case is the stronger one. For a falling wedge with a downward breakout, the values are 29% failure rate and 29% of targets reached. In practice this means: do not commit to a direction in advance, let the closing price decide. The graphic below shows the failure rate and the target rate for all four cases side by side.
 Click to enlarge
Source: Statistics from Thomas Bulkowski, graphic by Kagels Trading.
What these numbers do not tell you
The statistics have clear limits, and you should know them before you quote them. Bulkowski measures US stocks on daily charts. For currencies, crypto, futures or intraday charts, the sources used here give no comparable figures. The statistics were last updated on August 27, 2020; I checked every figure on this page against his pages on November 12, 2026. A bull market in his work means everything outside the two big bear markets of 2000 to 2002 and 2007 to 2009.
I leave out the average rise on purpose. Bulkowski measures it after the fact, from the open on the day after the breakout to the later extreme price, which nobody knows in advance when trading. Failure rate and target rate describe how often certain price levels were reached. They do not show whether your stop would have been hit first. Both are pattern statistics, not results of the trading plan described here. If you want to measure how well a pattern works in your own market, our guide to backtesting shows how.
How to trade a rising wedge and a falling wedge
Trading a wedge comes down to three questions: where do I enter, where is my stop, where do I take profit? The rules apply to both wedges and both directions. On the long side you trade the breakout upward, on the short side the breakout downward.
Entry: at the breakout or on the return
A breakout from a wedge is only confirmed when a candle closes outside one of the two trendlines.
A wick through the line is not enough. Bulkowski advises waiting for a close outside the line before taking a position. The ChartSchool adds that it is sometimes prudent to wait for a break of the last reaction high in a falling wedge, or of the last reaction low in a rising wedge. That gives you an extra confirmation and a later entry. Whether it filters out enough false breakouts in your market is something only your own test can show. More on breakouts in general is in our guide to breakout trading.
In Bulkowski’s terms, a throwback is a return to the breakout price within 30 days after an upward breakout, and a pullback is the same after a downward breakout.
The frequent return offers a second entry, but no proven advantage. In both wedges price came back to the breakout point in 62% to 74% of cases. If you do not enter at the breakout, you wait on the long side for the dip back to the broken upper line, and on the short side for the bounce back to the broken lower line. The signal is a candle that closes there in the breakout direction again: on the long side above its open, on the short side below it. You enter at the open of the next candle. The price you pay is that you miss the breakouts that run on without a return. For the rising wedge Bulkowski also writes that throwbacks and pullbacks hurt performance. Note that this pullback is a return to a broken line, not the trend pullback described in our guide to pullback trading, although the entry logic is similar.
Stop: beyond the last swing inside the wedge
The stop belongs where the pattern would be proven wrong. On the long side, after a breakout above the upper line, it goes below the last low inside the wedge. On the short side, after a breakout below the lower line, it goes above the last high inside the wedge. This applies to both wedges, including breakouts against the textbook. Place it just beyond the level, not on it. A stop does not guarantee a price: if price gaps over it overnight, it is filled at the next tradable price. If you enter on the return, you can place the stop below the low of the return on the long side, or above its high on the short side. How to place the order correctly is explained in our guide to the stop-loss order.
Target: the measure rule
The measure rule for chart patterns is a rule of thumb that derives a minimum target for the move after the breakout from the height of the pattern.
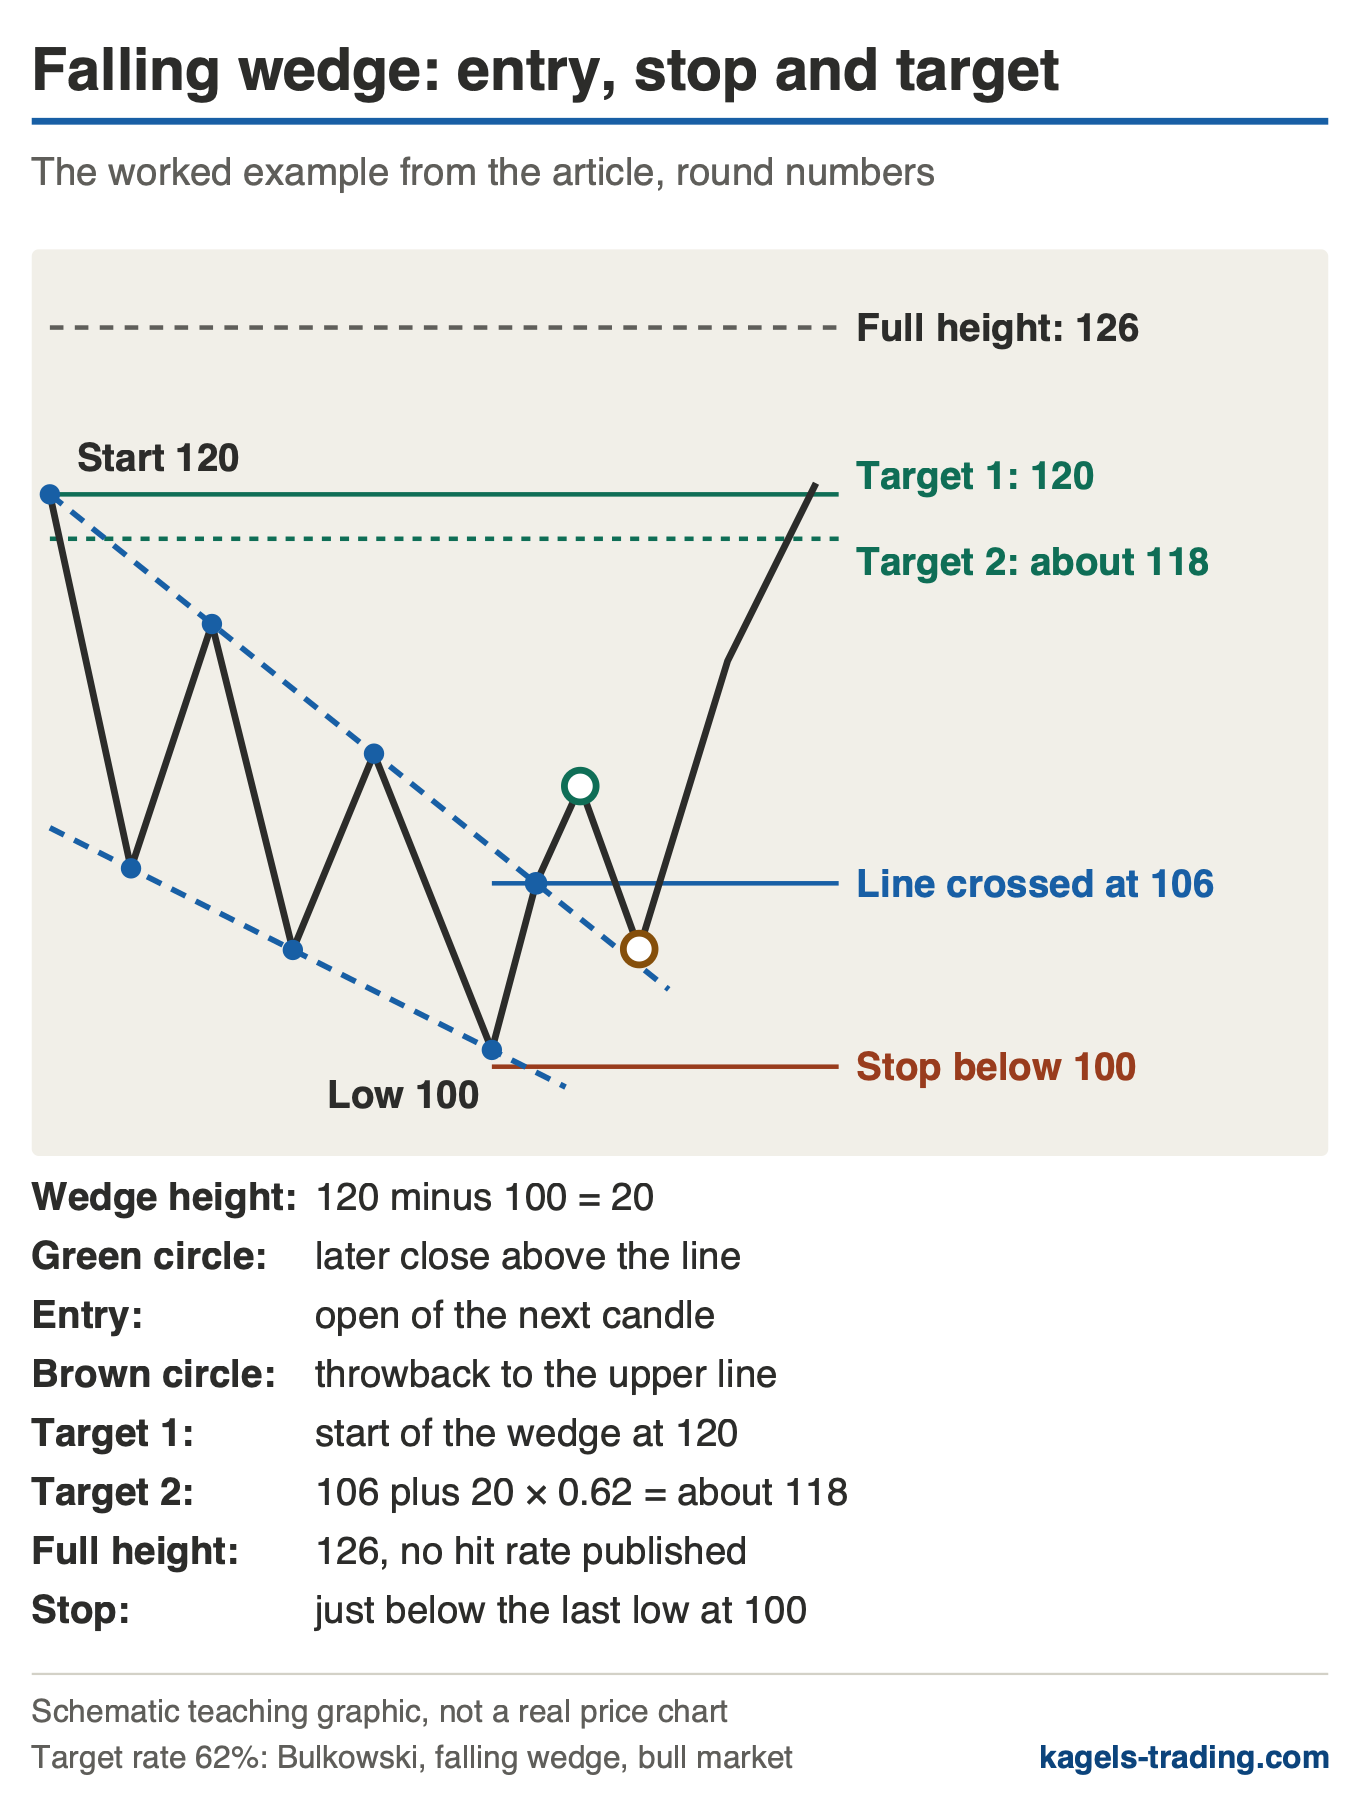
For wedges there are two common versions. For the falling wedge Bulkowski uses the highest high in the pattern as the price target, that is, the starting point of the wedge. For the rising wedge with a downward breakout it is the lowest low. As a second version he measures the height of the wedge from the highest high to the lowest low, multiplies it by the share of targets reached and adds or subtracts the result from the breakout price. For breakouts against the textbook, Bulkowski gives no target at the starting point. There the second version applies with the matching rate: 0.63 for a rising wedge breaking upward, 0.29 for a falling wedge breaking downward. The ChartSchool says there is no measuring technique for the rising wedge and advises deriving the target from other levels.
A worked example with round numbers shows how far apart the versions are. A falling wedge starts at a high of 120, and its lowest low is 100, so the height is 20. Price crosses the upper line at 106, Bulkowski’s breakout price for the calculation, and a later candle closes above the line, which confirms the breakout. The target at the starting point is 120. The second version gives 106 plus 20 times 0.62, about 118. The full wedge height added to the breakout would give 126, but Bulkowski gives no hit rate for that target. Whether the trade is worth it you check with the risk-reward ratio. The graphic below shows the example with breakout, throwback, stop and both targets.
 Click to enlarge
Source: Measure rule and target rate from Thomas Bulkowski, graphic by Kagels Trading.
Volume: more important in the falling wedge
In a falling wedge, rising volume at the breakout is a good sign. The ChartSchool calls it an essential ingredient, and Bulkowski writes that upward breakouts with heavy volume on the breakout day perform better. For the rising wedge the ChartSchool sees volume as less important, but it treats rising volume at the break of the lower line as confirmation. In the forex market there is no central volume; most charting software shows only the number of price changes (tick volume). How to read volume on a chart is explained in our guide to volume analysis.
A possible trading plan in five steps
The steps below sum up the rules. They are one possible trading plan, not a tested system. Each step applies on the long side as well as on the short side:
- Check the pattern: both lines point the same way, converge and have at least five touches between them. On a daily chart the pattern lasts at least three weeks.
- Wait for the breakout: a candle closes outside, on the long side above the upper line, on the short side below the lower line. The direction of the wedge alone is no reason to take a position.
- Choose the entry: at the open of the next candle, or on the return. There only once a candle at the broken line closes back in the breakout direction, on the long side above its open, on the short side below it, and then at the open of the following candle.
- Set the stop: on the long side just below the last low inside the wedge, on the short side just above the last high inside the wedge.
- Set the target: in the textbook cases, so a falling wedge breaking up and a rising wedge breaking down, it is the starting point of the wedge. In the opposite cases you take the wedge height times 0.63 (rising wedge breaking up) or times 0.29 (falling wedge breaking down) from the breakout price, upward on the long side and downward on the short side. If the distance to that target is not enough for a sensible ratio to the stop, you skip the trade.
False breakouts and failed wedges
A failed wedge (busted pattern) is one where price moves no more than 10% in the breakout direction, then turns and closes on the opposite side of the pattern.
With a pattern that fails this often, the failure itself is information. For the falling wedge Bulkowski describes a sequence that happens now and then: price breaks out downward, then curls around the tip of the wedge and rises strongly. He calls this a profit opportunity on the long side. For the rising wedge the mirror case is possible: a downward breakout fails, price returns into the wedge and breaks out above the upper line. The numbers on upward breakouts above apply to all upward breakouts and say nothing about this particular sequence.
You recognize a false breakout by the close, not by the wick. If the candle after the breakout closes back inside the wedge, the breakout is in doubt, but the wedge has not failed yet. It has failed only once price closes on the opposite side. Short pokes through a line can trigger stops. From the chart alone, though, you cannot tell which orders were filled or what caused the move. How such moves unfold is explained in our guides to the liquidity sweep and to the bull trap and bear trap.
Another hint is where the breakout happens. According to Bulkowski, breakouts from a falling wedge come on average after 61% to 62% of the way to the apex, and upward breakouts from a rising wedge after 67%. If price runs far beyond that, almost into the tip, the pattern no longer behaves typically. Then check whether it is still a wedge or already a sideways range, as described in our guide to range trading.
Related patterns: Wolfe wave, broadening wedge and flag
The wedge has relatives that look similar but are read differently. The table separates them so you can name the right pattern on the chart:
| Pattern | Difference to the wedge |
|---|---|
| Wolfe wave | Five waves inside a wedge, with its own target line from point 1 to 4 |
| Broadening wedge | The lines move apart instead of together |
| Flag | Parallel lines against the trend, shortly after a strong move |
The Wolfe wave is a special form of the wedge with a fixed wave count. It counts five turning points and derives the target from the line through points 1 and 4. The broadening wedge, called ascending or descending broadening wedge by Bulkowski, widens instead of narrowing. The flag runs parallel and against the trend. You draw the lines themselves with the rules from our guide to trendline trading.
Pros and cons of the wedge pattern
The wedge is a useful tool as long as you do not read it as a forecast of direction. The lists sum up what its construction and Bulkowski’s numbers show.
What speaks for the wedge pattern:
- Clear levels: the lines, the last high and the last low give you entry and stop.
- Early warning: the narrowing shows fading strength before the trend breaks.
- Second chance: in 62% to 74% of cases price returns to the breakout point.
- Falling wedge holds up: in Bulkowski’s bull market study 68% upward breakouts, and three out of four clear the 5% hurdle.
What speaks against it:
- Uncertain direction: the rising wedge breaks out upward in four out of ten cases.
- Weak downward breakout: in Bulkowski’s bull market study every second one fails to move 5%, rank 36 out of 36.
- A matter of judgment: where the lines go is up to the person drawing them, and two traders see two different wedges.
- Narrow data: the figures used here apply only to US stocks on daily charts.
Conclusion: the wedge shows fading strength, the breakout shows the direction
The wedge pattern describes very well what is happening in the market: a move is losing momentum. That is valuable information, because it warns you before the trend breaks. It is not a reliable forecast of direction, especially not the rising wedge.
At one point the numbers clearly contradict the common teaching. The falling wedge mostly delivers what it promises. The rising wedge with a downward breakout, on the other hand, misses even the 5% mark in every second case, while its rarer upward breakout does well. That comes from US stocks in bull markets, but it is enough to drop the idea of a reliable sell signal.
So this is how I would use the wedge: as a hint where to look, not as a signal. Wait for the close outside the line, take the return as a second chance and put the stop beyond the last swing inside the wedge. If the breakout fails, that is more than a nuisance: Bulkowski explicitly sees an opportunity in the opposite direction in a failed falling wedge. The fine-tuning of the entry comes from price action.
This is market education, not investment advice. Every trade can lose money, and pattern statistics from the past do not tell you what the next wedge will do.
Frequently asked questions about wedge patterns
What is a wedge pattern in trading?
A wedge pattern is a chart pattern made of two trendlines that point the same way and converge. If the wedge points up, it is a rising wedge; if it points down, it is a falling wedge. The narrowing shows that the current move is losing momentum.
Is a rising wedge bullish or bearish?
The rising wedge counts as bearish, but the statistics are only narrowly on that side. According to Thomas Bulkowski it breaks out downward in 60% of cases. Of those downward breakouts, 51% fail to move 5%, while for the rarer upward breakouts it is only 19%. The figures apply to US stocks in bull markets.
Is a falling wedge bullish?
Yes, the falling wedge counts as bullish and confirms it in the statistics more often than its twin. Bulkowski counts 68% upward breakouts in his bull market study. Three out of four of them move at least 5% further, and almost two out of three reach the price target at the start of the wedge.
What is the difference between a wedge and a triangle?
In a wedge both lines point the same way, in a triangle they do not. A triangle has either one flat side or two lines that come together from above and below. A rising wedge has rising highs and rising lows, an ascending triangle has a flat upper line.
How do you calculate the target of a wedge?
In the two textbook cases the starting point of the wedge is the target. For a falling wedge breaking upward that is the highest high in the pattern, for a rising wedge breaking downward the lowest low. Alternatively you measure the height of the wedge, multiply it by the share of targets reached and add or subtract it from the breakout price. This version also works for breakouts against the textbook.
Does the wedge pattern work in forex and crypto?
You can draw the pattern in any market, but the numbers used here apply only to US stocks. Bulkowski’s figures come from stocks on daily charts. For currencies, crypto and intraday charts, the sources used here give no comparable figures, and the forex market also lacks real volume.
This article is translated from the German edition on kagels-trading.de.
More Chart Techniques guides
- Draw key levels
Support and Resistance: How to Draw and Use Key Levels
Where useful levels come from, how to draw zones with a stated rule and how to turn a level into a trade plan.
- Read price action
Price Action Trading: How to Read Charts Without Indicators
Market structure, key zones and three bar patterns, with a core setup and a real SPY example where the signal failed.
- Read candlestick charts
How to Read Candlestick Charts: Body, Wicks and Context
Open, high, low and close in one candle, body and wicks, two real Gold candles read step by step and how often patterns really occur.
- Know candlestick patterns
Candlestick Patterns: 10 to Know, Tested on Real Data
Ten patterns with rules and a cheat sheet, counted on DAX, S&P 500, EUR/USD and Gold since 2014: most are rare, none is a signal on its own.
- Trade the hammer candle
Hammer Candlestick: Spot It, Trade It, Know Its Limits
Three features, the difference to inverted hammer and hanging man, entry and stop, and how rarely the hammer appeared in four markets since 2014.
- Spot a morning star
Morning Star Candlestick: Rules, Real Cases, Limits
Three measurable rules, every morning and evening star in four markets since 2014, and two real cases: one reached its target, one hit its stop.
- Spot a topping tail
Topping Tail Candlestick: Rules, Silver Example and Limits
Six measurable rules for the bearish rejection candle, a silver candle from January 2026 checked step by step, the difference from the shooting star and how to trade it with a stop.
- Combine timeframes
Multi-Timeframe Analysis: A Weekly and Daily Workflow
How to combine the weekly chart for context and the daily chart for entry under one stated rule, with a documented SPY case from June 2025.
- Trade pullbacks
Pullback Trading: Entries, Stops and Failed Setups
Pullback or reversal, limit against confirmation entry, and one fixed rule set on three real QQQ cases: a target, a stop and a cancelled setup.
- Trade sideways ranges
Range Trading: Boundaries, Orders and Two Documented Fades
A 14-session rule to draw horizontal boundaries, three order-type variants and two Alpaca-verified SPY fades, one that reached the target and one that was stopped out.
- Read a consolidation
Consolidation in Trading: What the Range Tells You
What a consolidation is, why 25 years of index data showed no stable direction edge from narrow ranges or the prior trend, and two DAX breakouts from 2026.
- Read chart formations
Chart Patterns: Reversals, Continuations and Failures
Reversal, continuation and bilateral formations with the measured-move convention per pattern and two documented SPY rectangle cases.
- Trade breakouts
Breakout Trading Strategy: Entries and False Breakouts
How often breakouts fell back into the range in our count of 1,472, and how to plan entry, stop and position size.
- Draw and trade trendlines
Trendline Trading: How to Draw Trendlines and Trade Them
How to draw trendlines with a fixed rule, four strategies for bounces, breaks and retests, and a real SPY line break without a lasting reversal.
- Draw a pitchfork channel
Andrews Pitchfork: How to Draw It, Trade It and Test It
Three pivots, a median line and two parallels, Schiff variants, a trade plan and how often price reached the median line in 746 cases.
- Use Fibonacci levels
Fibonacci Retracement Levels: How to Draw and Trade Them
How to calculate and draw retracement levels, trade pullbacks with confluence and a stop at the structure, and what a ten-year test says about the levels.
- Set Fibonacci targets
Fibonacci Extension: Levels, How to Draw It and Calculator
Three-point extension targets from the end of a pullback, why they differ from levels beyond 100%, a free calculator and three SPY swings, one without a single target reached.
- Trade gaps
Gap Trading Strategy: How to Trade Gaps and When Gaps Fill
Opening and full gaps, the four classic gap types, how often SPY gaps filled in our count since 2001, and plans for gap fill and gap and go.
- Calculate pivot points
Pivot Points: Formulas, Types and How to Trade Them
Formulas for standard, Fibonacci, Woodie, Camarilla and DeMark pivots, a free calculator, which session counts and a real SPY day.
- Swing trade
Swing Trading: 4 Strategies, Risk and Real Examples
Four swing trading strategies on the daily chart, position size, gap risk and US rules, with two hypothetical SPY pullbacks: one hit its target, one was stopped out.
- Identify market stages
Stage Analysis: Stan Weinstein's Four Market Stages
Stan Weinstein's four stages on the weekly chart, a Stage 2 checklist and two TSMC breakouts: one ran for a year, one gapped through its stop.
- Read Kagi charts
Kagi Charts: Reversal Amount, Shoulders and Signals
One line, one reversal amount, thick yang and thin yin: tested on DAX hourly data and compared with Renko and point and figure.
- Screen for growth leaders
CAN SLIM: William O’Neil’s Seven Rules for Growth Stocks
William O'Neil's seven CAN SLIM criteria with thresholds, his selling rules, a free screen with real counts and what the tests really show.
- Read Wyckoff ranges
Wyckoff Method: Accumulation, Distribution and Springs
Accumulation and distribution with phases A to E, springs and upthrusts as optional tests, and two real TSMC ranges read with and without hindsight.
- Trade Darvas boxes
Darvas Box Strategy: Rules, Entries and Stop Losses
The box rules step by step, when the edges become known, where the stop goes, and a mechanical test on TSMC in 2024 with two honest results.
- Count Elliott waves
Elliott Wave Theory: Rules, Patterns and Fibonacci
The five-wave pattern, three hard rules, zigzags, flats and triangles, Fibonacci ratios and a real DAX count, from the first German translator of the standard work.
- Understand Smart Money Concepts
Smart Money Concepts (SMC): What They Are and What Holds Up
The seven SMC building blocks, BOS vs CHoCH vs MSS, one labeled SPY sequence that held, one that failed, and what a chart can and cannot show.
- Understand ICT trading
ICT Trading: Silver Bullet, Killzones and What Holds Up
Michael Huddleston's Inner Circle Trader method: Silver Bullet, Judas Swing, the 2022 model and killzones in New York time, with one SPY setup that worked and one that failed.
- Trade order blocks
Order Blocks: How to Spot, Draw and Trade the Zone
The three conditions behind a valid order block, entry and stop at the zone, two SPY cases from 2026 and a 25-year count where a fixed rule lost money.
- Trade fair value gaps
Fair Value Gap (FVG): How to Spot, Trade and Test It
The three-candle rule, bullish, bearish and inverse FVG, two SPY cases from 2026 and a 25-year count of how often gaps were revisited and traded.
- Trade inverse fair value gaps
Inverse Fair Value Gap (IFVG): Rules, Examples and a Test
When a broken gap counts as inverted, three entry styles, one SPY retest that held, one that failed, and a 25-year test with trend and sweep filters.
- Trade failed breakouts with Turtle Soup
Turtle Soup Trading: Raschke Rules, ICT Version and a Test
Linda Raschke's original rules, Turtle Soup Plus One and the ICT version side by side, two SPY examples and a 25-year test on SPY and QQQ.
- Read a break of structure
Break of Structure (BOS): Rules, CHoCH vs MSS and a Test
Which swing counts, BOS vs CHoCH vs MSS under one stated convention, two SPY breaks that won and lost, and a 25-year test against ordinary days.
- Read a change of character
Change of Character (CHoCH): Rules, BOS vs MSS and Data
The first close against the trend, close versus wick, CHoCH vs BOS vs MSS, two SPY cases and what the trend did next after 287 CHoCHs on SPY and QQQ.
- Read a market structure shift
Market Structure Shift (MSS): Rules, BOS vs CHoCH and Data
MSS as a CHoCH with a sweep and a fair value gap, the comparison with BOS and CHoCH, two 2021 cases and what 14 daily MSS on SPY and QQQ did next.
- Draw supply and demand zones
Supply and Demand Trading: Zones, Rules and Real Data
Base and departure rules, the four base patterns, how zones differ from order blocks and SMC, two SPY cases and a fixed test of 86 zone trades on SPY and QQQ.
- Read liquidity sweeps
Liquidity Sweep: How to Spot It and Trade the Reversal
Sweep or run, buy-side and sell-side liquidity, internal and external targets, SPY reversal, continuation and failed-reversal examples and a 25-year count of a fixed sweep rule.
- Spot bull and bear traps
Bull Trap vs Bear Trap: How to Spot a Trapped Market
What bull traps and bear traps are, the two signs of trapped traders, how to trade the reversal with a defined stop, and two real SPY examples from 2025.
- Interpret volume
Volume Analysis in Trading: How to Read Volume Honestly
What volume counts in stocks, futures, forex and crypto, how to read it against its own average, and our SPY test of high-volume days since 2001.