
Dow Jones Forecast: Levels and Scenarios for Traders


This analysis is from 3 October 2026. Prices have moved since, so the levels below may no longer apply until the next update.
The Dow Jones is holding the zone between 50,500 and 51,000 points, but on Friday it bounced off the downtrend line from the September high once more. Below wait the 200-day line and the 50,000 mark. JPMorgan opens the reporting season on 13 October, with US consumer prices a day later.
Dow Jones forecast in 30 seconds
The situation
Downtrend since the September high at 53,746 points. On Friday the index failed at the downtrend line again and closed at 51,177, below the 20, 50 and 100-day lines.
The level that has to hold
The Q3 low at 50,906. A daily close below it opens the way to the Q1 high at 50,513 and the 200-day line at 50,274.
Next target to the upside
First a daily close above the downtrend line, then the 20-day line at 51,855 and the 100-day line at 52,056.
What comes next
JPMorgan results on 13 October, US consumer prices on 14 October, the Fed decision on 28 October. Next review with the next charts, earlier if a level breaks.
On this page
- Dow Jones forecast in 30 seconds
- The Dow Jones Friday, 2 October 2026: the downtrend line from the September high
- In the daily chart: below three moving averages
- The three paths and when they fail
- The weekly picture: support between 50,500 and 51,000 points
- What could move the Dow Jones next
- The longer view: a reversal bar in the quarterly chart
- Very long term: the yearly chart
- Conclusion: the decision falls between 50,000 and 51,000 points
- How this forecast is made
- Frequently asked questions about the Dow Jones forecast
- Please note
The Dow Jones Friday, 2 October 2026: the downtrend line from the September high
 Click to enlarge
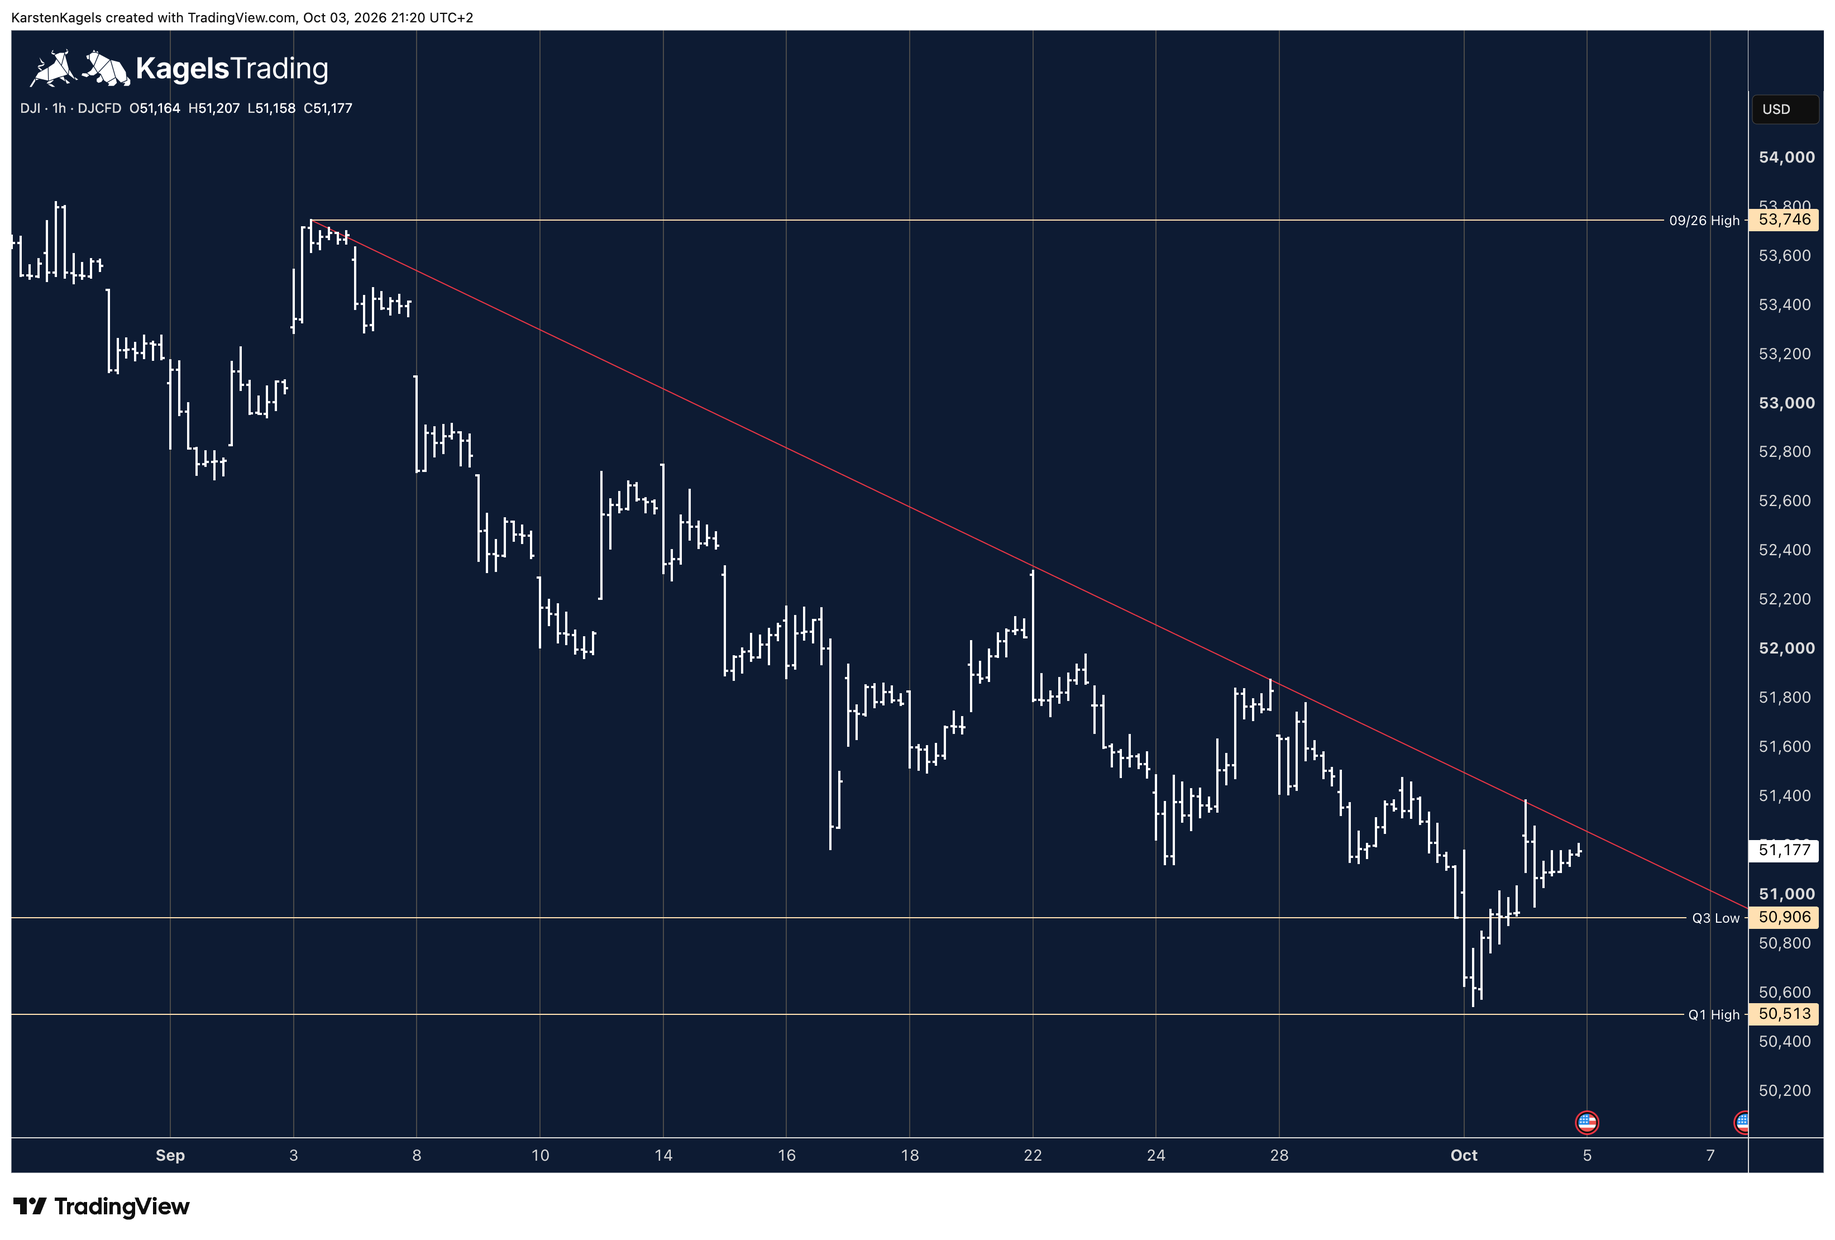
Since the September high at 53,746 points the Dow has been in a textbook downtrend. The hourly chart above shows lower highs, lower lows and a downtrend line above them that has stopped every recovery so far.
On Friday the market ran into the line again. It bounced off it at 51,383. The week closed at 51,177 points, below the line, so on a closing basis it has not been crossed.
Below the market the picture has improved. The down move ended on Thursday, 1 October, at 50,547 points, just above the high of the first quarter at 50,513. From there the index regained the low of the third quarter at 50,906, which now sits below the market again.
In the hourly chart everything therefore comes down to the downtrend line. As long as it caps the market, the downtrend stays intact.
In the daily chart: below three moving averages
 Click to enlarge
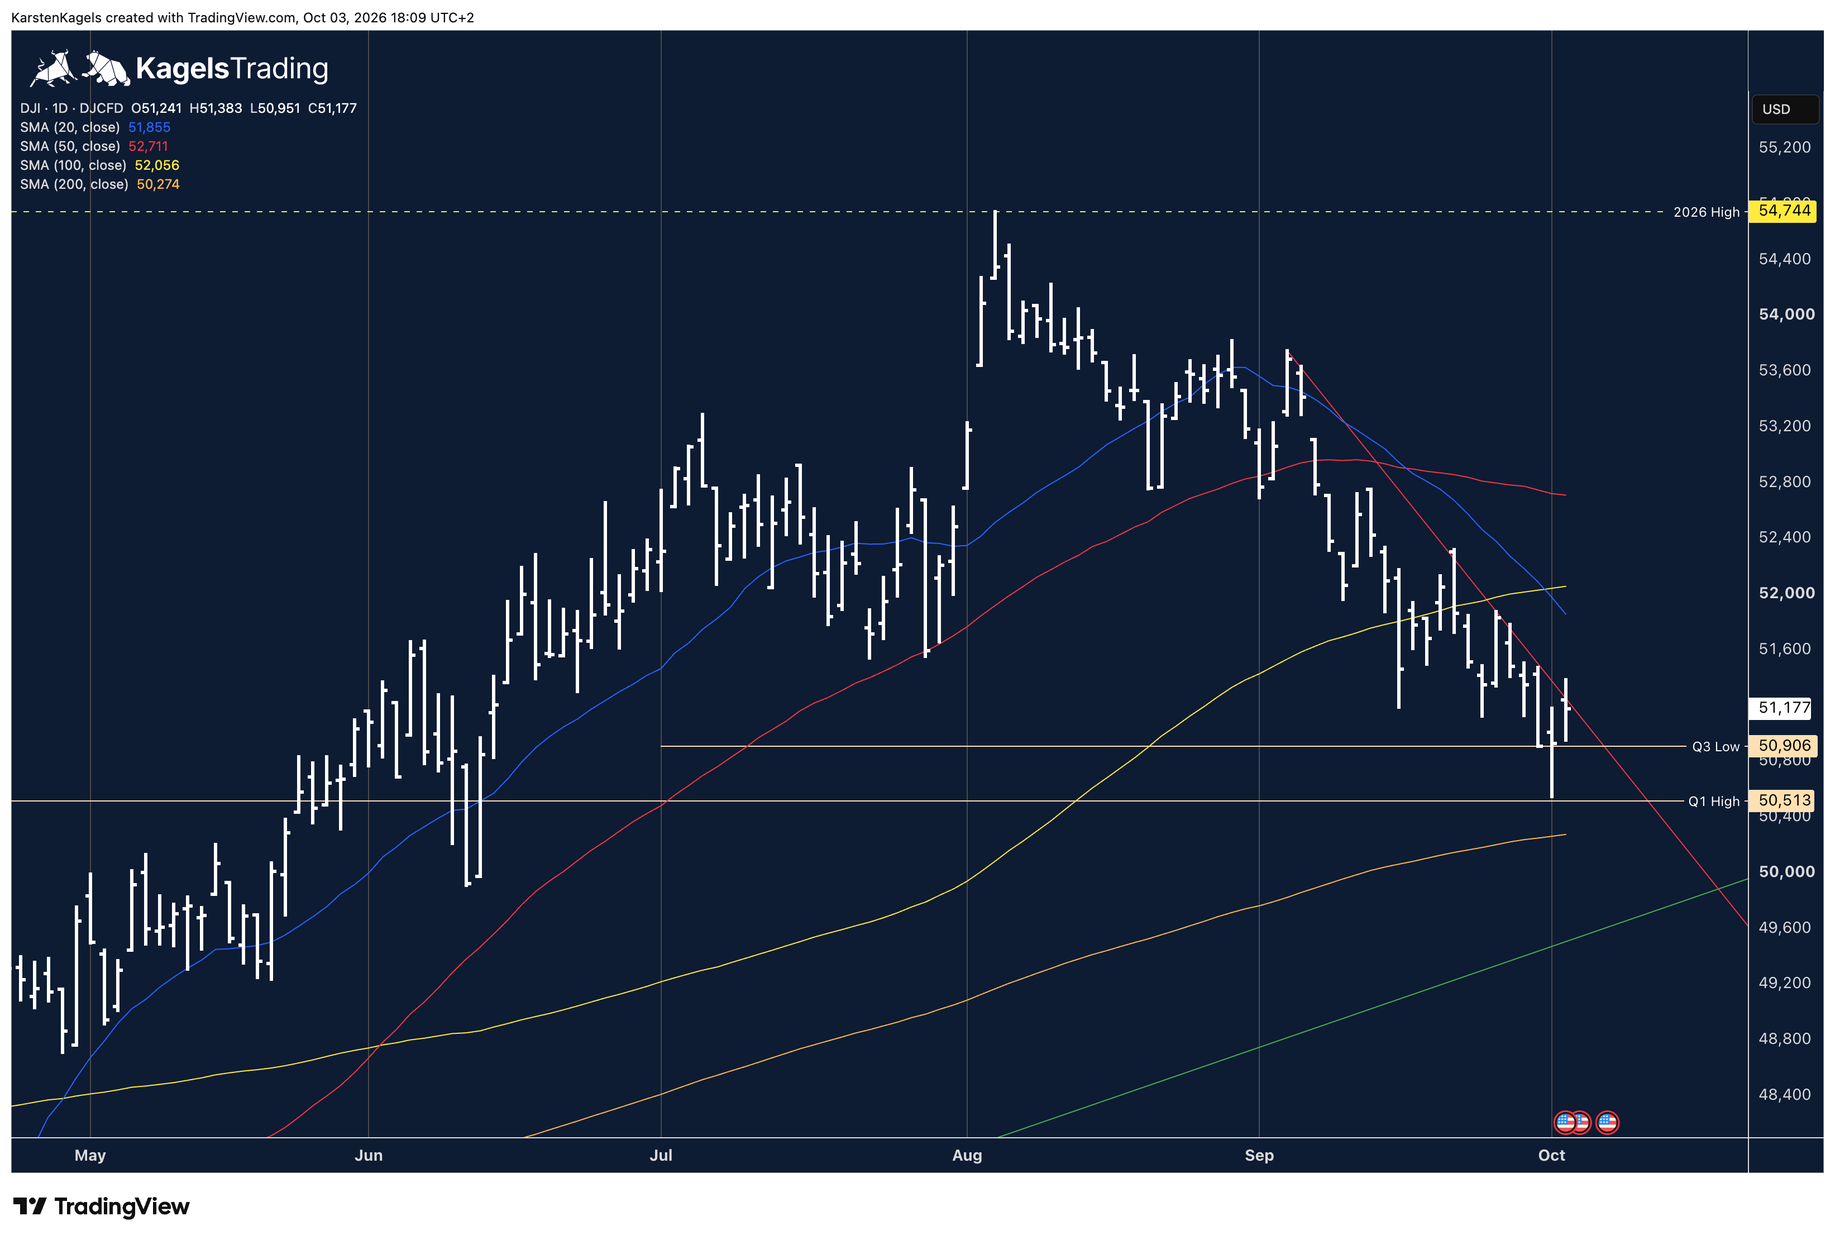
One time frame higher the moving averages come in. The Dow Jones trades below three of them: below the 20-day line at 51,855, the 100-day line at 52,056 and the 50-day line at 52,711 points. The 20-day line is now falling clearly.
Friday in the daily chart: open at 51,241, low at 50,951. With its high at 51,383 the bar reached briefly above the downtrend line, but the close at 51,177 is back below it and above the Q3 low at 50,906. A daily close above the line is therefore still missing.
The next line below is the 200-day line at 50,274 points. It is the obvious price target of the current down move and only 903 points or 1.8 percent away. Before it comes the Q1 high at 50,513, where the move already turned once on Thursday.
How the other two big US indices stand is shown in the S&P 500 forecast and the Nasdaq 100 forecast.
Resistance
- 52,056
- 51,855
Support
- 50,906
- 50,513
- 50,274
The three paths and when they fail
Two conditions describe the next move, a third describes waiting. Each one names what has to happen and what takes it off the table. They are orientation levels, not order rules.
What counts is the daily close in the daily chart shown above. A daily close beyond the level named confirms a scenario, and a following daily close back on the other side takes it off the table. Intraday spikes without a close do not count, and the weekly close comes on top as extra confirmation, not as a second definition.
Bullish: above the downtrend line
Condition: a daily close above the downtrend line from the September high. The 20-day line at 51,855 and the 100-day line at 52,056 are then the next hurdles. The path is off the table on a following daily close back below the line.
Wait: between the trend line and the Q3 low
Condition: as long as the daily closes stay between the downtrend line and 50,906, there is no confirmed signal. That was the position on Friday, and it is a valid result: no setup is a result too.
Bearish: below the Q3 low at 50,906
Condition: a daily close below 50,906. The Q1 high at 50,513, the 200-day line at 50,274 and below that the uptrend line since the April 2025 low in the weekly chart then come into focus as targets. The path is off the table on a following daily close back above 50,906.
The weekly picture: support between 50,500 and 51,000 points
 Click to enlarge
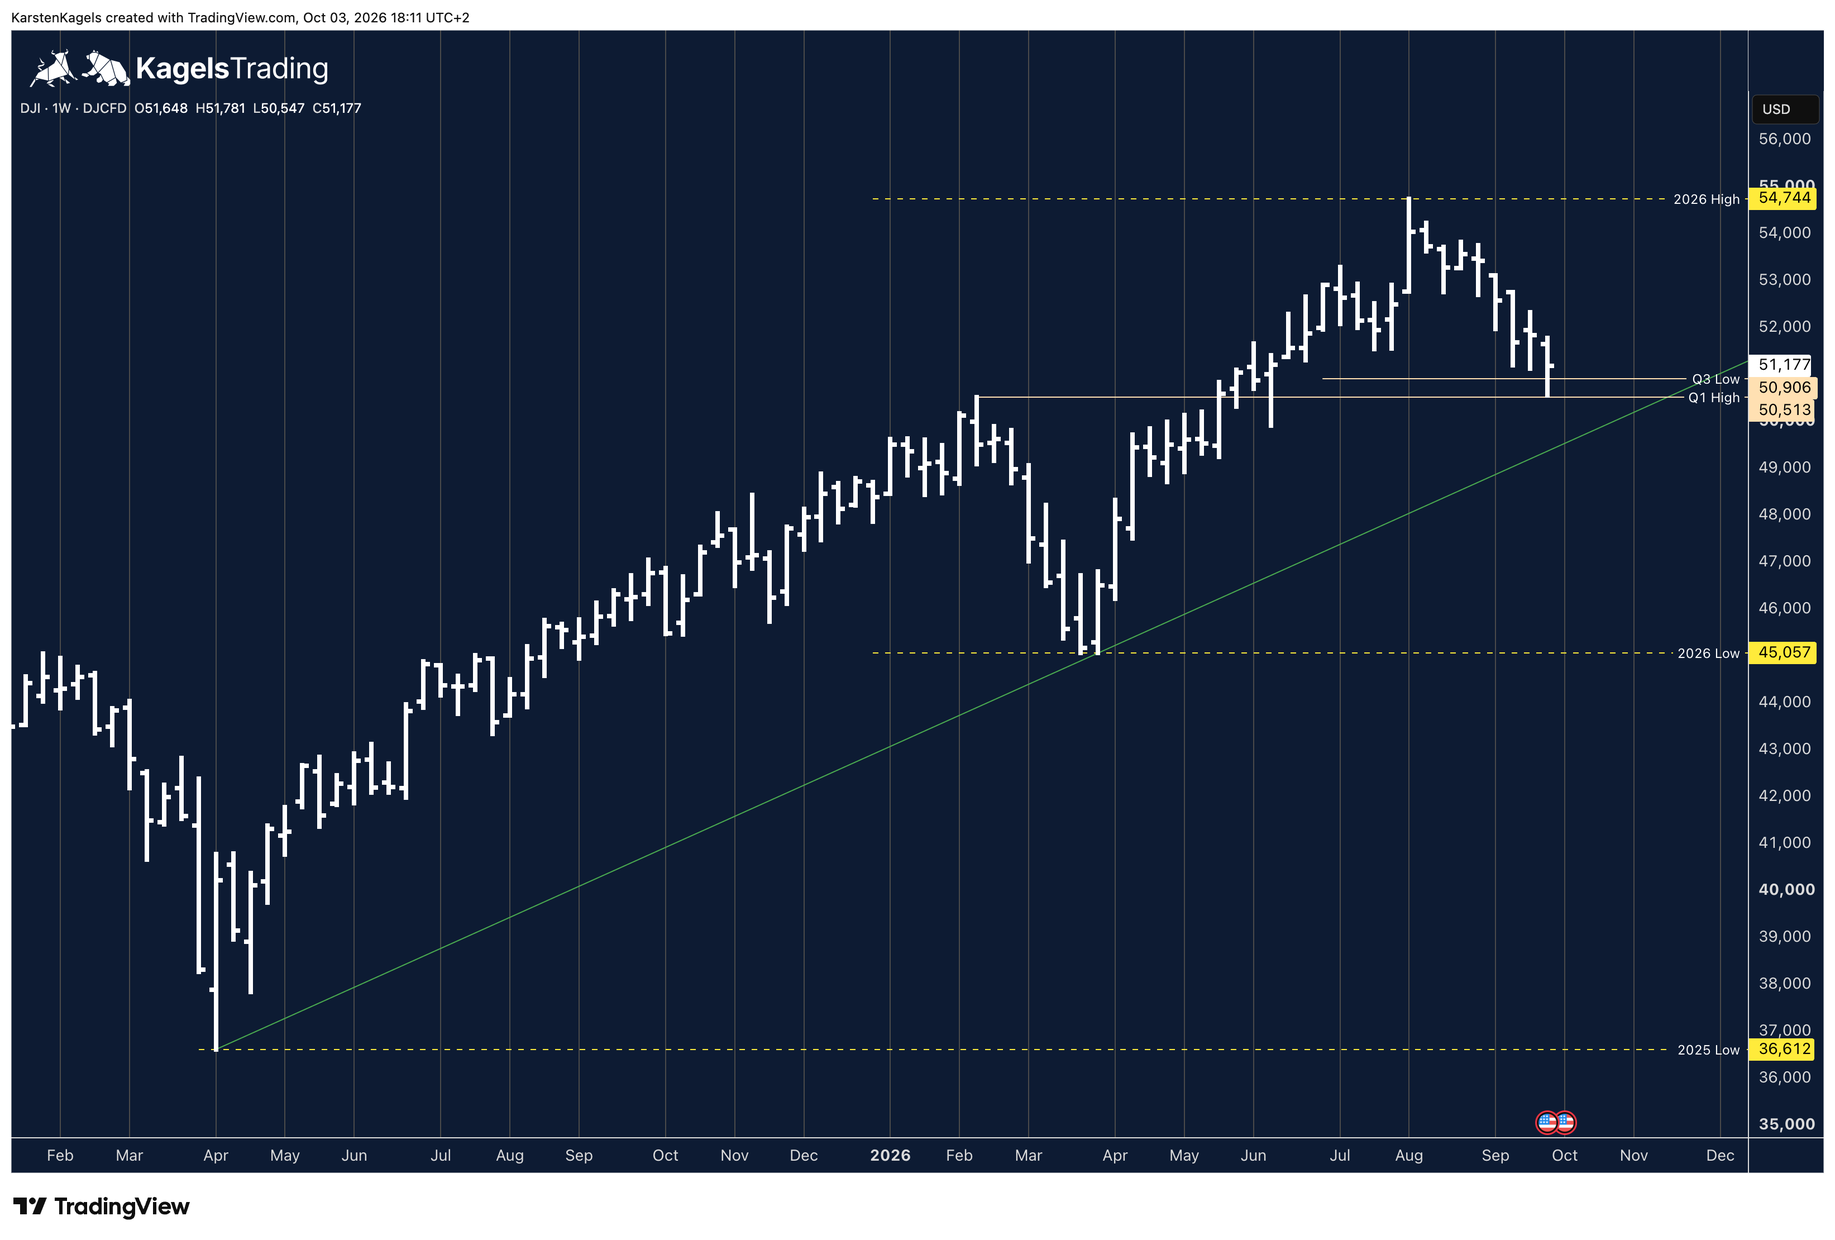
The weekly chart above shows the down move of the past weeks. Since the week of the all-time high at 54,744 points in August, six of eight weeks closed lower than the week before. The week to 2 October opened at 51,648, fell to 50,547 and closed at 51,177 points.
The market found support in the area between 50,500 and 51,000 points. Two quarterly levels sit close together there: the high of the first quarter at 50,513 and the low of the third quarter at 50,906.
Below that runs the uptrend line since the April 2025 low. It carries the whole rise from 36,612 points to the all-time high and, next to the 200-day line, is the second possible price target if the zone between 50,500 and 51,000 does not hold.
What could move the Dow Jones next
These dates are coming up in the next weeks. They are occasions to read the chart again, not a forecast of a particular reaction.
Monday, 12 October: Columbus Day. The New York Stock Exchange trades as normal (NYSE holidays and trading hours).
Tuesday, 13 October, around 7:00 am New York time (13:00 CEST): JPMorgan Chase, a member of the Dow Jones, reports its third-quarter results (JPMorgan Chase announcement of 17 September 2026).
Wednesday, 14 October, 8:30 am New York time (14:30 CEST): US consumer prices for September (BLS release schedule).
Wednesday, 28 October, 2:00 pm New York time (19:00 CET): the Fed's interest rate decision after the meeting of 27 and 28 October (FOMC calendar). Europe is already back on winter time that week, the US is not yet, so the gap is one hour shorter than usual.
The longer view: a reversal bar in the quarterly chart
 Click to enlarge
This part is written for readers who look beyond the next few days. It is reviewed at the start of the month, not daily.
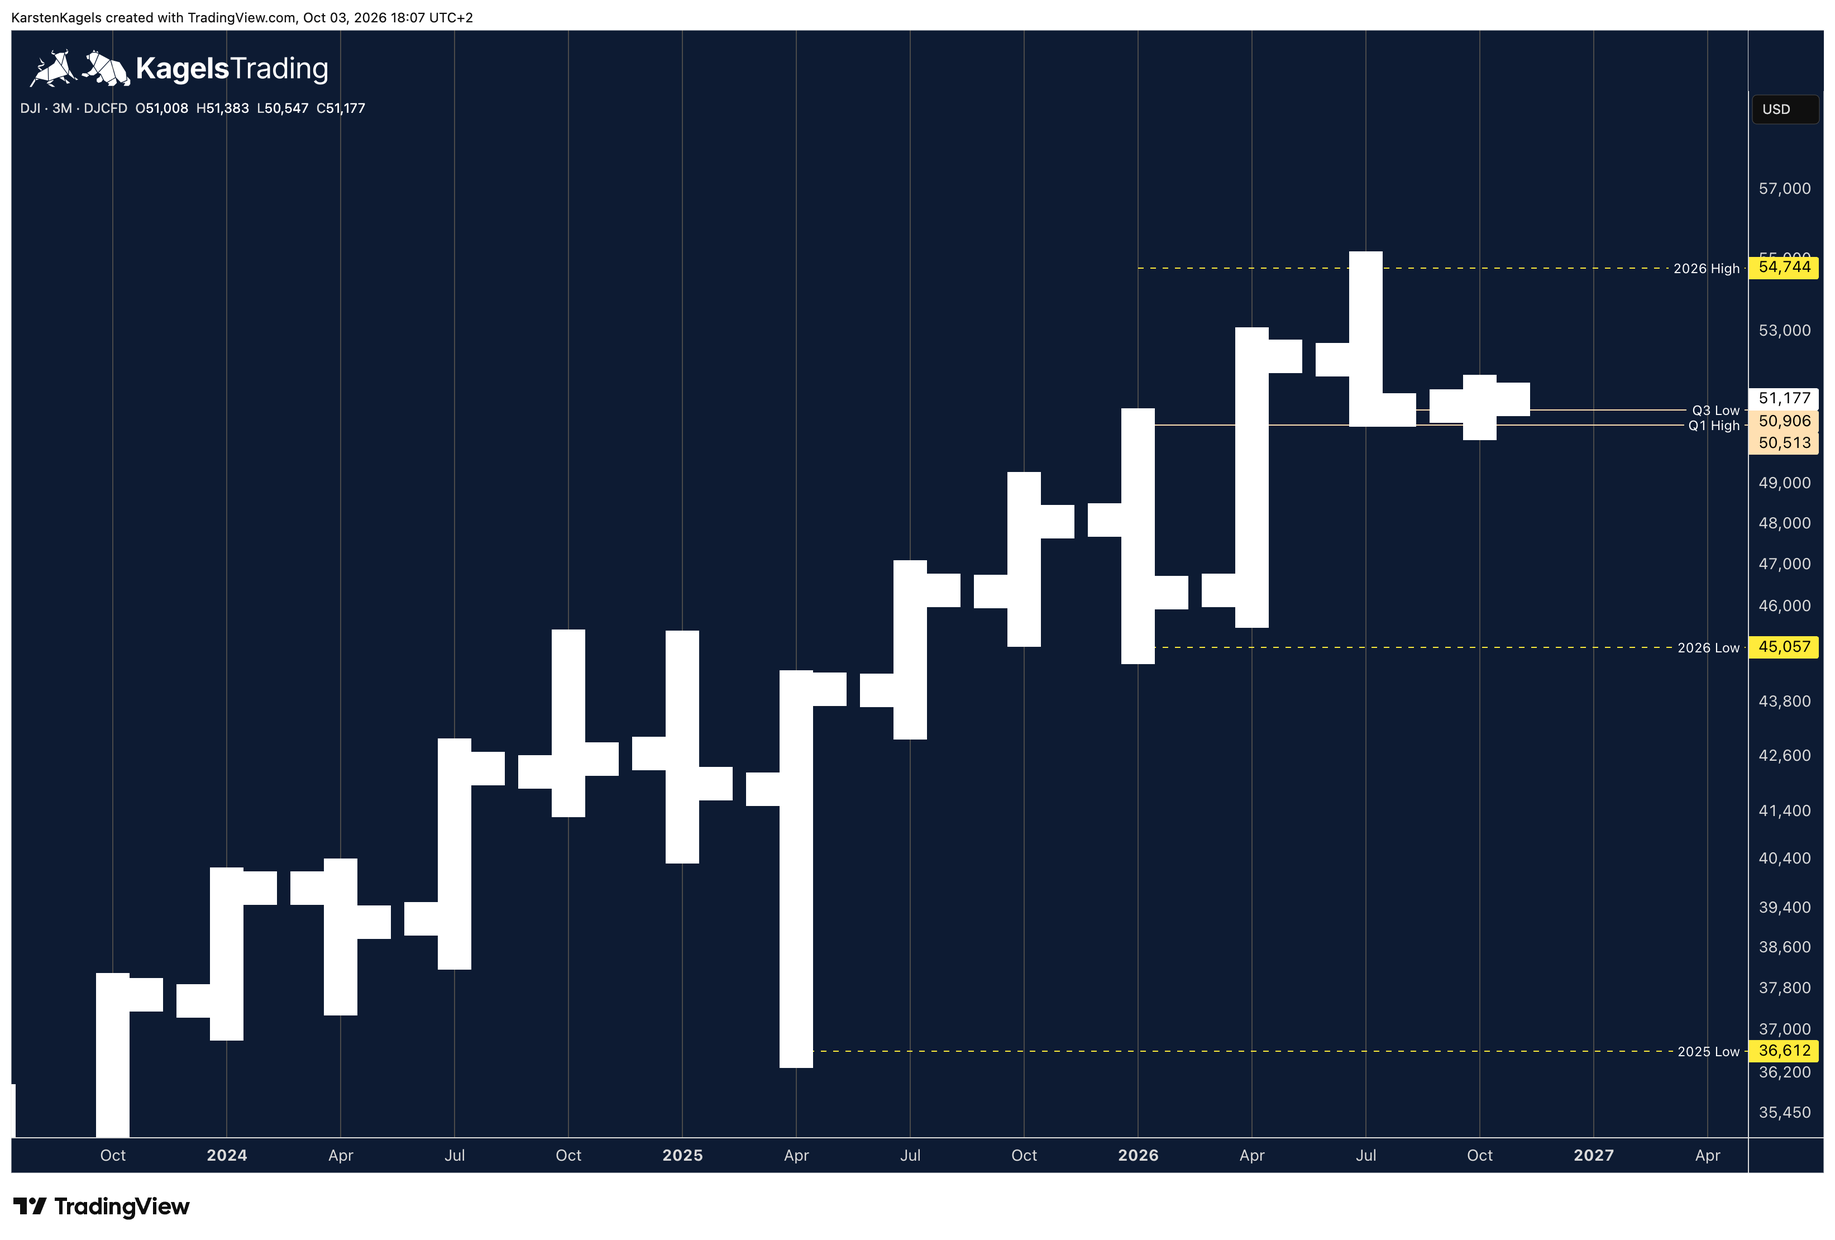
The quarterly chart shows where the market comes from. From the 2025 low at 36,612 points the Dow Jones rose to the all-time high at 54,744 points, a gain of about 50 percent since spring 2025.
The counter move came in the third quarter of 2026. The index ran to the all-time high in the summer and fell back clearly by the end of the quarter; the bar closed near its low at 50,906 points. In the quarterly chart this correction shows up as a reversal bar: a new high and a close far down in the range.
The fourth quarter briefly undercut the low of the third. On 1 October the index found support at 50,547, just above the high of the first quarter at 50,513. From Friday's close the all-time high is still about 7 percent away.
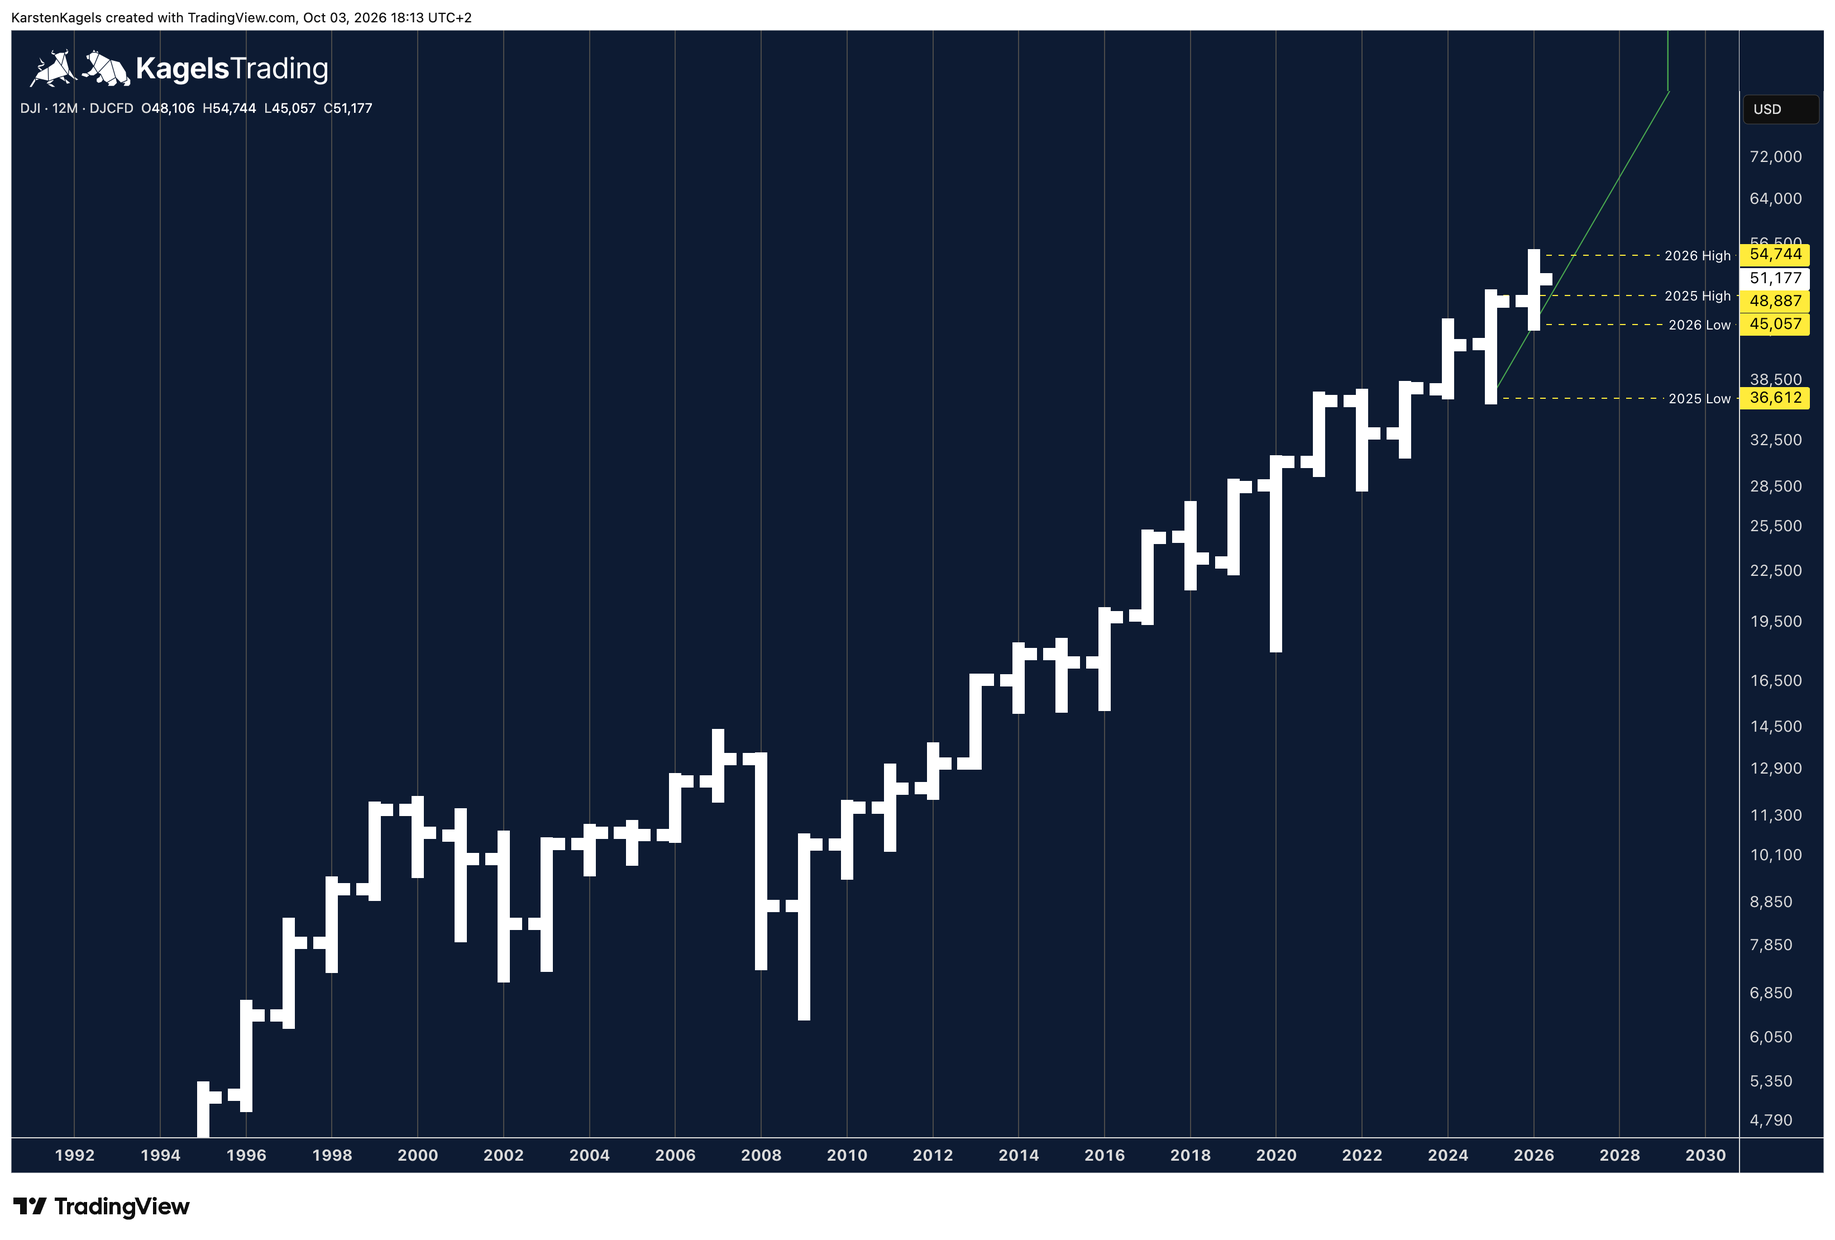
Very long term: the yearly chart
 Click to enlarge
Over the very long run the correction changes little. In the yearly chart on a logarithmic scale the long-term uptrend of the Dow Jones is still intact. In the current correction since the all-time high the index has not yet reached the previous year's high at 48,887 points; it sits 2,290 points or 4.5 percent below Friday's close.
The psychologically important 50,000 mark needs watching. It has held so far. If the index falls below it and then also below the previous year's high, a stronger correction could follow.
Conclusion: the decision falls between 50,000 and 51,000 points
In the short term the Dow Jones shows a clean downtrend. Friday’s renewed rejection at the trend line confirmed it. At the same time the zone between 50,500 and 51,000 points has held, and below it the Q1 high, the 200-day line and the 50,000 mark crowd into a narrow space.
As long as the daily closes stay between the downtrend line and the Q3 low at 50,906, waiting is the assessment. A daily close above the line would be the first break since the September high, one below 50,906 opens the way to the 200-day line. In the long run the uptrend is intact; only a break of 50,000 and then of the previous year’s high at 48,887 could start a stronger correction.
How this forecast is made
This page is built for traders. It names where the index stands, the next level that matters and three possible paths, each with the condition that takes it off the table. It is updated regularly and says openly when there is no clear picture. The page follows our editorial policy.
The charts are Karsten’s own. They show the series DJI from the data provider DJCFD on TradingView, and all quoted levels are read from these charts, so they are chart readings and not official closing prices. Each caption carries its own export time. This update uses the charts of 3 October 2026, so all prices refer to the close on Friday, 2 October.
Frequently asked questions about the Dow Jones forecast
What is the outlook for the Dow Jones today?
There is no confirmed signal. As of 3 October 2026 the Dow Jones sits between the downtrend line from the September high and the Q3 low at 50,906 points. Only a daily close above the line or below 50,906 sets the direction.
Why is the Dow Jones falling right now?
On the chart a downtrend has been running since the September high at 53,746 points. It shows lower highs and lower lows, the index trades below the 20, 50 and 100-day lines, and every recovery so far has failed at the downtrend line (as of 3 October 2026).
When does the Dow Jones open?
Regular US stock trading on the New York Stock Exchange runs from 9:30 am to 4:00 pm New York time. That is 15:30 to 22:00 CEST in Central Europe. Because Europe and the US change their clocks on different dates, trading runs from 14:30 to 21:00 CET from 26 to 30 October 2026. CFDs and futures on the Dow Jones have their own, longer hours.
How far can the Dow Jones fall?
The next supports sit close together. First the Q3 low at 50,906 points, then the Q1 high at 50,513, the 200-day line at 50,274 and the 50,000 mark, below that the uptrend line since April 2025 in the weekly chart and the previous year’s high at 48,887 (as of 3 October 2026). The reaction at these levels can give hints; under our scenario rule the daily close counts, and a further decline remains possible.
Please note
The scenarios are a personal assessment based on experience, not a certainty. This is market analysis, not investment advice. Index markets can move sharply on single company results and economic data: keep your position sizes in line with your own risk management.
This forecast is translated from the German edition on kagels-trading.de.
How our forecasts are made and reviewed: How we work.