
Pivot Points: Formulas, Types and How to Trade Them


Contents
- Pivot points in 30 seconds
- Pivot points explained: levels from the prior session
- Standard pivot point formula: P, R1 to R3 and S1 to S3
- Fibonacci, Woodie, Camarilla and DeMark pivots
- Pivot point calculator: standard, Fibonacci, Woodie and Camarilla
- Which day counts: session, close and time zone
- How to trade pivot points: bias, range and breakout
- John Person’s candlestick and pivot point method
- Real example: SPY on September 30, 2026
- Pros and cons of pivot points
- How to add pivot points in TradingView
- Conclusion: pivot points are a map, not a signal
- Frequently asked questions about pivot points
- About the author
Where might price turn today? Pivot points give a fast, fixed answer before the open. For the standard version, three numbers from the prior session, the high, low and close, produce a set of levels for the new session. Nobody draws them by hand, so nobody can move them afterwards.
That objectivity is the strength of pivot points, and also their limit. In this guide you get the formulas for all five common pivot types, a free pivot point calculator, the detail most guides skip (which session the numbers come from) and a real SPY day in which one level held and one did not. I translated John Person’s book on trading with pivot points and candlesticks into German, and his method is part of this guide. This article follows our editorial policy.
Pivot points in 30 seconds
- What they are: price levels calculated from the prior period’s prices. In the standard version, the central level is the pivot P, with resistance levels R1 to R3 above and support levels S1 to S3 below.
- Five types: standard (floor), Fibonacci, Woodie, Camarilla and DeMark. They change the central calculation, the reference price or the number of levels, so the same day gives different levels.
- How traders use them: price above P is read as a bullish bias, below P as bearish. Range traders look for reversals at R1 and S1, breakout traders for moves beyond them.
- Limits: a pivot is a place to watch, not a signal. The levels also depend on the session your software uses, so two platforms can show different pivots for the same market.
Pivot points explained: levels from the prior session
A standard pivot point is the average of the prior period’s high, low and close, P = (H + L + C) / 3. Support and resistance levels are then placed above and below it at distances taken from the prior range. For daily pivots, the input is yesterday’s session; for weekly or monthly pivots, the prior week or month. The other types, explained below, change the central calculation, use the close or an open as reference, or give more or fewer levels.
The standard version is often called floor pivots, after the floor traders who used it. Before charting software, a trader could work out these levels with pencil and paper before the open. Everyone using the same formula and the same data sees the same lines. That is the whole appeal: no interpretation, no lines moved after the fact.
The names follow one pattern. P is the pivot itself, R stands for resistance and S for support. The number counts outward from P, so R1 is the first resistance above P and S3 the third support below it.
 Click to enlarge
Source: Data from Yahoo Finance, checked against Interactive Brokers, chart by Kagels Trading.
Standard pivot point formula: P, R1 to R3 and S1 to S3
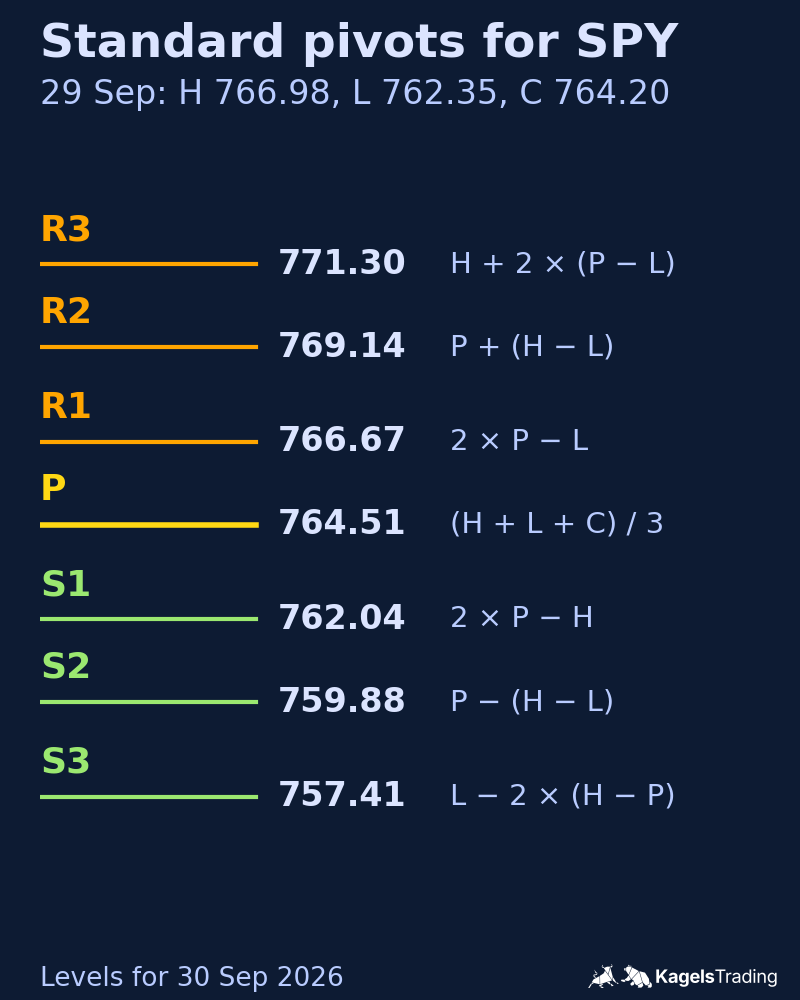
The standard formula, often called floor pivots, is a common starting point. TradingView lists it as “Traditional”, and thinkorswim’s Pivot Points study uses the same P, R1, R2, S1 and S2. With H, L and C for the prior high, low and close:
| Level | Formula | SPY for Sep 30, 2026 |
|---|---|---|
| R3 | H + 2 × (P − L) | 771.30 |
| R2 | P + (H − L) | 769.14 |
| R1 | 2 × P − L | 766.67 |
| P | (H + L + C) / 3 | 764.51 |
| S1 | 2 × P − H | 762.04 |
| S2 | P − (H − L) | 759.88 |
| S3 | L − 2 × (H − P) | 757.41 |
Here is the worked example behind the table. SPY’s regular session on September 29, 2026 had a high of 766.98, a low of 762.35 and a close of 764.20. P = (766.98 + 762.35 + 764.20) / 3 = 764.51. The range is 4.63, so R2 = 764.51 + 4.63 = 769.14 and S2 = 764.51 − 4.63 = 759.88.
Watch out for R3 and S3: not every platform calculates them the same way. The formula in the table is what TradingView calls “Traditional”. TradingView’s “Classic” type and the Pivot Points study in thinkorswim use R3 = P + 2 × (H − L) and S3 = P − 2 × (H − L). Sources: TradingView Pivot Points Standard and thinkorswim PivotPoints. For the SPY example that is 773.77 and 755.25 instead of 771.30 and 757.41. R1, R2, S1 and S2 are the same in both.
Fibonacci, Woodie, Camarilla and DeMark pivots
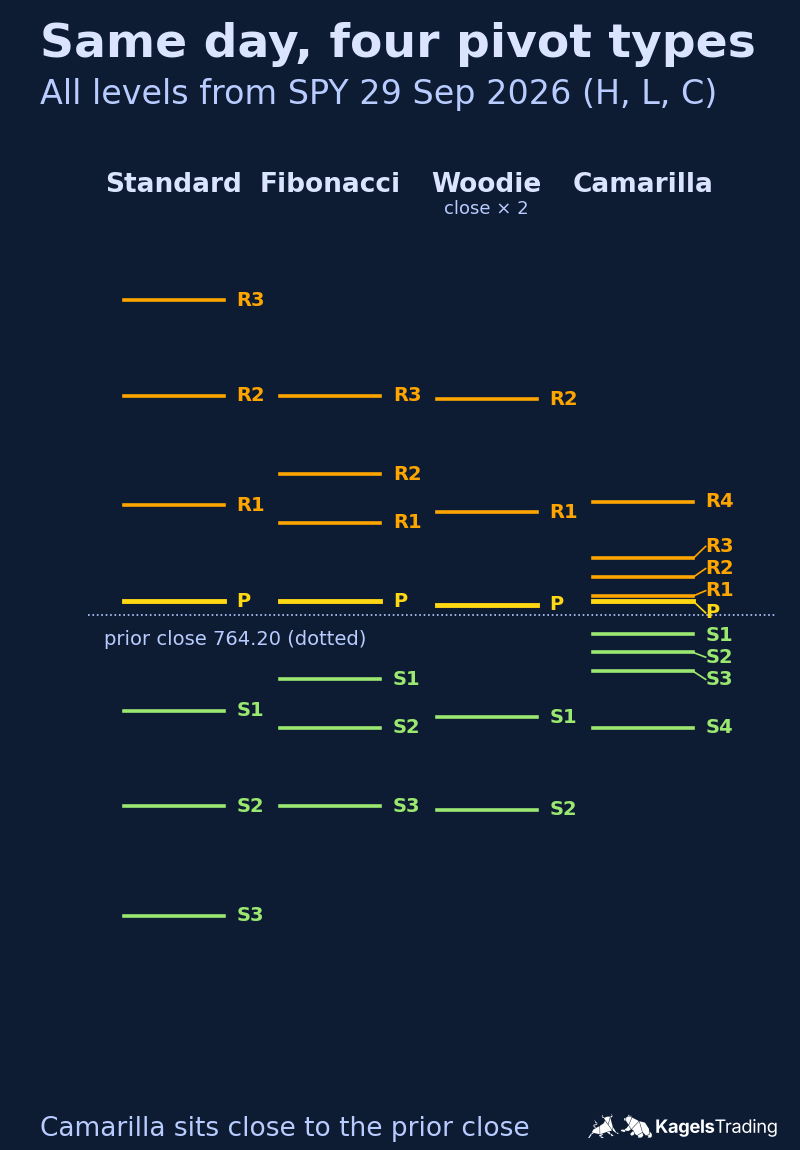
All other pivot types answer the same question with a different formula. The comparison below uses the same SPY input for each type. Most visible is the Camarilla set, which sits tightly around the prior close, while the standard levels spread the widest. All formulas below follow the TradingView help page linked above, except the textbook Woodie version.
 Click to enlarge
Fibonacci pivot points
Fibonacci pivots keep the standard P and place the other levels at Fibonacci fractions of the prior range. The 0.382 and 0.618 fractions also appear in a Fibonacci retracement, and 0.618 as a target in a Fibonacci extension, but here they apply to yesterday’s range, not to a swing. The factors are 0.382, 0.618 and 1.0:
- R3 = P + (H − L) × 1.000
- R2 = P + (H − L) × 0.618
- R1 = P + (H − L) × 0.382
- S1 = P − (H − L) × 0.382
- S2 = P − (H − L) × 0.618
- S3 = P − (H − L) × 1.000
One detail is worth knowing: the Fibonacci R3 is exactly the standard R2. Both add the full prior range to P, so for SPY both are 769.14. When two pivot types agree on such a level, that is the same arithmetic, not a second, independent confirmation.
Woodie pivot points
Woodie pivots give the most recent price more weight, and two versions are in use. The textbook version counts the prior close twice: P = (H + L + 2 × C) / 4. TradingView’s Woodie type uses today’s open twice instead: P = (H + L + 2 × O) / 4. The other levels follow the standard pattern:
- R2 = P + (H − L)
- R1 = 2 × P − L
- S1 = 2 × P − H
- S2 = P − (H − L)
For SPY on September 30 the two versions differ by more than a dollar. With the close, P is 764.43; with that day’s open of 766.41, P is 765.54. Check which version your software uses before you compare levels with someone else.
Camarilla pivot points
Camarilla pivots are built around the prior close, not around P. TradingView still shows the standard P with them. They are usually attributed to a bond trader, Nick Scott (some sources spell it Stott), around 1989; I found no primary source for the story. The range is multiplied by 1.1 and divided by 12, 6, 4 or 2:
- R4 = C + (H − L) × 1.1 / 2
- R3 = C + (H − L) × 1.1 / 4
- R2 = C + (H − L) × 1.1 / 6
- R1 = C + (H − L) × 1.1 / 12
- S1 = C − (H − L) × 1.1 / 12
- S2 = C − (H − L) × 1.1 / 6
- S3 = C − (H − L) × 1.1 / 4
- S4 = C − (H − L) × 1.1 / 2
Because the levels sit close together, Camarilla guides focus on R3/S3 and R4/S4. The usual reading is to look for reversals at R3 or S3 and to treat a move beyond R4 or S4 as a possible trend day. TradingView also draws an R5 and S5 for Camarilla, with R5 = (H / L) × C.
DeMark pivot points
DeMark pivots are the only common type that uses the prior day’s open, and they give just one support and one resistance. They go back to the analyst Tom DeMark. First you calculate a helper value X:
- If C < O: X = H + 2 × L + C
- If C > O: X = 2 × H + L + C
- If C = O: X = H + L + 2 × C
From X you get three levels. P = X / 4, R1 = X / 2 − L and S1 = X / 2 − H. TradingView lists this type as “DM”.
Pivot point calculator: standard, Fibonacci, Woodie and Camarilla
Enter the prior session’s high, low and close, and the table updates as you type. It starts with the SPY values from the example above. The calculator runs in your browser only: nothing is sent or stored. Decimals follow your input, so forex prices with four or five decimals work too.
Use a dot for decimals (1.20830). A comma only as a thousands separator together with a dot (4,643.00).
| Level | Standard | Fibonacci | Woodie | Camarilla |
|---|---|---|---|---|
| R4 | – | – | – | 766.75 |
| R3 | 771.30 | 769.14 | – | 765.47 |
| R2 | 769.14 | 767.37 | 769.06 | 765.05 |
| R1 | 766.67 | 766.28 | 766.52 | 764.62 |
| P | 764.51 | 764.51 | 764.43 | 764.51 |
| S1 | 762.04 | 762.74 | 761.89 | 763.78 |
| S2 | 759.88 | 761.65 | 759.80 | 763.35 |
| S3 | 757.41 | 759.88 | – | 762.93 |
| S4 | – | – | – | 761.65 |
Standard = TradingView "Traditional" (R3 = H + 2 × (P − L)). Woodie uses the prior close twice; TradingView's Woodie uses the current open. DeMark needs the open and is not included. Prices from 0.0001 to 1,000,000 with up to five decimals; results are rounded half away from zero to the decimals you enter, between two and five. Calculated levels, not a forecast.
Which day counts: session, close and time zone
The formula is easy; the hard part is which high, low and close you feed into it. Two platforms can show different pivots for the same symbol because they use different sessions or different closing prices. These are the cases to check:
- US stocks and ETFs: daily bars usually cover the regular session, 9:30 a.m. to 4:00 p.m. Eastern. Pre-market and after-hours trades are normally not in the daily bar. The SPY example uses the regular session.
- Futures: the daily close is often the settlement price, not the last trade, and the daily bar can cover the full electronic session. TradingView explains that this is why intraday and daily pivots on a future like ES can differ.
- Forex: there is no exchange close. A widely used convention ends the day at 5:00 p.m. New York time; your broker’s server time may differ.
In TradingView, two settings decide which data the pivots use. “Pivots Timeframe” defaults to “Auto”: daily pivots on charts up to 15 minutes, weekly pivots on intraday charts above 15 minutes, monthly pivots on daily and higher charts. So on a 1-hour chart you see weekly pivots unless you change it. “Use Daily-based Values” is on by default and takes the numbers from the daily bars, so pivots match across timeframes.
How to trade pivot points: bias, range and breakout
Pivot levels tell you where to pay attention, not what to do. Traders use them in three common ways: bias, range and breakout. None of them is a rule that works on its own, and I know of no reliable count of how often each level holds across markets.
- Bias: price above P is read as a bullish tone for the session, below P as bearish. Some day traders take only longs above P and only shorts below it.
- Range: in a quiet session, traders look for reversals near R1 and S1, with the stop beyond the level and P or the opposite level as the target.
- Breakout: when price moves through R1 or S1 with momentum, traders look for continuation toward R2 or S2, and sometimes R3 or S3. Our breakout trading guide shows how often breakouts fell back into the range.
Whatever the plan, the level is only the place; the trigger has to come from price. A level becomes interesting when a bar closes in a way that confirms it, as in price action trading. The signal is that close; the entry comes at the next bar’s open, after you check that the open has not already run far past your planned entry. Gaps and fast moves can fill you at a worse price than planned, even with a stop order.
Size the position from the stop, not from the level. For stocks and ETFs, planned loss = shares × stop distance. For futures, planned loss = contracts × stop distance in points × dollar value per point. For example, 100 SPY shares with a stop 1.20 below the entry is a planned loss of 120 dollars before costs and slippage. This guide is education, not investment advice.
John Person’s candlestick and pivot point method
John Person combines pivot levels with a candlestick trigger, so the pivot is the place and the candle is the signal. I translated his “A Complete Guide to Technical Trading Tactics: How to Profit Using Pivot Points, Candlesticks and Other Indicators” (Wiley, 2004) into German together with Gaby Boutaud. His later book is “Candlestick and Pivot Point Trading Triggers” (Wiley, 2007). thinkorswim even has a study called PersonsPivots.
A simplified version of his trigger uses the doji, a bar whose open and close are nearly equal. Person calls the bullish version a high close doji: after a doji, a later bar closes above the doji’s high. The bearish version, the low close doji, is a close below the doji’s low.
- Long: a doji near a support level (S1 or S2), then a bar that closes above the doji high. Entry at the next bar’s open after the opening check above, stop below the doji low. If the open is already at or below that stop, there is no trade.
- Short: a doji near a resistance level (R1 or R2), then a bar that closes below the doji low. Entry at the next bar’s open after the opening check above, stop above the doji high. If the open is already at or above that stop, there is no trade.
The trigger can fail, especially on a strong trend day. A doji only shows indecision. Look for several small bars near the level, no strong bar against your direction in between, and a pause before the trigger. Person’s full method adds moving averages and divergences; this is the simplified core.
Real example: SPY on September 30, 2026
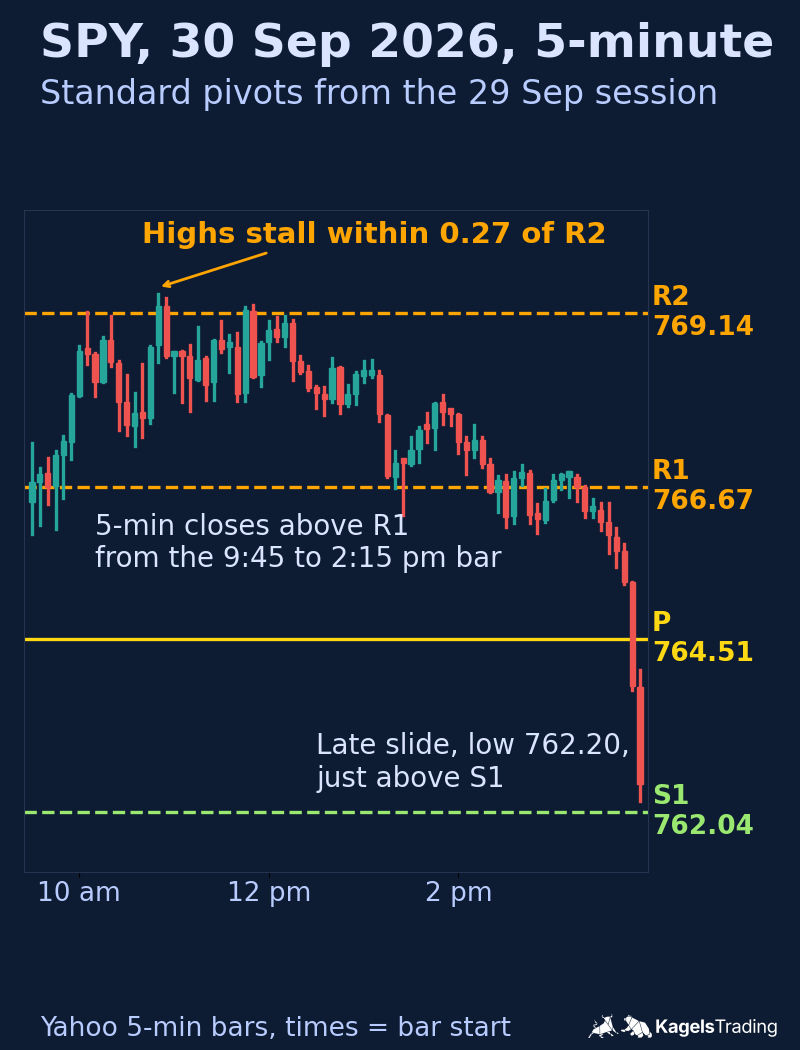
This session shows both sides of pivot levels: one did not stop price, the next one did. The standard pivots for September 30 came from the September 29 regular session: R2 769.14, R1 766.67, P 764.51 and S1 762.04.
 Click to enlarge
SPY opened at 766.41, just below R1, and R1 did not hold as resistance. The first 5-minute bar closed above it, the 9:40 bar closed one cent below it, and every 5-minute bar from the 9:45 a.m. bar through the 2:15 p.m. bar closed above R1 (times are bar start times). A trader who sold R1 as resistance that morning would have needed a stop.
R2 behaved differently: the rise stalled there for about two hours. Between the 10:05 a.m. and 12:10 p.m. bars, the 5-minute highs reached 769.15, 769.41, 769.35, 769.22 and 769.25 against an R2 of 769.14. Two bars closed a few cents above R2, but none above 769.25. That is a zone of about 30 cents, not an exact line.
In the last hour SPY slid back through P. The low was 762.20 in the 3:55 p.m. bar, 16 cents above S1, and the official close was 762.63. This is one selected day, not a statistic: it shows how pivots can be used to read a session, not that R2 holds more often than R1.
Pros and cons of pivot points
Pivot points are useful because they are fixed, and limited for the same reason. A formula gives clear levels, but it cannot see news or the mood of the day.
| Pros | Cons |
|---|---|
| Objective: a formula, no hand-drawn lines to move later | Yesterday’s data: news before the open can make the levels irrelevant |
| Ready before the open: standard, Fibonacci and Camarilla levels are known before the session starts (TradingView’s Woodie needs the open) | No signal on their own: price does not have to react at any level |
| Widely available: built into TradingView, thinkorswim and most platforms | Many variants: five types and two R3 formulas give different levels for the same day |
| Any market: stocks, futures, forex, on daily, weekly or monthly data | Trend days: on strong days, price can run through several levels in a row |
My practical rule: pick one pivot type, one data source and one timeframe, and stay with it. If you show standard and Camarilla pivots together, you quickly have 15 lines on the chart and none of them stands out.
How to add pivot points in TradingView
TradingView calculates the levels for you with the built-in “Pivot Points Standard” indicator. It is one of the built-in indicators, so you need no script of your own. The steps:
- Open a chart and click Indicators at the top.
- Search for “Pivot Points Standard” and select it.
- In the settings, choose the Type: Traditional, Fibonacci, Woodie, Classic, DM or Camarilla.
- Set Pivots Timeframe to Daily for day trading, Weekly or Monthly for swing trading, instead of “Auto”.
Check the result once with the calculator above, for the types it covers. Enter the prior day’s high, low and close from your daily chart and compare TradingView’s Traditional, Fibonacci and Camarilla levels. TradingView’s Woodie uses the current open, and its Classic and DM types are not in the calculator, so those will differ. If the covered types differ, the cause is usually the session or the settlement price, as explained above. TradingView also offers a separate “Pivot Points High Low” indicator; that one marks swing highs and lows and is not a pivot formula.
Conclusion: pivot points are a map, not a signal
Pivot points give you a map of the session before it starts, and that is their real value. The levels are objective, quick to calculate and the same for everyone who uses the same formula and data. They force you to plan before the open instead of reacting to every tick.
What they do not give you is a reason to trade. On September 30, R1 gave way and R2 capped the day; neither was knowable in advance. Use pivots together with price action, a clear trigger and a stop sized from the risk you accept. If you want to see where pivots fit among other levels, read our guide to support and resistance.
Frequently asked questions about pivot points
What are pivot points in trading?
Pivot points are price levels calculated from the prior period’s prices. In the standard version, the central level is P = (H + L + C) / 3, with resistance levels R1 to R3 above it and support levels S1 to S3 below. Other types, such as Camarilla or DeMark, use a different reference price or a different number of levels. Traders use them as reference levels for the next session.
How do you calculate pivot points?
For standard pivots, start with P = (H + L + C) / 3 from the prior session. Then R1 = 2 × P − L, S1 = 2 × P − H, R2 = P + (H − L) and S2 = P − (H − L). R3 and S3 differ by platform, as explained in the formula section. The calculator in this article does the math for four types.
Which pivot points are best?
There is no best type, only one that fits your trading. Standard pivots are a common starting point and the simplest to learn; TradingView calls them Traditional. Camarilla levels sit tighter around the close and suit very short-term trading. Fibonacci pivots suit traders who already work with Fibonacci ratios. Whichever you choose, use it consistently.
Are pivot points still relevant?
Yes, as reference levels, as long as you do not expect more from them. They are built into the major platforms, so many traders see them. That does not mean price must react there. On the SPY day in this article, R1 gave way and R2 capped the rise; a plan with a trigger and a stop matters more than the level itself.
Which is better, Fibonacci or Camarilla pivots?
They answer different questions. Fibonacci pivots spread out from P by 38.2, 61.8 and 100 percent of the prior range and give wider, intraday-to-daily levels. Camarilla pivots cluster around the prior close and give tight levels for mean-reversion ideas. Test both on your market before you decide.
Which close is used to calculate pivot points?
Usually the close of the regular session for stocks and ETFs, often the settlement price for futures, and 5:00 p.m. New York time for forex. Platforms and brokers can differ, which is why the same market can show different pivots on two charts. Check which session your software uses.
Can you trade pivot points on their own?
No, a pivot level alone is not a trade signal. Price does not have to react at any level. Combine pivots with a trigger from price, such as a closing bar that confirms the level, and a stop placed beyond it.
This US edition is based on our German edition on kagels-trading.de and has been adapted for US readers.
More Chart Techniques guides
- Draw key levels
Support and Resistance: How to Draw and Use Key Levels
Where useful levels come from, how to draw zones with a stated rule and how to turn a level into a trade plan.
- Read price action
Price Action Trading: How to Read Charts Without Indicators
Market structure, key zones and three bar patterns, with a core setup and a real SPY example where the signal failed.
- Read candlestick charts
How to Read Candlestick Charts: Body, Wicks and Context
Open, high, low and close in one candle, body and wicks, two real Gold candles read step by step and how often patterns really occur.
- Know candlestick patterns
Candlestick Patterns: 10 to Know, Tested on Real Data
Ten patterns with rules and a cheat sheet, counted on DAX, S&P 500, EUR/USD and Gold since 2014: most are rare, none is a signal on its own.
- Trade breakouts
Breakout Trading Strategy: Entries and False Breakouts
How often breakouts fell back into the range in our count of 1,472, and how to plan entry, stop and position size.
- Draw and trade trendlines
Trendline Trading: How to Draw Trendlines and Trade Them
How to draw trendlines with a fixed rule, four strategies for bounces, breaks and retests, and a real SPY line break without a lasting reversal.
- Use Fibonacci levels
Fibonacci Retracement Levels: How to Draw and Trade Them
How to calculate and draw retracement levels, trade pullbacks with confluence and a stop at the structure, and what a ten-year test says about the levels.
- Set Fibonacci targets
Fibonacci Extension: Levels, How to Draw It and Calculator
Three-point extension targets from the end of a pullback, why they differ from levels beyond 100%, a free calculator and three SPY swings, one without a single target reached.
- Trade gaps
Gap Trading Strategy: How to Trade Gaps and When Gaps Fill
Opening and full gaps, the four classic gap types, how often SPY gaps filled in our count since 2001, and plans for gap fill and gap and go.
- Swing trade
Swing Trading: 4 Strategies, Risk and Real Examples
Four swing trading strategies on the daily chart, position size, gap risk and US rules, with two hypothetical SPY pullbacks: one hit its target, one was stopped out.
- Identify market stages
Stage Analysis: Stan Weinstein's Four Market Stages
Stan Weinstein's four stages on the weekly chart, a Stage 2 checklist and two TSMC breakouts: one ran for a year, one gapped through its stop.
- Read Wyckoff ranges
Wyckoff Method: Accumulation, Distribution and Springs
Accumulation and distribution with phases A to E, springs and upthrusts as optional tests, and two real TSMC ranges read with and without hindsight.
- Trade Darvas boxes
Darvas Box Strategy: Rules, Entries and Stop Losses
The box rules step by step, when the edges become known, where the stop goes, and a mechanical test on TSMC in 2024 with two honest results.
- Count Elliott waves
Elliott Wave Theory: Rules, Patterns and Fibonacci
The five-wave pattern, three hard rules, zigzags, flats and triangles, Fibonacci ratios and a real DAX count, from the first German translator of the standard work.
- Trade order blocks
Order Blocks: How to Spot, Draw and Trade the Zone
The three conditions behind a valid order block, entry and stop at the zone, two SPY cases from 2026 and a 25-year count where a fixed rule lost money.
- Trade fair value gaps
Fair Value Gap (FVG): How to Spot, Trade and Test It
The three-candle rule, bullish, bearish and inverse FVG, two SPY cases from 2026 and a 25-year count of how often gaps were revisited and traded.
- Read liquidity sweeps
Liquidity Sweep: How to Spot It and Trade the Reversal
Sweep or run, buy-side and sell-side liquidity, internal and external targets, SPY reversal, continuation and failed-reversal examples and a 25-year count of a fixed sweep rule.
- Interpret volume
Volume Analysis in Trading: How to Read Volume Honestly
What volume counts in stocks, futures, forex and crypto, how to read it against its own average, and our SPY test of high-volume days since 2001.