
ATR Indicator: Average True Range for Stops and Size


Contents
- ATR in 30 seconds
- What is the ATR indicator?
- How the ATR is calculated
- What the ATR adds to the daily range
- How to read the ATR
- How to use the ATR in trading
- ATR settings in TradingView and other platforms
- Advantages and disadvantages of the ATR
- My conclusion: the right ruler for stops and size
- Frequently asked questions about the ATR
- About the author
The Average True Range measures how far a market has actually moved over a set period: not where, but how far. If you miss that difference, you use the indicator wrongly. A rising ATR says nothing about rising prices, only that the daily ranges are getting larger.
How much the true range adds to the simple daily range can be counted. On SPY, the ETF that tracks the S&P 500, the true range was larger than the high-low range on 37.5% of the trading days in the last five years. This guide shows the calculation step by step, Wilder’s smoothing, the settings, and the two jobs the ATR is really good at: stop distance and position size. This article follows our editorial policy.
ATR in 30 seconds
- Definition: the Average True Range (ATR) measures the size of price moves, not their direction. J. Welles Wilder introduced it in 1978.
- True range: the largest of three distances: high minus low, and the gaps from the previous close to today’s high or low. On SPY it exceeded the plain range on 37.5% of days.
- Wilder’s smoothing: ATR = (previous ATR × 13 + today’s true range) ÷ 14. On SPY it differed from a simple average by 8.1% on average and by up to 34.9%.
- The ATR itself swings a lot: on SPY it ranged from 3.47 to 20.34 dollars in five years, a factor of 5.9.
- Use it for stops and size, not for entries: in my SPY test, a stop at 2 × ATR was hit about equally often in calm and volatile markets; a fixed percent stop was not.
What is the ATR indicator?
The ATR indicator (Average True Range) measures the average size of a market’s price moves over a set number of periods. It shows the size of the move, not its direction.
This separation is the most common mistake. A rising ATR means that the bars are getting longer. Whether they grow upward or downward is not part of a volatility indicator. For direction you need trend tools, such as a moving average or the structure of highs and lows.
J. Welles Wilder created the ATR and published it in 1978 in his book New Concepts in Technical Trading Systems, according to the ATR help page of TradingView. The same book introduced the RSI, the Average Directional Index and the Parabolic SAR. The true range counts gaps between sessions, which is what sets it apart from a plain high-low range.
How the ATR is calculated
The true range is the largest of three distances: today’s high minus today’s low, the gap from yesterday’s close up to today’s high, and the gap from yesterday’s close down to today’s low. As a formula: TR = max(high − low, |high − previous close|, |low − previous close|). The absolute values matter, otherwise the third distance turns negative. In words, the formula takes the largest of the three, so a gap between yesterday’s close and today’s prices is counted.
The second step smooths these values, and many explanations get it wrong. A simple average of the last 14 true ranges is not what Wilder described, and not TradingView’s default. The MetaTrader 5 help only calls the ATR a moving average of the true range, so check which average your platform uses. Wilder starts with the simple average of the first 14 true ranges. From then on, each new ATR comes from the previous ATR and the new true range:
- ATR = (previous ATR × 13 + current true range) ÷ 14
Wilder’s smoothing never drops old values completely; they only lose weight. In TradingView this smoothing is called RMA and is the default for the ATR. A simple average (SMA) of 14 days, by contrast, drops the 15th value at once.
RMA or SMA: why the same length gives two different stops
Whether the smoothing is called RMA or SMA sounds like a detail, but not for your stop. I calculated both versions of the ATR 14 on SPY for the five years from October 15, 2021 to October 15, 2026. On average the absolute difference was 8.1% of the simple-average value. At turning points of volatility the gap is much larger: on May 14, 2025 the Wilder ATR stood at 11.45 dollars, the simple average at 8.49 dollars, a difference of 34.9%.
The cause is the inertia of Wilder’s formula. After a burst of volatility, the simple average falls faster, because the large true ranges of the shock drop out of its 14-day window all at once. The Wilder ATR holds on to the high volatility for longer. For a stop that is arguably an advantage: you do not move back to a tight stop right after a shock. In practice, leave the setting on RMA unless you have a specific reason, and if two programs show different ATR values, check the smoothing before you suspect a data error.
What the ATR adds to the daily range
The swing of a day could be measured more simply: high minus low. Wilder went to the trouble of three distances because this simple range misses the gap between yesterday’s close and today’s prices. How often that matters is not a matter of opinion; it can be counted.
 Click to enlarge
On SPY, the true range exceeded the plain range on 470 of 1,255 trading days, or 37.5%, from October 15, 2021 to October 15, 2026. On those days the true range was in the median 26.9% larger. If you calculate only high minus low, you underestimate the move on more than one day in three, and noticeably so.
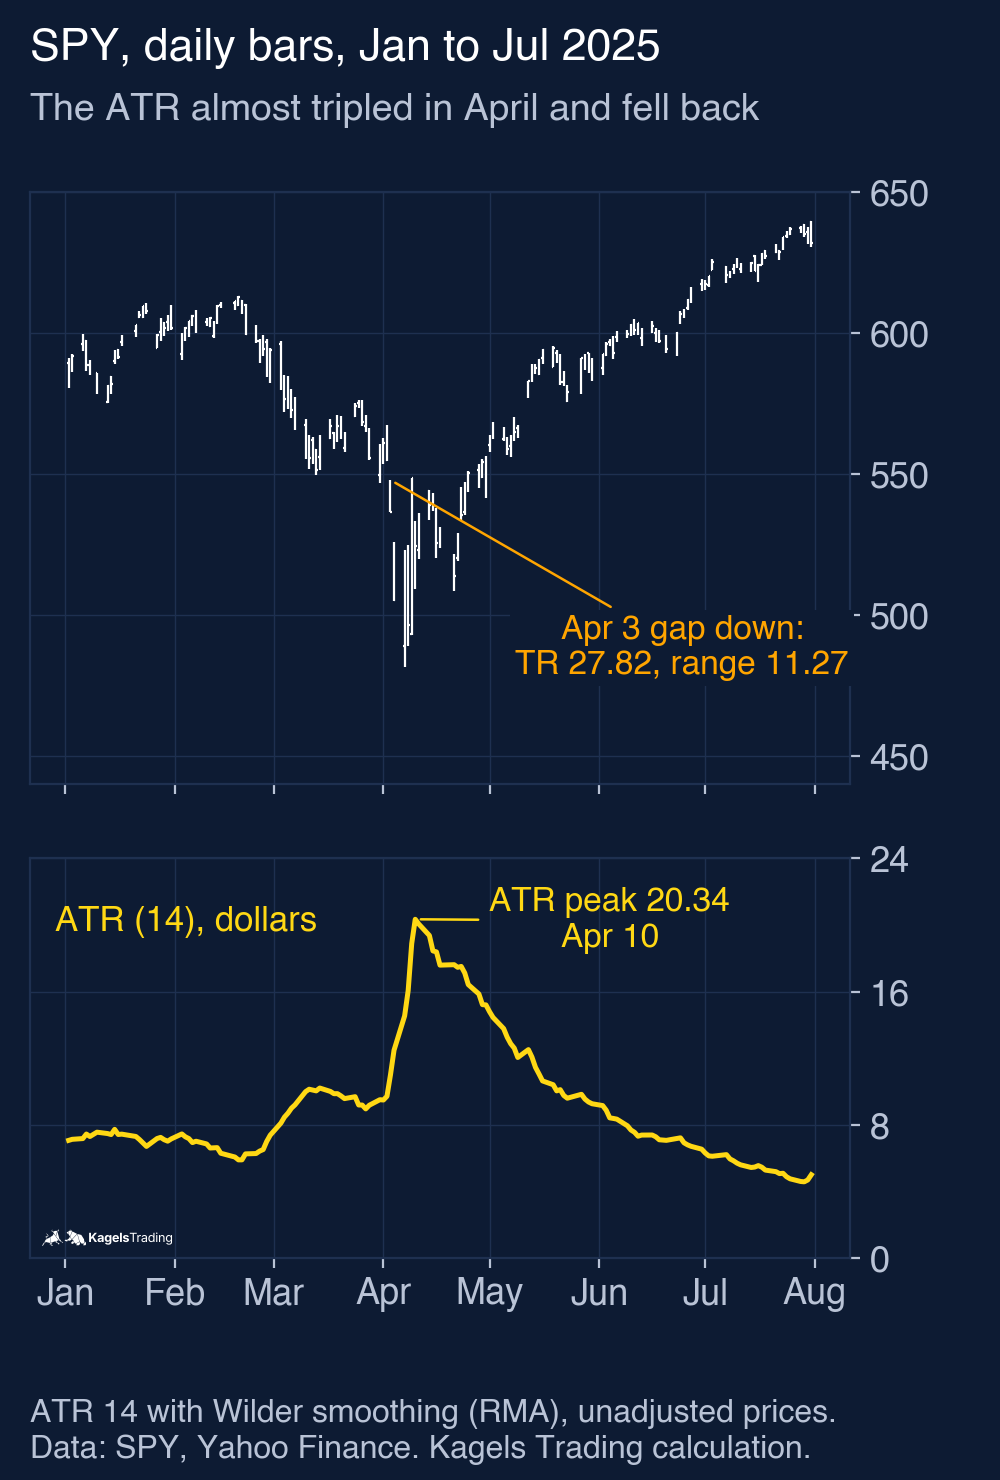
The extreme case in this window was April 3, 2025. SPY closed the day before at 564.52 dollars and opened at 545.11. During the day it moved only 11.27 dollars from high to low, but the true range was 27.82 dollars, because the overnight gap counts. The completed day’s range left out more than half of the move from the previous close.
Markets that trade almost around the clock gain less from the true range. Currencies trade from Sunday evening to Friday evening with few overnight breaks, so the gap between one close and the next open is usually small. I planned to measure this on EUR/USD, but in the free daily data I used almost every bar opens away from the previous close. I suspect that this comes from how the data feed cuts its daily bars rather than from real market gaps, so the feed is unsuitable for this comparison and I do not report a forex number. My measurement covers only SPY; the reasoning about stocks, indices and futures that pause overnight is logic, not a tested ranking.
The ATR itself swings a lot
An ATR value is not a fixed property of a market but a snapshot. On SPY, the ATR 14 ranged from 3.47 dollars (November 19, 2021) to 20.34 dollars (April 10, 2025) in the five-year window, with a median of 6.48. On October 15, 2026 it stood at 6.58 dollars with SPY at 771.79. Between the calmest and the most volatile reading lies a factor of 5.9.
In percent of price the swing is just as large. The ATR was between 0.71% and 3.88% of the SPY price, with a median of 1.16%. The yearly median moved from 4.71 dollars in 2023 to 7.91 dollars in 2026 (year to date). A stop rule in fixed dollars or points quietly goes out of date, while an ATR rule moves with the market.
How to read the ATR
A rising ATR means the market’s volatility is increasing; a falling ATR means it is calming down. Low ATR values typically appear in consolidations: narrow ranges and little participation. High values stand for large daily ranges, as after news, on expiration days or in sell-offs. The direction is never in the indicator: a high value can belong to a strong rise or a strong fall.
You cannot compare ATR values between markets directly. The ATR is measured in the unit of the market, so a stock at 700 dollars naturally has a larger ATR than one at 70. To compare, divide the ATR by the price and look at the percentage, or judge each market only against its own history. The closest relative based on the standard deviation is the Bollinger Bands indicator, which draws the volatility as bands around the price.
How to use the ATR in trading
The ATR answers one narrow question well: how far does this market move on a typical day right now? That makes it the right reference for stop distance and position size, and the wrong one for entries.
Setting a stop loss with the ATR
Place the stop a multiple of the ATR away from your entry, so the stop adapts to the market’s current volatility. The steps for a long trade:
- Read the current ATR 14 on the time frame you trade, usually the daily chart.
- Multiply it by your factor, often between 1 and 3.
- Subtract the result from your long entry (or add it to a short entry). That is your stop.
An example with SPY on October 15, 2026: the close was 771.79 dollars and the ATR 6.58 dollars. A stop at 2 × ATR lies 13.16 dollars below the entry, at 758.63. A static stop stays there; a trailing version moves up with the price and the current ATR. Where the stop sits relative to real support on the chart still matters; how to find such zones is shown in the guide to support and resistance.
My test: ATR stops against a fixed percent stop
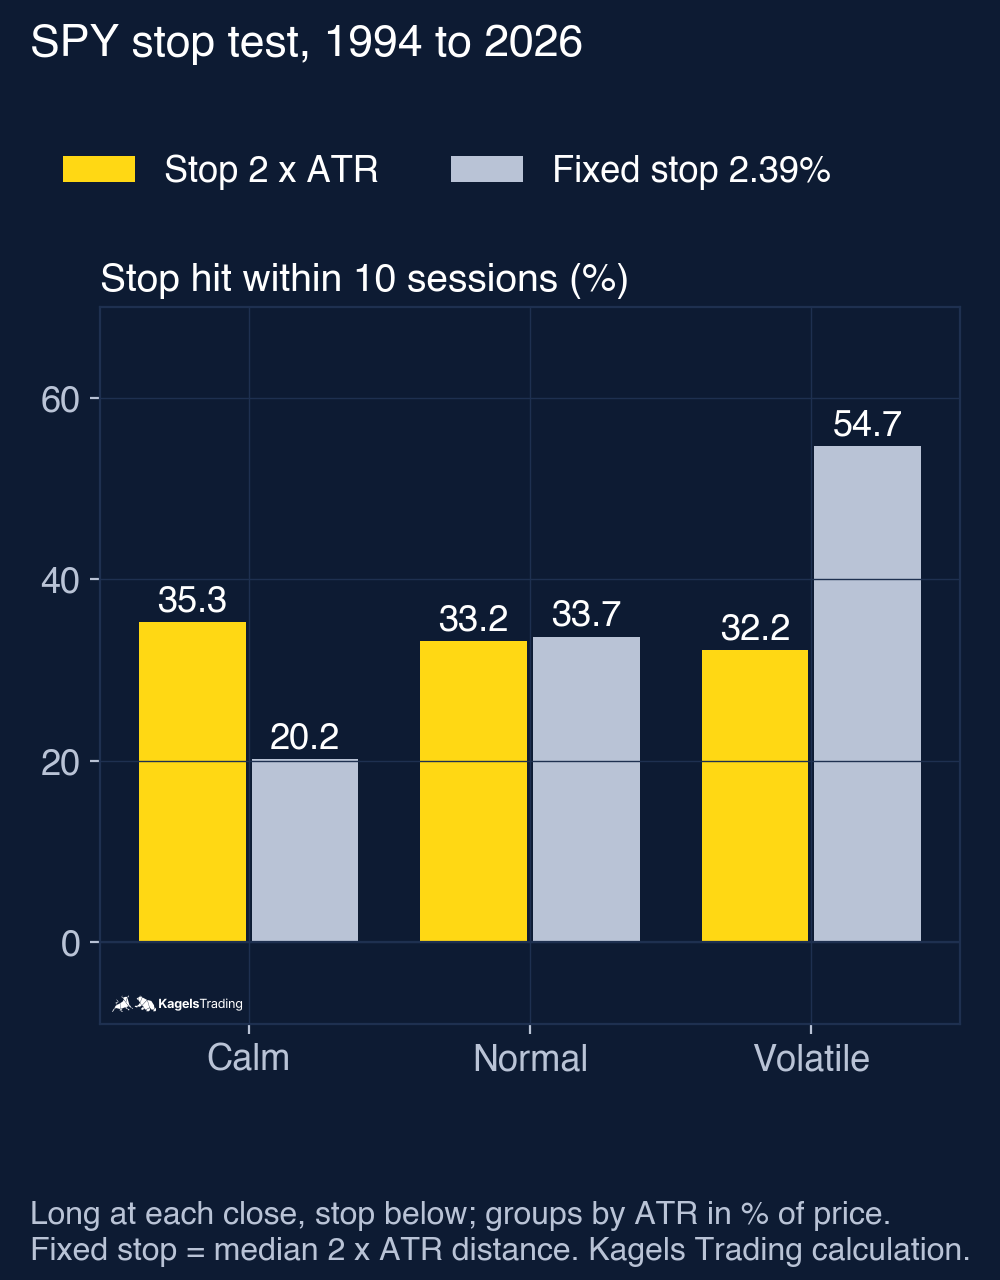
I wanted to know whether an ATR stop really behaves differently from a fixed percent stop, and I wrote the rules down before calculating. For every trading day from January 3, 1994 to October 1, 2026, I took a hypothetical long position at SPY’s close and placed a stop 1, 2 or 3 ATR below it. The stop counts as hit if any low in the next 10 sessions reaches it; a gap through the stop counts too. As a comparison I used a fixed percent stop with the same median distance: 1.20%, 2.39% and 3.59%. I split the 8,242 days into thirds by the ATR in percent of price: calm, normal and volatile. The fixed distances and the thirds are calibrated on the whole sample, which is fine for a description but is not an out-of-sample trading test.
 Click to enlarge
| Stop, hit within 10 sessions | Calm | Normal | Volatile | All |
|---|---|---|---|---|
| 1 × ATR | 61.3% | 56.7% | 58.5% | 58.8% |
| Fixed 1.20% | 46.8% | 56.8% | 72.6% | 58.7% |
| 2 × ATR | 35.3% | 33.2% | 32.2% | 33.6% |
| Fixed 2.39% | 20.2% | 33.7% | 54.7% | 36.2% |
| 3 × ATR | 19.4% | 18.6% | 16.4% | 18.1% |
| Fixed 3.59% | 8.6% | 19.8% | 38.0% | 22.1% |
The ATR stop had similar observed hit rates in calm and volatile markets. A 2 × ATR stop was hit in about a third of cases, whether the market was calm or volatile. The fixed 2.39% stop was hit in only 20.2% of calm cases but in 54.7% of volatile ones. Each third contains 2,747 or 2,748 days. The calm third had an ATR below 0.98% of price, the volatile third above 1.52%.
This test measures stop hits, not profits. A stop that is hit less often is not automatically better; it may also lose more when it is hit, so the trade-off stays yours. The 10-day windows overlap, so the days are not independent. What the numbers show is narrower and still useful: an ATR stop adjusts its distance to the market’s recent volatility, a fixed percent stop does not.
Using the ATR to set your position size
The ATR also tells you how large a position can be, because volatility and size are two sides of the same risk. The order matters: first the stop, then the size. If you set the size first and move the stop to fit your budget, your account decides the stop instead of the market.
A worked example with SPY: your account is 20,000 dollars and you risk at most 1% per trade, so 200 dollars. SPY’s ATR is 6.58 dollars and your stop is 2 × ATR, so 13.16 dollars. 200 ÷ 13.16 = 15.2, so you buy 15 shares, a planned loss of 197.40 dollars at the stop. A gap through the stop, slippage and costs can make the real loss larger. If the ATR later falls to 4 dollars, the same rule allows 25 shares with an 8-dollar stop. The formula and a calculator are in the guide to position sizing, and the bigger picture in risk management.
Wilder’s volatility system and the Turtles’ N
Wilder also built a trend-following system on the ATR in the same 1978 book. It uses a multiple of the ATR as a trailing distance from the closes and switches between long and short. I have not tested it and do not describe its exact rules here; if you want to use it, take them from the book itself and test them on your market first. The same measure also sits in the best-known trend-following system: the Turtles called the 20-day average true range simply N and sized their positions with it. How that worked is shown in the guide to Turtle Trading.
ATR settings in TradingView and other platforms
The ATR is built into common charting platforms, and the settings are few. In TradingView you find it under Indicators by searching for “Average True Range”. The inputs are the length (14 by default) and the smoothing (RMA by default; SMA, EMA and WMA are also offered). In MetaTrader 4 and 5 it is listed under Indicators, Oscillators.
Think time frame and length together. The ATR works on any time frame, from one minute to one month. An ATR 14 on a 5-minute chart means something completely different from one on the daily chart, so always calculate your stop in the time frame you trade. A very short length reacts to every spike; a very long one reacts late to a change in volatility.
Advantages and disadvantages of the ATR
The ATR answers a narrow question, and that is both its strength and its limit. The lists sum up the strengths and weaknesses.
What speaks for the ATR
- Few settings: length and smoothing, nothing else. There is little room to bend the indicator until it fits a wish.
- Counts gaps: on SPY the true range exceeded the plain range on 37.5% of days, because the overnight gap counted.
- Speaks the market’s language: stops and sizes in multiples of the typical daily move instead of arbitrary points.
- Similar stop-hit rates: in my test, 2 × ATR stops were hit about equally often in calm and volatile markets.
What speaks against the ATR
- No direction: a rising ATR only means longer bars, not where they go.
- Not comparable between markets: the value is in the market’s own unit unless you convert it to percent.
- No reference level: whether a value is high or low you only see against its own history.
- Looks only backward: a gap enters the ATR after it has happened; the indicator gives no warning the night before.
- The smoothing matters: RMA and SMA differed by up to 34.9% on SPY.
My conclusion: the right ruler for stops and size
The Average True Range does one job well: it tells you how far a market typically moves right now. For stop distances and position sizes that is the right reference. For entries it is the wrong one, because it knows no direction.
Three numbers from my measurement are worth remembering. On 37.5% of SPY days the overnight gap made the true range larger than the plain range. The ATR itself swung by a factor of 5.9 in five years, which makes any fixed point or percent rule go stale. And an ATR stop showed similar hit rates in calm and volatile markets, where a fixed percent stop did not. If you size your positions with the ATR, your planned risk per trade stays about the same when the market changes its pace, apart from rounding, gaps and costs.
This article is market analysis, not investment advice. Past results of a test do not show future results.
Frequently asked questions about the ATR
What is the Average True Range (ATR)?
The ATR is a volatility indicator that shows how far a market typically moves per period. It was introduced by J. Welles Wilder in 1978 and measures the size of moves, not their direction. The default length is 14 periods.
How is the ATR calculated?
First take the true range: the largest of high minus low and the two gaps from the previous close to the high and the low. Then smooth it: ATR = (previous ATR × 13 + current true range) ÷ 14. In TradingView this smoothing is called RMA; a simple average gives different values.
What is the ATR used for?
Mainly for stop distances and position sizes. A stop at one to three times the ATR adapts to the market’s current volatility, and dividing your risk by the stop distance gives the position size.
What does a high ATR mean?
A high ATR means large daily ranges, usually after news or in sell-offs. It does not say whether prices will rise or fall; it only says the market is moving more than usual relative to its own history.
How many ATRs should a stop loss be?
Factors between 1 and 3 ATR are often used; there is no single correct one. In my SPY test, a 2 × ATR stop was hit within 10 sessions in about a third of cases. A wider stop is hit less often but loses more per share when it is hit; with position sizing, the planned loss per trade can stay the same.
Does the ATR show a change of trend?
No, the ATR does not show a trend change. It measures volatility, not direction. Rising volatility can come with a new trend or with a sell-off, so you need price structure or a trend tool to read the direction.
This English edition is based on our German edition on kagels-trading.de and has been adapted for international readers.
More Technical Indicators guides
- Judge a golden cross
Golden Cross: Definition and S&P 500 Test Results
How the 50-day and 200-day averages cross, and what 38 signals in the S&P 500 since 1950 did against the base rate and buy and hold.
- Use moving averages
Moving Averages: SMA, EMA and a 76-Year 200-Day Test
SMA, EMA and WMA formulas with a worked example, common periods, and what the 200-day line showed on the S&P 500 since 1950.
- Read the RSI
RSI Indicator: Formula, Settings and a 75-Year Test
The RSI formula, overbought and oversold, and what RSI signals did on the S&P 500 since 1951 against the base rate.
- Read volatility with Bollinger Bands
Bollinger Bands: Settings, Squeeze and a 76-Year Test
Settings, the three typical chart situations, five strategies with rules, and what the bands and the squeeze showed on the S&P 500 since 1950.
- Trade Donchian breakouts
Donchian Channel: Breakout Rules and a 20-Year ETF Test
Channel rules, the current-bar pitfall, the Turtle systems, and what 499 breakout trades in SPY, GLD and TLT from 2006 to 2026 showed.
- Read the MACD
MACD Indicator: Histogram, Divergence and a 31-Year Test
Formula, histogram, crossovers and divergences, with a 31-year test on the S&P 500 and the DAX against the base rate.
- Use VWAP
VWAP Indicator: Formula, Anchored VWAP and TradingView Setup
The VWAP formula, trend day versus range day, Anchored VWAP and the right settings in TradingView.