
Trend Following Strategies: Rules, Tools and a 76-Year Test


Contents
- Trend following in 30 seconds
- What is trend following?
- Trend following models: rules instead of judgment
- Why do trends persist?
- How do you recognize a trend?
- Trend following and its alternatives
- The main tools of trend followers
- A simple example: the 200-day rule
- Which timeframe works best?
- The seven most common trend following mistakes
- Which markets suit trend following?
- Pros and cons of trend following
- Conclusion: trend following works, but not the way most people hope
- Frequently asked questions about trend following
- About the author
Trend following means you buy what is already rising and sell what is already falling, and you stay in until the trend breaks. You do not try to call the top or the bottom. You accept that you will miss the start and the end of every move and earn your money in the middle. That simple idea has been used by traders for more than a century and by large futures funds for decades.
In this guide you get the rules, the tools and the honest numbers. We explain how to read a trend, which indicators trend followers use and where the method fails. Then we show what 224 trades of a simple 200-day trend filter on the S&P 500 did from 1950 to 2026. This article follows our editorial policy; it is education, not investment advice.
Trend following in 30 seconds
- Idea: trade in the direction of an existing trend and exit when it breaks, instead of predicting turns.
- Typical result: many small losses and a few large winners. In our 200-day test, only 43 percent of trades made money.
- Main enemy: sideways markets, where the rules buy and sell back and forth at a loss.
- What it buys you: smaller drawdowns. Our filter cut the largest S&P 500 decline from 56.8 to 24.0 percent, but earned 7.2 instead of 8.2 percent a year.
- What it needs: fixed rules, a stop and the patience to sit through long losing streaks.
What is trend following?
Trend following is a trading method that identifies an existing price move and trades in its direction instead of forecasting turning points. When a stock or an index keeps rising, you buy or stay long. When it keeps falling, you sell short or stay out. The old market saying “the trend is your friend” sums it up.
The idea is old. Jesse Livermore waited for the market to confirm its direction before he bought and added to positions only when they were already in profit. In 1983 Richard Dennis taught a group of beginners a purely rule-based system that bought breakouts above 20-day and 55-day highs. The full rules are in our guide to Turtle Trading, and Ed Seykota is another well-known name of the same school.
Trend following differs from contrarian trading at the root. A contrarian tries to anticipate a reversal and buys weakness. A trend follower waits until the market has shown its direction and buys strength. Neither is right in every market phase.
Trend following models: rules instead of judgment
A trend following model is a fixed set of rules that derives entries, exits and position size from price data alone. It needs no forecast and leaves no room for a decision in the moment. You decide in advance and then follow the rules.
That is what makes a model testable. Anything written as a fixed rule can be checked against decades of historical prices. A gut decision cannot. Our guide to backtesting shows how to run such a test without fooling yourself, including the dividend trap that makes trend filters look better than they were.
Why do trends persist?
Research finds that past returns of a market tend to continue for a while. Moskowitz, Ooi and Pedersen studied 58 liquid futures on equity indexes, currencies, commodities and bonds in their paper Time Series Momentum (Journal of Financial Economics, 2012). They found that a market’s own past return tended to persist for about a year and partly reversed over longer periods.
This is time series momentum, and it is what trend followers trade. A related effect, cross-sectional momentum, compares assets with each other: past winners tended to beat past losers. Asness, Moskowitz and Pedersen documented it across eight markets and asset classes in “Value and Momentum Everywhere” (Journal of Finance, 2013). Both are historical findings, not guarantees.
Behavior and market structure offer explanations. Investors react slowly to new information, then herd into moves they missed. Large funds spread big orders over days or weeks, and stop-loss orders can push a move further once they trigger. None of this tells you how long the next trend will last.
How do you recognize a trend?
There is no single definition of a trend, so pick one method and use it consistently. The most common definition comes from market structure: a series of highs and lows. What looks like an uptrend on a daily chart can be a downtrend on an hourly chart, so the timeframe is part of the definition.
- Uptrend: higher highs and higher lows. A rising trendline under the lows holds, and moving averages slope up.
- Downtrend: lower highs and lower lows. A falling line over the highs holds, and moving averages slope down.
- Sideways market: price moves between support and resistance, and moving averages run flat and cross each other.
The sideways market is the trend follower’s trap. Every small push looks like a new trend, the rules buy, and price falls back into the range. Our guide to support and resistance explains how to mark such zones, and our range trading guide covers the strategies that work there. How to read trends from highs and lows alone is in our guide to price action trading.
Trend following and its alternatives
Each method fits a different market phase. Trend following needs directional markets. The table shows where the main alternatives work and where they fail.
| Method | Works best in | Fails in |
|---|---|---|
| Trend following | Long directional moves | Sideways markets |
| Breakout trading | The start of new trends after a range | False breakouts |
| Mean reversion and range trading | Stable sideways markets | Strong trends |
| Contrarian trading | Major turning points | Trends that keep running |
Breakout trading is a close relative. It enters when price leaves a range, which is how the Turtles caught the start of many trends. Our breakout trading guide shows how often breakouts fell back into the range in our own count, and why a stop is part of every breakout trade.
The main tools of trend followers
Most trend tools answer one of three questions: what is the direction, how strong is it, and where do I get out. Use one or two of them, not all at once; more tools mean more conflicting signals. Each tool has its own guide on our site.
- Trendlines: the classic way to see direction and the point where a trend breaks. See trendline trading.
- Moving averages: a smoothed line of past closes; price above a rising average is a common long-term filter. See moving averages and the golden cross.
- MACD: shows momentum as the gap between two moving averages. See the MACD indicator.
- ADX: measures trend strength without direction. See the ADX indicator.
- Donchian channel: the highest high and lowest low of a period, the breakout tool of the Turtles. See the Donchian channel.
- SuperTrend: an ATR-based line that flips with the trend and works as a trailing stop. See the SuperTrend indicator.
- Bollinger Bands: show volatility; a squeeze can come before a new trend. See Bollinger Bands.
A simple example: the 200-day rule
The best-known trend rule fits into one line: hold the S&P 500 while it closes above its 200-day average, and hold cash while it does not. The 200-day moving average is one of the most widely watched lines on index charts. It is simple, needs no judgment and can be tested over many decades.
We tested this rule on the S&P 500 from 1950 to October 15, 2026. The rule: long while the close is above its 200-day simple moving average, trade at the next close, 0.05 percent cost per side, cash earns nothing, price index without dividends. The full test is in our guide to moving averages; here are the main numbers.
| S&P 500, 1950 to 2026 | 200-day filter | Buy and hold |
|---|---|---|
| Return per year | 7.2% | 8.2% |
| Largest decline | 24.0% | 56.8% |
| Time in the market | 71.6% | 100% |
Source: own calculation, ^GSPC daily closes from Yahoo Finance, 224 round trips. Without dividends; with dividends, buy and hold gains more, because it never misses one.
Only 43 percent of the trades made money, and that is normal for trend following. Of 224 closed trades, 97 were winners with an average gain of 8.4 percent and 127 were losers with an average loss of 1.5 percent. The best trade ran from November 1953 to May 1956 and gained 80.7 percent. The ten best trades alone made up about two thirds of the combined result of all closed trades, measured in log returns.
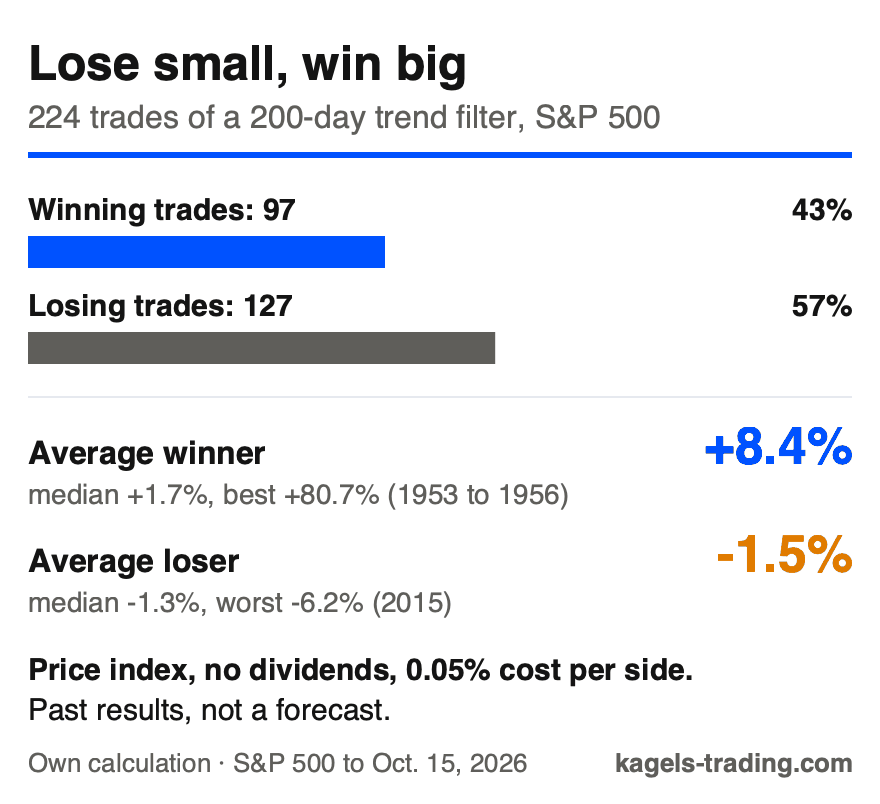 Click to enlarge
Source: Kagels Trading, own calculation (model from our moving averages test).
The filter did not beat buy and hold; it reduced the damage. It earned about one point a year less, mostly because it sat out part of the market and paid for false signals: 58 percent of all trades lasted less than ten trading days. In exchange, it avoided most of the deepest bear markets. Our backtesting guide shows the same pattern on SPY with dividends, where the gap after 2012 grew to almost four points a year.
When does the rule fail? In choppy markets around the line, it sells low and buys back higher again and again. In long bull markets without deep corrections, it simply costs return. If you cannot live with long stretches of small losses while buy and hold looks better, you will abandon the rule right before it pays off.
Which timeframe works best?
There is no single best timeframe, and the number of false signals depends on your rules and the market. On weekly and daily charts, a trend usually spans weeks to months, and each signal is based on more price data. On hourly charts, trends appear every day; many traders find more whipsaws there, and every extra trade adds costs. Test your own rule on the timeframe you plan to trade.
Match the timeframe to your style. Swing trading usually works with daily and four-hour charts and holds positions for days to weeks. Day traders use hourly charts and below. Many traders check the higher timeframe first and trade only in its direction; our guide to multi-timeframe analysis explains how.
Stage analysis is a classic weekly trend method. Stan Weinstein divides a stock’s life into four stages and buys only in stage two, the uptrend. The rules are in our guide to stage analysis, and Mark Minervini built a stricter trend template on top of it.
The seven most common trend following mistakes
- Entering too early: you buy the first green candles after a fall and call it the bottom. Wait until the structure shows a trend; missing part of a move costs less than buying into a falling market.
- Stops that are too tight: normal noise takes you out before the trend runs. Place the stop beyond a swing low or use a volatility stop based on the ATR; see our volatility stop loss guide.
- Trading sideways markets: flat moving averages and a low ADX show that there is no trend to follow. Stand aside until price leaves the range.
- Ignoring risk management: no stop and positions that are too large turn one bad trade into months of recovery. Our guide to position sizing shows how to cap the risk per trade.
- Emotions instead of rules: cutting winners early and letting losers run is the exact opposite of trend following. Write the exit rules down before you enter.
- Ignoring major news: central bank decisions and earnings can end a trend in minutes. Know the calendar before you hold a position through an event.
- Too many indicators: five tools that disagree lead to paralysis. One direction filter, one entry rule and one exit are enough.
Which markets suit trend following?
Trend following can be applied to liquid markets, but the character of the trends differs. Whether it pays depends on the rules, the costs and the period. Futures funds trade many markets at once because diversification across stocks, bonds, currencies and commodities raises the chance that at least some of them trend at any time.
- Stock indexes and stocks: long upward drift over decades, with sharp bear markets that trend filters try to avoid.
- Commodities: supply and demand cycles can create long trends in both directions, for example in energy and metals.
- Currencies: trends often follow interest rate differences between countries, but many pairs also spend long periods in ranges.
- Gold: reacts to inflation, real rates and crises and has had long multi-year trends.
- Crypto: extreme trends in both directions, but also extreme volatility and news risk; position size matters even more.
Pros and cons of trend following
Pros
- Clear rules: entries and exits follow fixed signals.
- Big winners: long trends can pay for many small losses.
- Both directions: works long and short, and as a filter it can keep you out of bear markets.
- Testable: fixed rules can be backtested honestly.
Cons
- Low hit rate: in our test only 43 percent of trades won.
- Whipsaws: sideways markets produce many false signals.
- Late entries and exits: you always miss the start and the end of a move.
- Long losing streaks: they test discipline more than any chart.
Conclusion: trend following works, but not the way most people hope
Trend following does not predict, it reacts, and its edge comes from letting a few big winners pay for many small losses. Our 76-year test of a simple 200-day rule shows both sides: a much smaller largest decline, but lower returns and a 43 percent hit rate.
If you want to use it, start with one market, one timeframe and one rule. Test it with realistic costs and dividends, size every position so a losing streak cannot hurt you, and follow the exits even when it hurts. The method only works for traders who can stay with it through the dull and the losing phases.
Frequently asked questions about trend following
What is a trend following strategy in simple terms?
You trade in the direction of an existing trend and stay in until the trend breaks. You buy when prices are already rising and sell or stay out when they are falling. You do not try to guess turning points.
How does trend following work for beginners?
Four steps: identify a trend, wait for an entry, set a stop and let the trend run. Use market structure or a moving average to find the trend, enter on a breakout or a pullback, risk only a small part of your account per trade and exit when the trend breaks. Our pullback trading guide covers one of the common entries.
Why do most trend following trades lose?
Because the method buys every new move, and most of them fail. In our 200-day test, 57 percent of trades lost, but the average loss was small. A few long trends, such as 1953 to 1956, made up most of the total gain.
Does the 200-day moving average strategy beat buy and hold?
Not in our test of the S&P 500 from 1950 to 2026. The filter earned 7.2 percent a year against 8.2 percent for buy and hold, without dividends. Its benefit was the smaller largest decline: 24.0 percent instead of 56.8 percent.
Which indicators are best for trend following?
There is no best indicator, only tools for different questions. Moving averages and trendlines show direction, the ADX shows strength, and the SuperTrend or an ATR stop shows where to exit. One tool per question is enough; more tools mean more conflicting signals.
How do I tell a real trend from a false signal?
Look for structure, slope and strength together. A real uptrend shows higher highs and higher lows, a rising moving average and often a rising ADX. Flat averages and a low ADX point to a sideways market, where most false signals happen.
This English edition is based on our German edition on kagels-trading.de and has been adapted for international readers.
More Chart Techniques guides
- Draw key levels
Support and Resistance: How to Draw and Use Key Levels
Where useful levels come from, how to draw zones with a stated rule and how to turn a level into a trade plan.
- Read price action
Price Action Trading: How to Read Charts Without Indicators
Market structure, key zones and three bar patterns, with a core setup and a real SPY example where the signal failed.
- Read candlestick charts
How to Read Candlestick Charts: Body, Wicks and Context
Open, high, low and close in one candle, body and wicks, two real Gold candles read step by step and how often patterns really occur.
- Know candlestick patterns
Candlestick Patterns: 10 to Know, Tested on Real Data
Ten patterns with rules and a cheat sheet, counted on DAX, S&P 500, EUR/USD and Gold since 2014: most are rare, none is a signal on its own.
- Trade the hammer candle
Hammer Candlestick: Spot It, Trade It, Know Its Limits
Three features, the difference to inverted hammer and hanging man, entry and stop, and how rarely the hammer appeared in four markets since 2014.
- Spot a morning star
Morning Star Candlestick: Rules, Real Cases, Limits
Three measurable rules, every morning and evening star in four markets since 2014, and two real cases: one reached its target, one hit its stop.
- Spot a topping tail
Topping Tail Candlestick: Rules, Silver Example and Limits
Six measurable rules for the bearish rejection candle, a silver candle from January 2026 checked step by step, the difference from the shooting star and how to trade it with a stop.
- Combine timeframes
Multi-Timeframe Analysis: A Weekly and Daily Workflow
How to combine the weekly chart for context and the daily chart for entry under one stated rule, with a documented SPY case from June 2025.
- Trade pullbacks
Pullback Trading: Entries, Stops and Failed Setups
Pullback or reversal, limit against confirmation entry, and one fixed rule set on three real QQQ cases: a target, a stop and a cancelled setup.
- Trade sideways ranges
Range Trading: Boundaries, Orders and Two Documented Fades
A 14-session rule to draw horizontal boundaries, three order-type variants and two Alpaca-verified SPY fades, one that reached the target and one that was stopped out.
- Read a consolidation
Consolidation in Trading: What the Range Tells You
What a consolidation is, why 25 years of index data showed no stable direction edge from narrow ranges or the prior trend, and two DAX breakouts from 2026.
- Read chart formations
Chart Patterns: Reversals, Continuations and Failures
Reversal, continuation and bilateral formations with the measured-move convention per pattern and two documented SPY rectangle cases.
- Trade rising and falling wedges
Rising and Falling Wedge Patterns: How to Trade Them
How to spot both wedges, where to set entry, stop and target, and why Bulkowski ranks the rising wedge with a downward breakout last of 36 patterns.
- Trade triangle breakouts
Triangle Pattern: Ascending, Descending and Symmetrical
Ascending, descending and symmetrical triangles: entry, stop and target, three chart examples and what Bulkowski's data say about reliability.
- Trade the cup and handle
Cup and Handle Pattern: Rules, Targets and Real Hit Rates
Rounded cup, short handle: entry, stop and target, why volume matters, and Bulkowski's numbers, 61 percent reach the target but 47 percent fall back after the breakout.
- Trade breakouts
Breakout Trading Strategy: Entries and False Breakouts
How often breakouts fell back into the range in our count of 1,472, and how to plan entry, stop and position size.
- Draw and trade trendlines
Trendline Trading: How to Draw Trendlines and Trade Them
How to draw trendlines with a fixed rule, four strategies for bounces, breaks and retests, and a real SPY line break without a lasting reversal.
- Draw a pitchfork channel
Andrews Pitchfork: How to Draw It, Trade It and Test It
Three pivots, a median line and two parallels, Schiff variants, a trade plan and how often price reached the median line in 746 cases.
- Use Fibonacci levels
Fibonacci Retracement Levels: How to Draw and Trade Them
How to calculate and draw retracement levels, trade pullbacks with confluence and a stop at the structure, and what a ten-year test says about the levels.
- Set Fibonacci targets
Fibonacci Extension: Levels, How to Draw It and Calculator
Three-point extension targets from the end of a pullback, why they differ from levels beyond 100%, a free calculator and three SPY swings, one without a single target reached.
- Trade gaps
Gap Trading Strategy: How to Trade Gaps and When Gaps Fill
Opening and full gaps, the four classic gap types, how often SPY gaps filled in our count since 2001, and plans for gap fill and gap and go.
- Calculate pivot points
Pivot Points: Formulas, Types and How to Trade Them
Formulas for standard, Fibonacci, Woodie, Camarilla and DeMark pivots, a free calculator, which session counts and a real SPY day.
- Swing trade
Swing Trading: 4 Strategies, Risk and Real Examples
Four swing trading strategies on the daily chart, position size, gap risk and US rules, with two hypothetical SPY pullbacks: one hit its target, one was stopped out.
- Identify market stages
Stage Analysis: Stan Weinstein's Four Market Stages
Stan Weinstein's four stages on the weekly chart, a Stage 2 checklist and two TSMC breakouts: one ran for a year, one gapped through its stop.
- Choose a chart type and timeframe
Trading Charts: Types, Timeframes and How to Read Them
Line, bar, candlestick and Heikin Ashi charts, charts without a time axis and the right timeframe for each trading style, with current EUR/USD, gold and DAX examples.
- Read Kagi charts
Kagi Charts: Reversal Amount, Shoulders and Signals
One line, one reversal amount, thick yang and thin yin: tested on DAX hourly data and compared with Renko and point and figure.
- Screen for growth leaders
CAN SLIM: William O’Neil’s Seven Rules for Growth Stocks
William O'Neil's seven CAN SLIM criteria with thresholds, his selling rules, a free screen with real counts and what the tests really show.
- Read Wyckoff ranges
Wyckoff Method: Accumulation, Distribution and Springs
Accumulation and distribution with phases A to E, springs and upthrusts as optional tests, and two real TSMC ranges read with and without hindsight.
- Trade Darvas boxes
Darvas Box Strategy: Rules, Entries and Stop Losses
The box rules step by step, when the edges become known, where the stop goes, and a mechanical test on TSMC in 2024 with two honest results.
- Count Elliott waves
Elliott Wave Theory: Rules, Patterns and Fibonacci
The five-wave pattern, three hard rules, zigzags, flats and triangles, Fibonacci ratios and a real DAX count, from the first German translator of the standard work.
- Understand Smart Money Concepts
Smart Money Concepts (SMC): What They Are and What Holds Up
The seven SMC building blocks, BOS vs CHoCH vs MSS, one labeled SPY sequence that held, one that failed, and what a chart can and cannot show.
- Understand ICT trading
ICT Trading: Silver Bullet, Killzones and What Holds Up
Michael Huddleston's Inner Circle Trader method: Silver Bullet, Judas Swing, the 2022 model and killzones in New York time, with one SPY setup that worked and one that failed.
- Trade order blocks
Order Blocks: How to Spot, Draw and Trade the Zone
The three conditions behind a valid order block, entry and stop at the zone, two SPY cases from 2026 and a 25-year count where a fixed rule lost money.
- Trade fair value gaps
Fair Value Gap (FVG): How to Spot, Trade and Test It
The three-candle rule, bullish, bearish and inverse FVG, two SPY cases from 2026 and a 25-year count of how often gaps were revisited and traded.
- Trade inverse fair value gaps
Inverse Fair Value Gap (IFVG): Rules, Examples and a Test
When a broken gap counts as inverted, three entry styles, one SPY retest that held, one that failed, and a 25-year test with trend and sweep filters.
- Trade failed breakouts with Turtle Soup
Turtle Soup Trading: Raschke Rules, ICT Version and a Test
Linda Raschke's original rules, Turtle Soup Plus One and the ICT version side by side, two SPY examples and a 25-year test on SPY and QQQ.
- Read a break of structure
Break of Structure (BOS): Rules, CHoCH vs MSS and a Test
Which swing counts, BOS vs CHoCH vs MSS under one stated convention, two SPY breaks that won and lost, and a 25-year test against ordinary days.
- Read a change of character
Change of Character (CHoCH): Rules, BOS vs MSS and Data
The first close against the trend, close versus wick, CHoCH vs BOS vs MSS, two SPY cases and what the trend did next after 287 CHoCHs on SPY and QQQ.
- Read a market structure shift
Market Structure Shift (MSS): Rules, BOS vs CHoCH and Data
MSS as a CHoCH with a sweep and a fair value gap, the comparison with BOS and CHoCH, two 2021 cases and what 14 daily MSS on SPY and QQQ did next.
- Draw supply and demand zones
Supply and Demand Trading: Zones, Rules and Real Data
Base and departure rules, the four base patterns, how zones differ from order blocks and SMC, two SPY cases and a fixed test of 86 zone trades on SPY and QQQ.
- Read liquidity sweeps
Liquidity Sweep: How to Spot It and Trade the Reversal
Sweep or run, buy-side and sell-side liquidity, internal and external targets, SPY reversal, continuation and failed-reversal examples and a 25-year count of a fixed sweep rule.
- Spot bull and bear traps
Bull Trap vs Bear Trap: How to Spot a Trapped Market
What bull traps and bear traps are, the two signs of trapped traders, how to trade the reversal with a defined stop, and two real SPY examples from 2025.
- Learn the Turtle rules
Turtle Trading: The Original Rules of Richard Dennis
The key original Turtle trading rules: entries, position size with N, the 2N stop, adding units and the exits.