
Swing Trading: 4 Strategies, Risk and Real Examples


Contents
- Swing trading in 30 seconds
- What is swing trading? Definition and examples
- Swing trading vs day trading vs position trading
- Who swing trading suits: pros and cons
- The 4 swing trading strategies: rules for each
- Two SPY examples: one hit its target, one was stopped out
- Risk management: position size, stop and gap risk
- US rules for swing traders: PDT, margin and taxes
- Before real money: practice first
- Indicators for swing trading: what they show
- How to plan a swing trade with a day job
- Conclusion: swing trading fits people with limited screen time
- Frequently asked questions about swing trading
- About the author
A trading style has to fit the time you can give it. If you sit at your desk at nine, you cannot follow a 5-minute chart. This is where swing trading comes in: you hold positions for several days to a few weeks and make your decisions on the daily chart, usually after the close.
This guide shows how swing trading works in practice. It covers four strategies I have used and taught over many years, risk management, the current US rules and the honest downside: overnight, your stop protects you only to a limited degree. Two hypothetical SPY examples show the same setup once reaching its target and once stopped out. This article follows our editorial policy.
Swing trading in 30 seconds
- Holding period: positions stay open for days to weeks. Analysis happens on the 4-hour and daily chart.
- Time: with a small watchlist, the signal check after the close often takes me 10 to 30 minutes a day. Opening checks, order management, learning and journaling come on top.
- Four core strategies: pullback to a moving average, pullback into the 50 to 61.8 % zone, breakout from a range and the role reversal of support and resistance.
- Risk per trade: a small, fixed share of the account, often 0.5 to 2 %. The stop belongs where the setup is proven wrong.
- The catch: overnight risk. A gap can make a stop-market order fill worse than planned; a stop-limit order may not fill at all.
What is swing trading? Definition and examples
Swing trading is a trading style in which positions are held for several days to a few weeks to capture a single price move within a larger trend. Analysis takes place on the 4-hour or daily chart, and decisions are usually made once a day after the close.
A swing is the connected price move between two clear turning points on the chart, from a low to the next high or the other way round. These turning points are called the swing high and the swing low. A swing trader wants to catch one of these legs within the trend, not the whole move.
Almost any liquid market can be swing traded: stocks, ETFs, stock index futures, currencies and commodities. What matters is enough liquidity for clean fills.
Falling prices can be traded too, but short selling has its own risks. Selling a stock short in the US requires broker approval, shares the broker can borrow and enough margin; borrow fees may apply, and losses can exceed the money you put in, as the SEC explains in its investor bulletin on short sales. Futures and options are separate instruments with their own rules. This guide uses long examples.
Swing trading vs day trading vs position trading
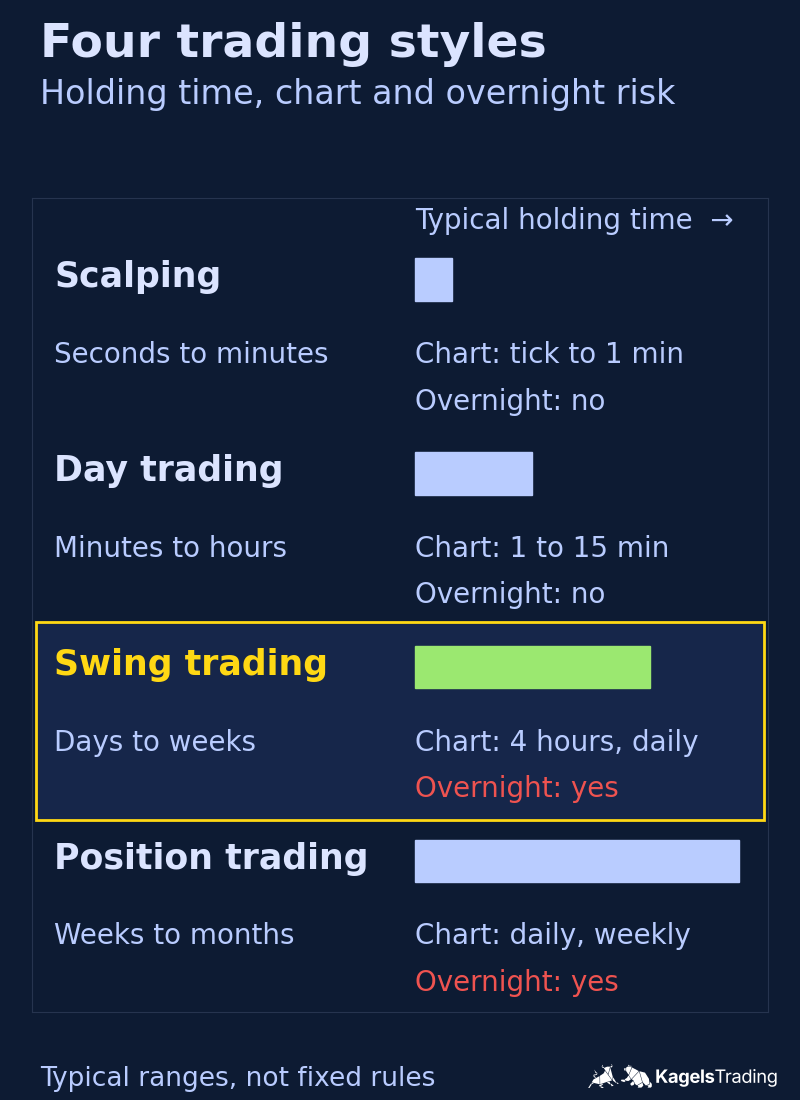
Trading styles differ in holding time, chart time frame and, above all, the time you need. A style you have no time for becomes a source of errors.
 Click to enlarge
Source: Kagels Trading, own drawing.
Swing trading sits between day trading and position trading. Day trading closes positions before the session ends and avoids overnight risk, but needs you at the screen during market hours. Position trading holds for weeks to months and needs much wider stops; Stage Analysis is a classic position trading method on the weekly chart. Swing trading accepts the overnight risk and gives you time back in return.
Who swing trading suits: pros and cons
Swing trading is not easier trading, it is different trading. These are its strengths and honest limits.
Pros:
- Less time at the screen: the signal check after the close is usually enough for the analysis. The daily bar is finished and the picture clear. Opening checks and existing orders still need attention.
- Lower trading costs: 20 trades a month instead of 200 cost a fraction in commissions and spreads at comparable position size. Margin interest on positions held overnight can eat part of that advantage.
- Fewer rushed decisions: deciding without time pressure can reduce impulse trades.
- Larger moves per trade: a swing over several days often covers more points than an intraday move, which makes costs easier to earn back.
Cons:
- Overnight and weekend risk: between the close and the next open a gap can form. A stop-market order then fills at the next available price, possibly worse than the open.
- Few opportunities: sometimes days or weeks pass without a valid setup, and the temptation to trade out of boredom grows.
- Wider stops: on the daily chart the stop sits further away than on a 5-minute chart. At the same dollar risk that means a smaller position, not a larger risk.
- Slow feedback: with a few trades a month, judging a strategy takes months.
The 4 swing trading strategies: rules for each
There is no best strategy, only strategies that suit a certain market phase. The first three look for a continuation in the direction of the trend, the fourth works at a broken price level. All four run on the daily chart.
One execution rule applies to all four. The signal is a closed daily bar. After it closes, I define the invalidation level, the stop, the highest price I am willing to pay and the minimum reward-to-risk I need. At the next open I check the setup again: if price opens at or below the stop, or above my maximum price, I skip the trade. The live entry comes after that check, so it can differ from the opening print; a limit order caps the price but may not fill.
Strategy 1: pullback to the moving average
This is the classic among trend-following setups. You do not buy the breakout; you wait until price comes back within the running trend. A pullback is a temporary move against the trend that pauses it without ending it.
- Trend filter: the 20-day moving average rises and price trades above it.
- Wait for the pullback: price comes back to the average. A close clearly below it cancels the setup.
- Signal bar: a bar with buying pressure that closes above the average, for example a pin bar or a bullish engulfing bar. Our guide to price action trading explains these patterns.
- Stop below the pullback low: not on the average itself, but below the last swing low, where the trend structure is proven wrong.
The SPY examples below use one exactly defined variant of this strategy. It replaces the judgment calls with fixed numbers: any bullish close qualifies as a signal, and the stop goes below the lowest low of three sessions. A three-session low is a mechanical stand-in, not automatically a structural swing low.
Strategy 2: pullback into the 50 to 61.8 % zone
The second variant measures the pullback against the prior impulse instead of an indicator. The tool is the Fibonacci retracement, which divides a prior move into percentage sections where traders watch for the end of a pullback; the common levels are 38.2, 50 and 61.8 %.
I use the zone between 50 and 61.8 % as a working area. It is deep enough for a reasonable reward-to-risk ratio and shallow enough for the trend to stay intact. If price closes clearly below 61.8 %, this setup is weakened for me; whether the trend is broken is decided by the market structure, not by the Fibonacci level.
- Define the impulse: a clear, strong move that makes a new high.
- Draw the zone: from the start of the impulse to its high, then read the 50 and 61.8 % levels.
- Wait for a reaction: a visible signal in the zone, such as a bar with a long lower wick. No reaction, no entry.
- Stop below the low of the reaction: if that low already lies below the 78.6 % level, I skip the setup, because the pullback is too deep for this strategy.
Strategy 3: breakout from a tight range
Not every market trends; often price swings between two levels for weeks. A breakout happens when price leaves such a range and closes outside it. A price that pokes above a level and ends the day below it has proven nothing, so I work with closing prices here.
- Mark the range: two to four weeks of sideways movement, bounded by a line above and below.
- Wait for the close: only a daily close outside the range counts as a signal.
- Volume as optional confirmation: for stocks and ETFs, rising volume can support the breakout. It is no proof against a false breakout.
- Choose one stop design before entry: either a protective stop around the middle of the range or below the breakout bar, or an exit after a daily close back inside the range. A touch or retest of the boundary alone does not invalidate the breakout.
Many breakouts do not hold. In our own count of 1,472 breakouts in three stock indexes, about two thirds closed back inside the range within ten trading days. How to plan for that is explained in our guide to breakout trading.
Strategy 4: role reversal of support and resistance
A broken resistance can later act as support. If you understand support and resistance, this gives you clear invalidation levels. A clear high acts as resistance, price breaks above it, falls back and tests it from above. If it holds, you enter with a signal bar, such as an inside bar or a pin bar.
The advantage is the stop distance; the drawback is frequency. A nearby invalidation level can give a short stop distance; your position size determines the planned dollar risk. Clean setups of this kind are rare. A trendline can also mark where a pullback may end; see our guide to trendline trading.
Two SPY examples: one hit its target, one was stopped out
Rules only become clear when you apply them to real prices. I have applied one fixed variant of Strategy 1 to SPY, the large S&P 500 ETF, in the fall of 2025. Both examples are hypothetical: I selected them afterwards to show the mechanics, they are not trades I executed, and two cases prove no win rate and no edge.
These are the exact rules of the model:
- Trend: the 20-day simple moving average of the closes is higher than the day before.
- Pullback: the low of the signal bar lies within 0.2 % of the 20-day average, above or below it. The 0.2 % is a teaching parameter I chose, not a tested optimal value.
- Signal: the bar closes above its open and above the 20-day average.
- Entry: modeled at the next session’s recorded regular opening price. A live entry comes after the opening check and can differ. This model has no maximum gap filter for the entry.
- Stop: 1 cent below the lowest low of the signal day and the two sessions before it.
- Target: 2R, twice the distance from entry to stop. No trailing stop; a trailing stop would make it a different strategy.
Example 1: the target was reached
 Click to enlarge
Source: Data from Yahoo Finance and IBKR, chart by Kagels Trading.
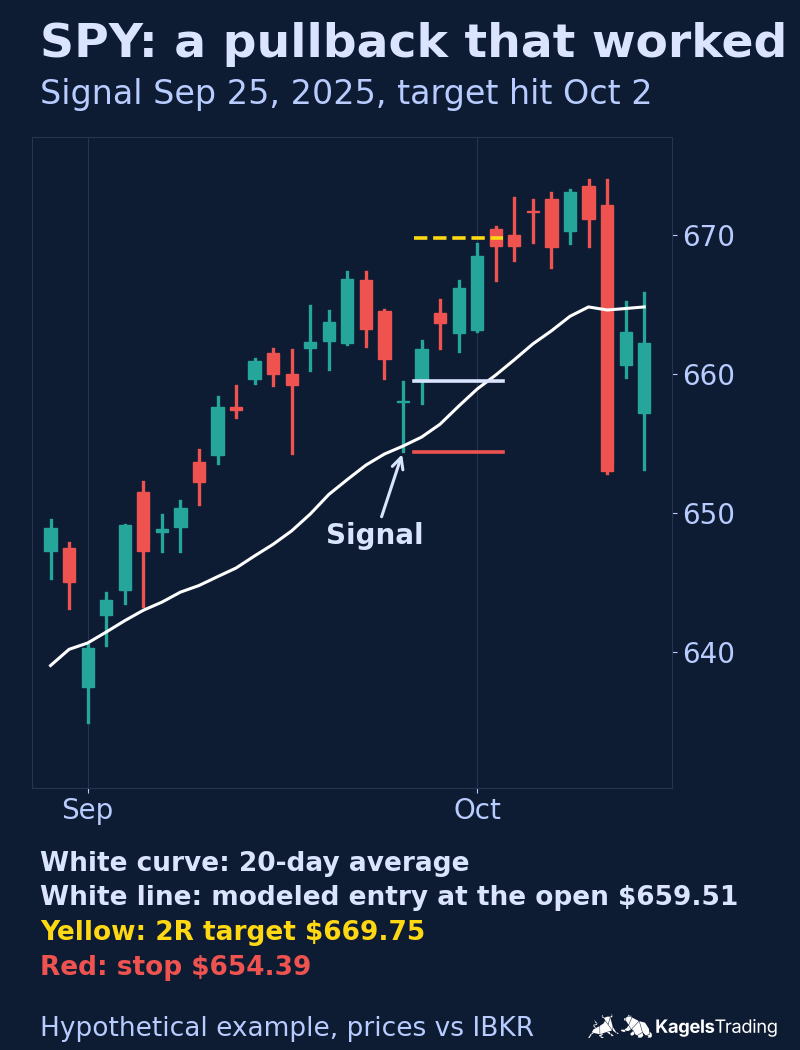
On September 25, 2025, SPY pulled back to its rising 20-day average. The low of the day was $654.40, 0.06 % below the average of $654.80, and the bar closed higher at $658.05.
The model enters at the September 26 open of $659.51, well above the stop level. The stop goes 1 cent below the three-day low, at $654.39. That is a risk of $5.12 per share, so the 2R target is $669.75.
On October 2 SPY opened at $670.47, already above the target. A resting sell limit could have received a price above the limit, but these daily bars do not establish the fill. I therefore count the result conservatively as +2R.
Example 2: the same setup was stopped out
 Click to enlarge
Source: Data from Yahoo Finance and IBKR, chart by Kagels Trading.
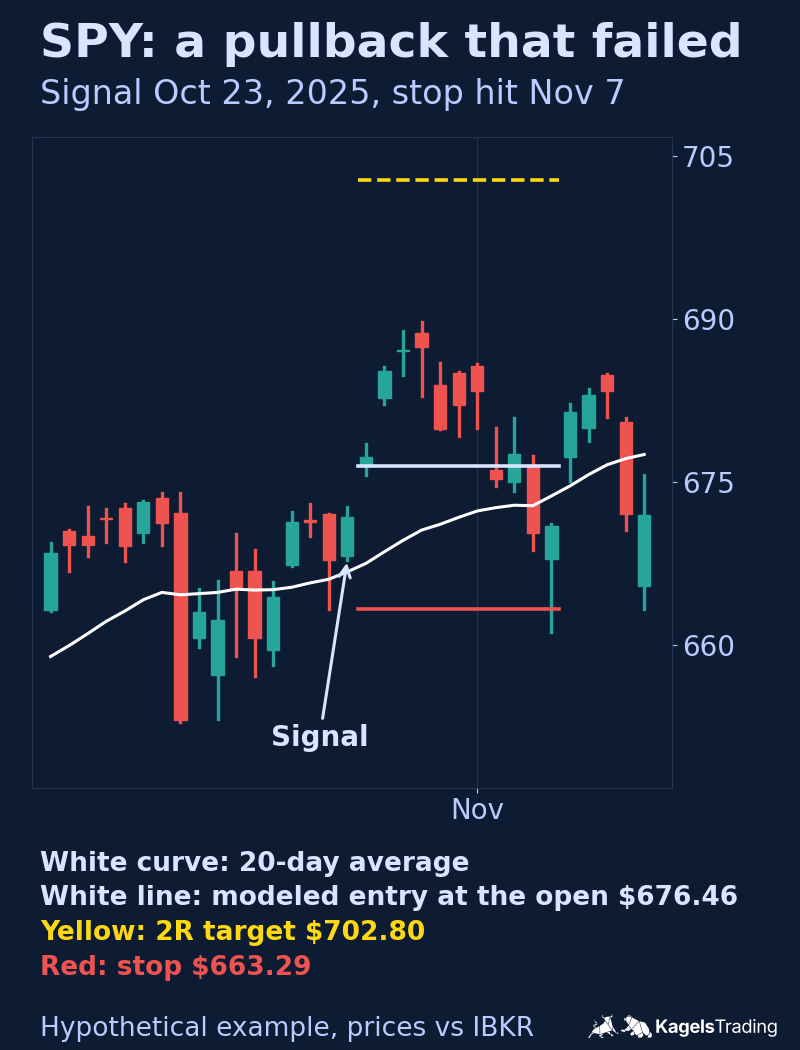
Four weeks later the same rules gave the next signal. On October 23, 2025, the low of $667.80 stayed 0.16 % above the rising 20-day average of $666.71. Price came close to the average without touching it, which the 0.2 % rule allows. The bar closed at $671.76.
The model enters at the October 24 open of $676.46. The three-day low was $663.30 on October 22, so the stop goes to $663.29. The risk is $13.17 per share, and the 2R target $702.80.
At first the modeled position moved into profit. On October 29 SPY reached $689.70, about 1R on paper. Then the market turned. On November 7 SPY opened at $667.91, still above the stop, and fell to $661.20 during the session. The model assumes a fill at the stop price, which gives −1R before costs; the daily bar proves only that the stop was crossed, not the exact fill.
The 1R paper profit was never banked profit. The rules had no partial exit and no trailing stop, and adding one afterwards would mean testing a different strategy. A good setup can still end as a loss.
What these two trades mean in dollars
Position size comes from the stop, not from a wish. Assume an account of $25,000 and a planned risk of 1 %, so $250 per trade. Shares are rounded down so the planned loss stays within the budget.
| Example 1 | Example 2 | |
|---|---|---|
| Risk per share | $5.12 | $13.17 |
| Shares (rounded down) | 48 | 18 |
| Planned loss at the stop | $245.76 | $237.06 |
| Result in this model | +2R +$491.52 |
−1R −$237.06 |
The wider stop in Example 2 means fewer shares. That keeps the planned loss in dollars almost the same. Both results are modeled and before commissions, fees and slippage.
Risk management: position size, stop and gap risk
This is where a strategy turns into a result. In my experience, a single position that is too large does more damage than a weak analysis.
Position size is the number of shares or contracts at which a trade loses the planned amount if the stop is filled exactly at the stop price, before costs. First you decide how much a trade may cost; many traders use 0.5 to 2 % of the account, far below what the Kelly criterion allows in its simplified model. The formula is: planned loss = shares × stop distance × point value. For stocks and ETFs the point value is 1. You adjust the size to the stop, never the stop to the size.
 Click to enlarge
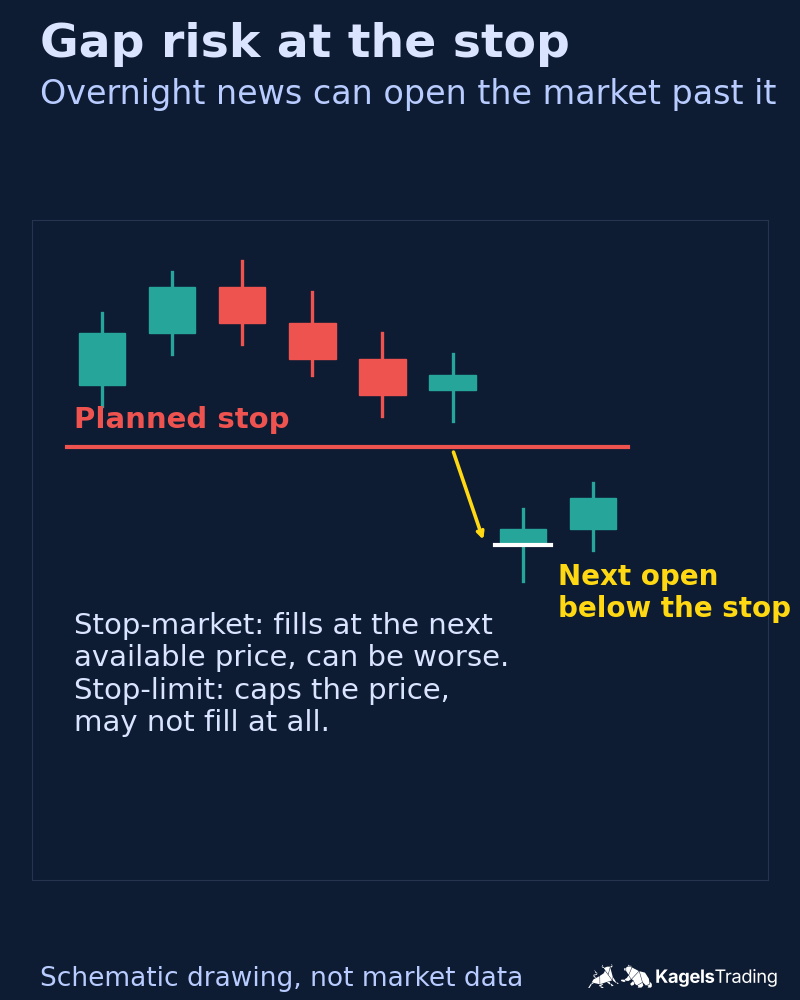
Overnight risk is the danger that a market reopens far from its last close and forms a price gap. A stop-market order becomes a market order once it is triggered and fills at the next available price, which can be worse than the open; this can also happen during the session when prices move fast. A stop-limit order caps the price, but it may not fill at all, as FINRA explains in its overview of order types. Typical triggers for gaps are earnings, central bank decisions and weekend news; our guide to gap trading explains how gaps behave.
- Know the dates: do not hold a stock through its earnings report unless you mean to.
- Reduce before the weekend: if you hold over the weekend, you can cut the position first.
- Spread the risk: do not hold three positions in the same sector.
- Consider near-continuous markets: currencies and major index futures trade almost around the clock. Gaps there are often smaller, but they still happen.
If you want no positions overnight at all, day trading suits you better. I usually plan swing trades with a target of 2:1 to 3:1. That is a planning value, not a typical result. Where the chart offers them, I check that target against the old high and the targets of a Fibonacci extension.
US rules for swing traders: PDT, margin and taxes
This section applies to US accounts; rules elsewhere differ. With Regulatory Notice 26-10, FINRA replaced the old day-trading margin requirements, including the day-trade count and the $25,000 minimum for pattern day traders, with new intraday margin standards. They took effect on June 4, 2026, and brokers may phase them in until October 20, 2027.
Under the former rule, a simple position opened one day and closed the next was not a day trade. A planned swing trade that is stopped out on the entry day can still count as one at a broker that still applies the old rule. Which framework applies depends on your broker’s adoption.
Margin still has a floor. According to FINRA’s guide to frequent intraday trading, you need at least $2,000 in equity to trade with borrowed money; that floor is not enough capital for every position, and initial, maintenance and broker house requirements come on top. In a cash account you pay for securities in full; buying with unsettled funds and selling early can lead to violations and account restrictions. US stock trades settle one business day after the trade (T+1).
Taxes depend on holding time. For taxable US stock and ETF positions, gains on assets held one year or less are generally short-term capital gains, according to IRS Topic 409. Futures, retirement accounts and readers outside the US follow different rules, so check with a tax professional. This is not tax advice.
Before real money: practice first
My advice after many years with students: start in a demo account. The account must later be large enough that 1 % risk gives a tradable position size; the guide to position sizing has a table by account size. Switch to real money only after you have traded the same strategy cleanly over at least 30 trades. That exercise tests your execution and discipline, not whether the strategy is profitable, and no number of trades guarantees success. Our guide to TradingView paper trading shows one way to practice.
Indicators for swing trading: what they show
Indicators summarize what is already on the chart; they do not replace analysis. A moving average is a common starting point for swing trading, because it shows direction and a pullback target in one tool. On the daily chart, 20 and 50 sessions are common, and many traders use the 200-day line for the larger trend. When the 50-day line crosses above it, traders call it a golden cross.
Two optional additions are enough to start. The RSI measures the strength of a move; in a strong trend it can stay above 70 for a long time, so it is a poor sell signal there. Bollinger Bands show recent volatility: contracting bands indicate quiet trading, but they do not predict the direction or guarantee a larger move. My own charts show only price and key levels.
How to plan a swing trade with a day job
A routine keeps the time advantage of the style. With a small watchlist this takes me 15 to 20 minutes on most days once it is set; for you it can take longer.
- Prepare once a week: go through your watchlist and mark markets that are trending or forming a tight range.
- Check after the close: where has a daily close met the conditions? Set aside charts with no signal.
- Check at the next open: confirm that the setup is still valid and within your maximum price before the order goes in.
- Write everything down: entry, stop, size and reason. An honest journal shows you your own error patterns.
Conclusion: swing trading fits people with limited screen time
I have been in the markets since 1980, and in my own experience many people gave up because their trading style did not fit their day. Swing trading can solve that: you work on the daily chart, decide after the close and, with a small watchlist, often need 10 to 30 minutes for the signal check. Take two things with you: position size matters more than the entry, and overnight risk belongs to the style. Pick one of the four strategies, trade it 30 times in a demo account and leave the others alone until then.
Frequently asked questions about swing trading
Is swing trading profitable?
Swing trading can be profitable, but nothing about the style guarantees it. Results depend on your rules, your risk control, costs and the market phase. The two SPY examples above show one win and one loss with the same setup. Test a strategy on many trades and judge it after costs before you rely on it.
How long do you hold a swing trade?
Usually from two days to several weeks. The holding time follows the move, not the calendar: as long as the trend structure is intact and the target has not been reached, the position stays open. Some trades end the next day because the stop is hit.
Is swing trading better than day trading?
It is not easier, but it fits better with a job. You need less screen time and decide without time pressure. In return you carry overnight risk and have to sit through longer periods without a setup, while day trading avoids overnight gaps.
How much money do I need to start swing trading?
There is no legal minimum for a cash account. It makes sense once 1 % risk gives a tradable position size and fees do not eat the expected gain. To trade on margin in the US, FINRA requires at least $2,000 in equity, and your broker may ask for more.
Does the pattern day trader rule apply to swing trading?
Under the former rule, a position opened one day and closed the next was not a day trade. FINRA has replaced the pattern day trader rule with new intraday margin standards, effective June 4, 2026, with a phase-in until October 20, 2027. Until your broker switches, a swing trade that is stopped out on the entry day can still count as a day trade there.
What is the best indicator for swing trading?
There is no best indicator. Many swing traders start with the 20-day moving average on the daily chart, because it shows trend direction and a pullback target in one tool. RSI and Bollinger Bands can add information, but they do not replace a plan.
What is the biggest downside of swing trading?
The biggest downside is overnight and weekend risk. News outside market hours can open the market past your stop, and the loss is then larger than planned. The second is patience: valid setups can be rare for weeks.
This article was written by Karsten Kagels, a discretionary price action trader. The German edition was reviewed by Christian Möhrer; the SPY examples are new to this English version. They are hypothetical, built from Yahoo Finance daily bars with key prices checked against Interactive Brokers, selected afterwards to explain the method, and are not trades I executed or a statistic. This is educational content, not investment advice.
This US edition is based on our German edition on kagels-trading.de and has been adapted for US readers.
More Chart Techniques guides
- Draw key levels
Support and Resistance: How to Draw and Use Key Levels
Where useful levels come from, how to draw zones with a stated rule and how to turn a level into a trade plan.
- Read price action
Price Action Trading: How to Read Charts Without Indicators
Market structure, key zones and three bar patterns, with a core setup and a real SPY example where the signal failed.
- Read candlestick charts
How to Read Candlestick Charts: Body, Wicks and Context
Open, high, low and close in one candle, body and wicks, two real Gold candles read step by step and how often patterns really occur.
- Know candlestick patterns
Candlestick Patterns: 10 to Know, Tested on Real Data
Ten patterns with rules and a cheat sheet, counted on DAX, S&P 500, EUR/USD and Gold since 2014: most are rare, none is a signal on its own.
- Trade breakouts
Breakout Trading Strategy: Entries and False Breakouts
How often breakouts fell back into the range in our count of 1,472, and how to plan entry, stop and position size.
- Draw and trade trendlines
Trendline Trading: How to Draw Trendlines and Trade Them
How to draw trendlines with a fixed rule, four strategies for bounces, breaks and retests, and a real SPY line break without a lasting reversal.
- Use Fibonacci levels
Fibonacci Retracement Levels: How to Draw and Trade Them
How to calculate and draw retracement levels, trade pullbacks with confluence and a stop at the structure, and what a ten-year test says about the levels.
- Set Fibonacci targets
Fibonacci Extension: Levels, How to Draw It and Calculator
Three-point extension targets from the end of a pullback, why they differ from levels beyond 100%, a free calculator and three SPY swings, one without a single target reached.
- Trade gaps
Gap Trading Strategy: How to Trade Gaps and When Gaps Fill
Opening and full gaps, the four classic gap types, how often SPY gaps filled in our count since 2001, and plans for gap fill and gap and go.
- Calculate pivot points
Pivot Points: Formulas, Types and How to Trade Them
Formulas for standard, Fibonacci, Woodie, Camarilla and DeMark pivots, a free calculator, which session counts and a real SPY day.
- Identify market stages
Stage Analysis: Stan Weinstein's Four Market Stages
Stan Weinstein's four stages on the weekly chart, a Stage 2 checklist and two TSMC breakouts: one ran for a year, one gapped through its stop.
- Read Wyckoff ranges
Wyckoff Method: Accumulation, Distribution and Springs
Accumulation and distribution with phases A to E, springs and upthrusts as optional tests, and two real TSMC ranges read with and without hindsight.
- Trade Darvas boxes
Darvas Box Strategy: Rules, Entries and Stop Losses
The box rules step by step, when the edges become known, where the stop goes, and a mechanical test on TSMC in 2024 with two honest results.
- Count Elliott waves
Elliott Wave Theory: Rules, Patterns and Fibonacci
The five-wave pattern, three hard rules, zigzags, flats and triangles, Fibonacci ratios and a real DAX count, from the first German translator of the standard work.
- Trade order blocks
Order Blocks: How to Spot, Draw and Trade the Zone
The three conditions behind a valid order block, entry and stop at the zone, two SPY cases from 2026 and a 25-year count where a fixed rule lost money.
- Trade fair value gaps
Fair Value Gap (FVG): How to Spot, Trade and Test It
The three-candle rule, bullish, bearish and inverse FVG, two SPY cases from 2026 and a 25-year count of how often gaps were revisited and traded.
- Read liquidity sweeps
Liquidity Sweep: How to Spot It and Trade the Reversal
Sweep or run, buy-side and sell-side liquidity, internal and external targets, SPY reversal, continuation and failed-reversal examples and a 25-year count of a fixed sweep rule.
- Interpret volume
Volume Analysis in Trading: How to Read Volume Honestly
What volume counts in stocks, futures, forex and crypto, how to read it against its own average, and our SPY test of high-volume days since 2001.