
Morning Star Candlestick: Rules, Real Cases, Limits


Contents
- Morning star in 30 seconds
- What is a morning star?
- The three candles in detail
- Does a morning star need a gap?
- How often the pattern appeared in our data
- A morning star that worked: EUR/USD in June 2024
- A morning star that failed: Gold in August 2023
- Evening star: the bearish mirror image
- Morning star, bullish engulfing and hammer compared
- How traders use the morning star
- Common mistakes with star patterns
- Conclusion: what the morning star really tells you
- Frequently asked questions about the morning star
- About the author
A morning star looks like the perfect bottom: a big red candle, a pause, then a strong green candle. Textbooks call it a reliable reversal pattern. I wanted to know how often it really appears when you write the rules down so that a computer can count it. So we applied fixed rules to almost 13 years of daily candles in the DAX, the S&P 500, EUR/USD and Gold.
The short answer: under clear rules the pattern is rare. We found between 4 and 9 morning stars per market from January 2014 to September 2026. That is too few to say whether the pattern beats an ordinary day. On this page you get the rules we used, every case on one chart, two real examples picked by a fixed rule (one worked, one failed) and the practical lessons from them.
Morning star in 30 seconds
- Three candles after a decline. A large red candle, a small star candle and a green candle that closes above the middle of the first.
- The evening star is the mirror image. It appears after a rise and points to falling prices.
- Rare under clear rules. 4 to 9 morning stars and 2 to 8 evening stars per market in almost 13 years of daily data.
- Too few cases for a verdict. Below 30 cases we report only the count, no hit rate and no average.
- Real cases go both ways. The most recent morning star in EUR/USD reached its hypothetical target, the most recent one in Gold hit its stop one day after the entry.
- Location first, pattern second. I give a morning star at a support level more weight than the same candles in the middle of a range; our count did not test this filter.
What is a morning star?
A morning star is a three-candle pattern at the end of a decline: a large red candle, a small candle and a green candle that closes above the middle of the first candle.
The name comes from the Japanese candlestick tradition, which Steve Nison made known to Western traders in the early 1990s. The morning star is the planet Venus, which shines before sunrise. The picture carries the whole idea: the pattern is meant to announce the end of the dark phase. If you are new to candles, start with our guide on how to read candlestick charts.
The process behind the pattern is simple. The first candle shows sellers in control. The second shows that the selling pressure dries up. The third shows buyers taking back ground. So the pattern describes a change of control over three sessions, not a single event.
One word of caution about the name: Morningstar in one word is a company. Morningstar is an American investment research firm that rates funds with stars. It has nothing to do with candlestick charts. The chart pattern is written as two words, morning star.
The three candles in detail
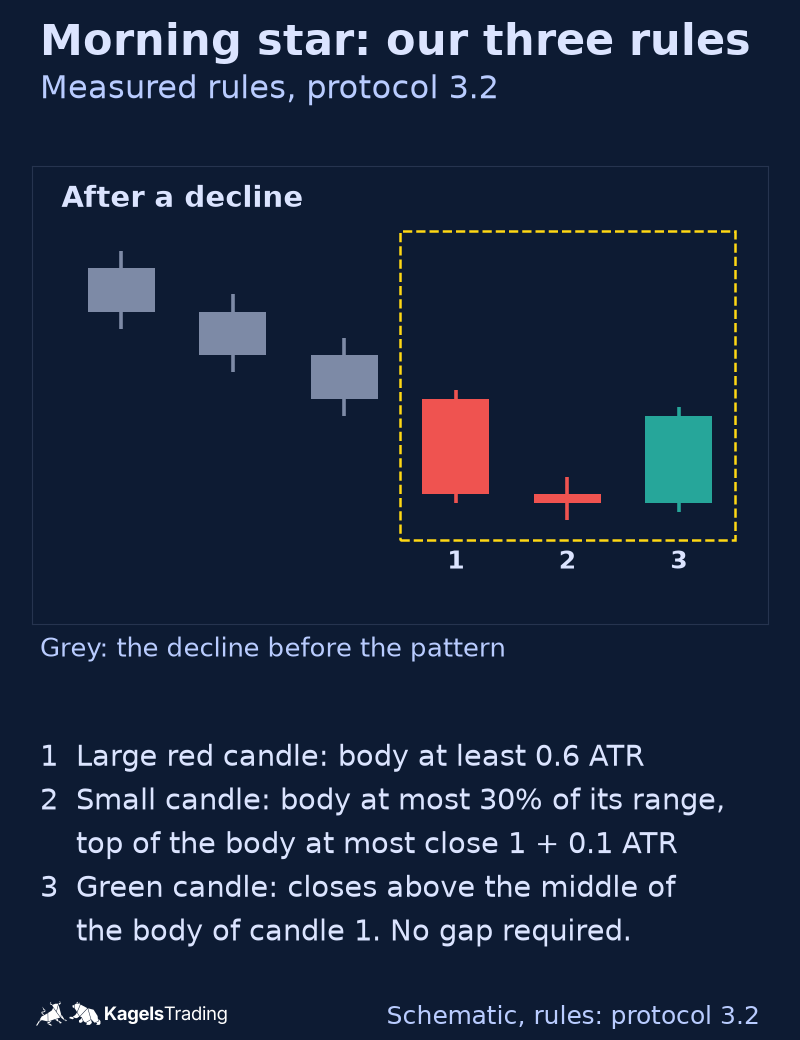
A pattern you cannot write down as a rule cannot be counted. Vague descriptions such as “a small candle” lead to different results on every chart. That is why we fixed measurable rules for the pattern before the evaluation. One data rule changed later: the minimum coverage of a Gold session was set after the case counts were known, so the Gold figures are descriptive only. All rules use the average true range (ATR) over 14 sessions after Wilder, the smoothed average of the true range; our guide on the ATR indicator explains it. The rules and the hypothetical stop use the ATR and the market state of the session just before candle 1; results after the pattern are measured in the ATR of the third candle.
 Click to enlarge
Source: Kagels Trading, own drawing.
| Candle | Role | Our rule |
|---|---|---|
| Session before candle 1 | Decline | Close below the close of ten sessions earlier and below the 20-day average |
| Candle 1 | Sellers in control | Red, body at least 0.6 ATR (ATR of the session before candle 1) |
| Candle 2 | Pressure dries up | Body at most 30% of its own range, top of the body no higher than the close of candle 1 plus 0.1 ATR, colour does not matter |
| Candle 3 | Buyers take back ground | Green, closes above the middle of the body of candle 1 |
The second candle is the heart of the pattern. It is called the star because in the classic drawing it stands apart from the first body, below it, separated by a gap. Its colour does not matter. If its body is almost zero, the pattern is called a morning doji star; our rule includes that variant but does not count it separately.
The decline before the pattern matters as much as the three candles. Without a falling market there is nothing to reverse, and the same three candles in a sideways phase describe no exhaustion. Our rule checks the market state before the first candle.
Does a morning star need a gap?
In the ideal drawing the bodies are separated, but our rule requires no gap. Idealized drawings show the star’s body apart from the first candle, with a gap, and often the third candle opening above the star. Not every classic definition requires both gaps, and Steve Nison describes looser forms as well. We do not require any gap, and we mark the pattern “no gap” in every chart.
The reason is the markets we measured. EUR/USD and Gold trade almost around the clock, so the next day usually opens where the last one closed and gaps hardly occur. A rule that demands gaps would leave very little to count in these markets, and the gap versions of the star patterns are not part of our measurement.
How often the pattern appeared in our data
We applied these rules to daily candles of four markets from January 2014 to September 2026. The DAX and the S&P 500 come from Yahoo Finance, EUR/USD and Gold from Dukascopy, with the day ending at 5 pm New York. That is between 3,205 and 3,318 sessions per market. Only evaluable cases count: days with a data gap nearby and signals without ten complete following sessions drop out.
 Click to enlarge
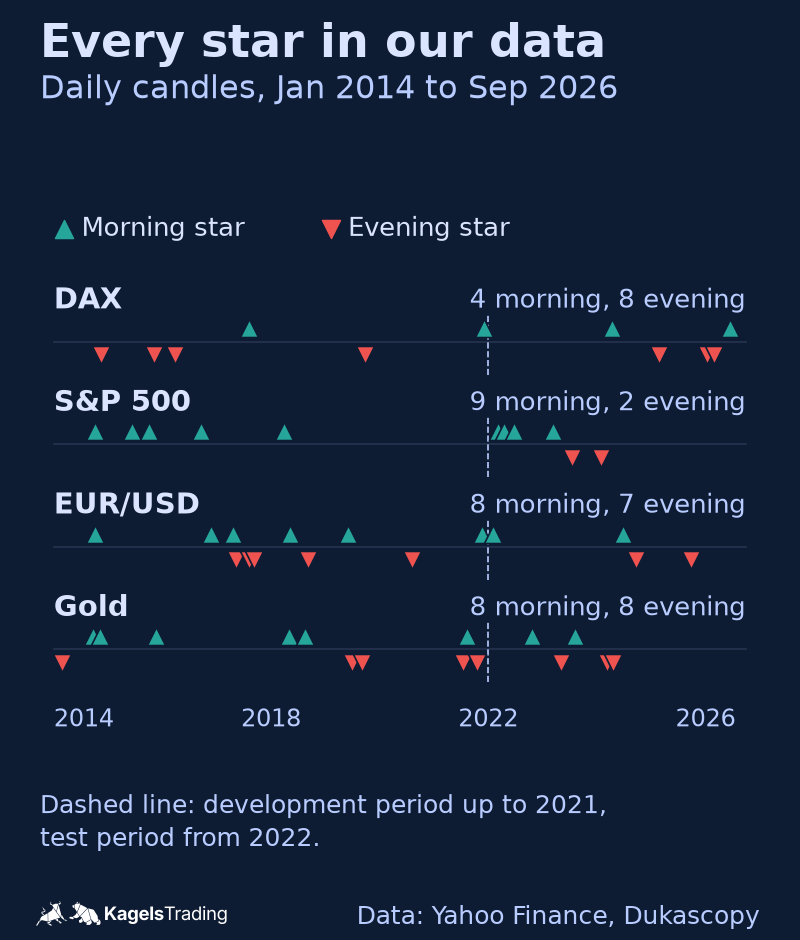
Source: Kagels Trading measurement, data Yahoo Finance and Dukascopy.
| Market | Morning stars | Evening stars |
|---|---|---|
| DAX | 4 (2 + 2) | 8 (5 + 3) |
| S&P 500 | 9 (5 + 4) | 2 (0 + 2) |
| EUR/USD | 8 (6 + 2) | 7 (5 + 2) |
| Gold | 8 (6 + 2) | 8 (5 + 3) |
Cases per market, January 2014 to September 2026. In brackets: 2014 to 2021 plus 2022 to 2026.
Per market, that is 4 to 9 morning stars and 2 to 8 evening stars in more than 3,200 sessions. We developed the rules on 2014 to 2021 and kept 2022 to 2026 as a test period. For a comparison with similar days we require at least 30 comparable cases per market and period; the star patterns miss that mark everywhere. So this page shows no hit rate and no average for them. We also report each market on its own and do not add them up, because each market behaves differently.
Many articles quote impressive hit rates for the morning star. Treat such numbers with care unless you know the exact rules, the markets, the period and what the result was compared with. Looser rules find many more cases. And in a market that rose over the years, many ordinary days also end higher, so a bullish signal needs a comparison with such days before it means anything.
If you want to check the cases yourself, here are the dates of the third candle. DAX: August 4, 2017, December 1, 2021, April 15, 2024, June 12, 2026. S&P 500: October 3, 2014, June 10, 2015, September 30, 2015, September 15, 2016, March 29, 2018, March 9, 2022, April 19, 2022, June 21, 2022, March 14, 2023. EUR/USD: October 2, 2014, November 25, 2016, April 17, 2017, May 10, 2018, May 31, 2019, November 18, 2021, January 31, 2022, June 24, 2024. Gold: September 23, 2014, November 7, 2014, November 19, 2015, May 3, 2018, August 17, 2018, August 11, 2021, October 21, 2022, August 4, 2023. All counts per pattern, market and period are in our results CSV, the full method in the method appendix (PDF).
The count describes four markets on daily candles, nothing more. It covers no other time frames and no other markets, it ignores costs, and it does not test a trading approach. Index levels cannot be traded directly, EUR/USD and Gold are bid prices, and in Gold the opening price depends on the data source. Across roughly 25 patterns and four markets, a few striking single values are expected by chance alone.
A morning star that worked: EUR/USD in June 2024
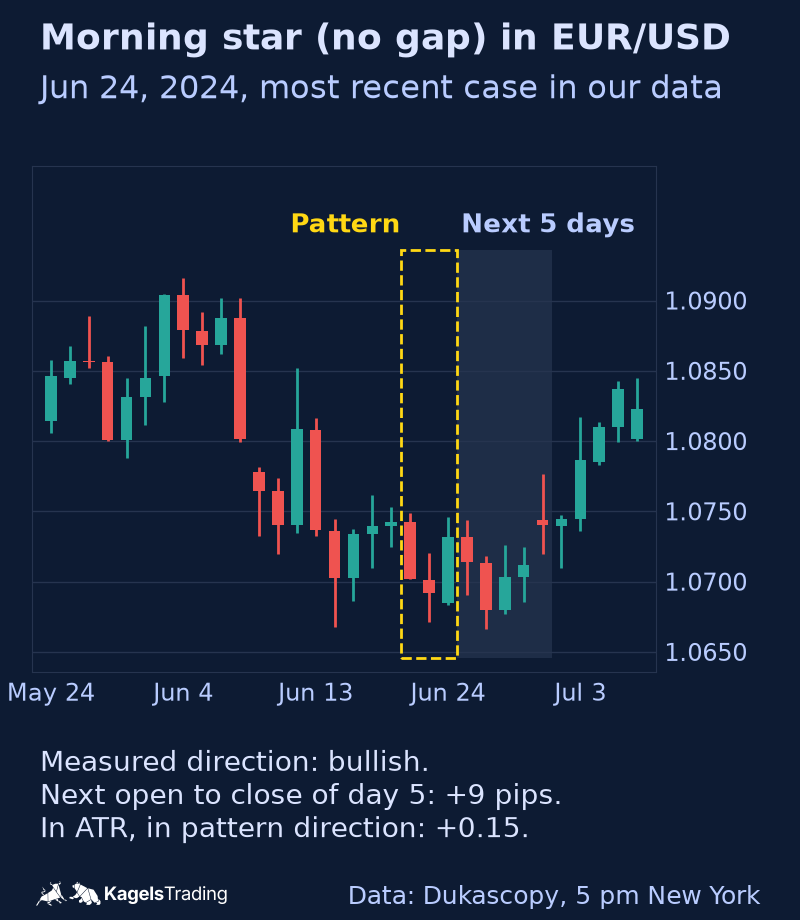
The most recent morning star in EUR/USD in our data ended on June 24, 2024. We did not pick it because of its result; it is simply the latest case. The pattern started with a red candle on June 20 from 1.0742 to 1.0702, followed by a small star on June 21 and a green candle on June 24 that closed at 1.0732, above the middle of the first body.
 Click to enlarge
The trade went against the entry at first. Two sessions later, on June 26, EUR/USD fell to 1.0666, five pips below the pattern low of 1.0671. A hypothetical stop 0.1 ATR (of the session before the pattern) below that low, at about 1.0665, survived by about one pip. At the close of the fifth session after the pattern the pair stood 9 pips above the entry, and on July 3 it reached the hypothetical 1:1 target near 1.0798.
The lesson is about the stop, not about the pattern. A stop directly under the third candle or exactly at the low would have been taken out before the move began. The pattern low marks a zone, and price can test it again. A stop a little below the whole pattern costs more risk per trade, which you balance with a smaller position size.
A morning star that failed: Gold in August 2023
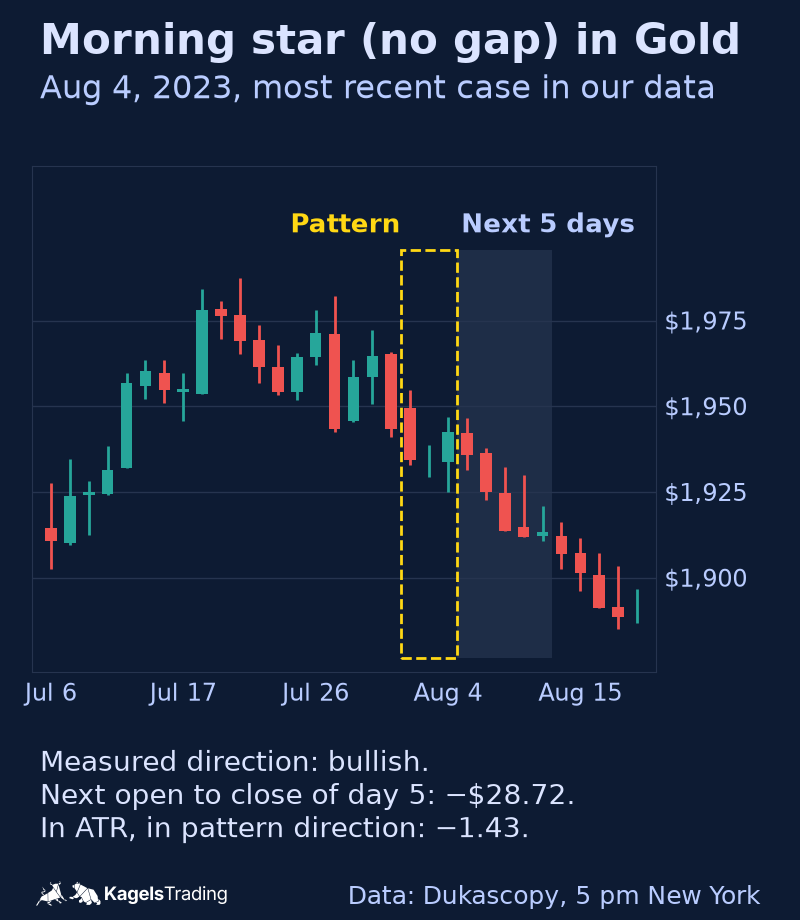
The most recent morning star in Gold in our data ended on August 4, 2023, and it failed quickly. The first candle fell from $1,949.61 to $1,934.29, the star barely moved, and the third candle closed at $1,942.57, just above the middle of the first body. By our rule, a clean pattern.
 Click to enlarge
The day after the entry, Gold traded below the pattern. The entry at the next open was $1,942.10 on August 7. On August 8 the low reached $1,922.66, below the hypothetical stop near $1,922.83. At the close of the fifth session after the pattern Gold stood $28.72 below the entry, and at the close of the tenth, on August 18, it stood at $1,889.26.
This is what a failed reversal looks like. The decline simply continued. Three candles describe the balance of buyers and sellers over three days; they say nothing about the news, the interest rate outlook or the bigger trend in the weeks ahead. That is why the market context comes before the pattern in my work.
Evening star: the bearish mirror image
An evening star is the same pattern at the end of a rise: a large green candle, a small candle and a red candle that closes below the middle of the first. The evening star announces the dark, the morning star the light. Our rule mirrors the morning star exactly, including the market state before the pattern, and it also needs no gap.
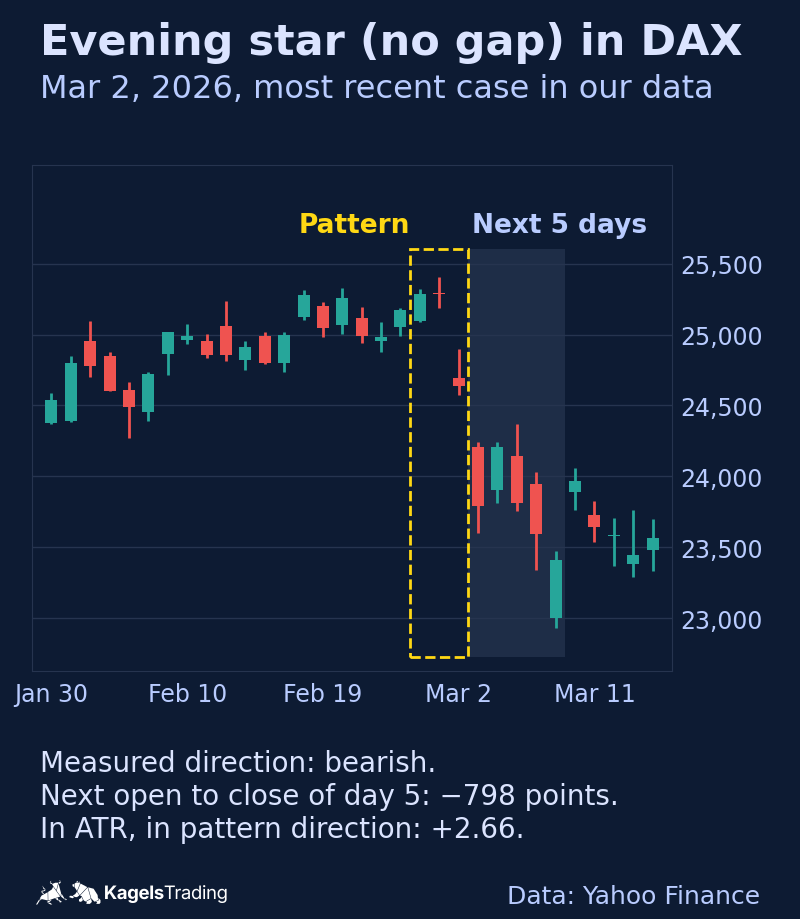
The most recent DAX evening star in our data ended on March 2, 2026. The middle candle on February 27 was a doji: it opened at 25,294 and closed at 25,284 points. On March 2 the DAX opened lower at 24,695 and closed at 24,638. From the next open to the close of the fifth session it then fell 2.66 ATR. Like the two morning stars above, this is one case, chosen by date, not by result.
 Click to enlarge
Evening stars were as rare as morning stars. We found 2 to 8 per market. In the S&P 500 there were only two, both in the test period. Again, the case count is too small for any average.
Morning star, bullish engulfing and hammer compared
Several reversal patterns appear at the end of a decline, and they are easy to mix up. The difference lies in the number of candles and in the process they show.
| Pattern | Candles | What it shows |
|---|---|---|
| Morning star | 3 | Selling pressure fades over two days, then buyers take back ground |
| Bullish engulfing | 2 | A green body covers the whole red body before it |
| Hammer | 1 | Low prices are rejected within one day, long lower wick |
| Piercing line | 2 | A green candle closes above the middle of the red one before it |
The morning star needs three sessions, the hammer one and the engulfing two. So the morning star is complete only after the third close, while a hammer is complete after one day. Whether the longer pattern leads to better results or a different entry price was not part of our measurement. You find all of these patterns with schematics in our overview of candlestick patterns.
In practice these patterns often overlap. If the third candle of a morning star also engulfs the body of the star, two readings point the same way. Our measurement allows such overlaps and counts each pattern on its own.
How traders use the morning star
Our count does not test any trading approach, so the following is practice, not a measured result. It describes how I and many other price action traders handle the pattern. Costs, spreads and slippage are not part of our measurement.
- Look for the level first. I take a morning star at an existing support, at the previous day’s low or at a round number more seriously than the same candles in the middle of a range. Our guide on support and resistance shows how to draw such levels.
- Place the stop below the whole pattern. The low of all three candles is the reference, with a little room below it. The EUR/USD case shows why: the low was tested again, and only a stop with room survived.
- Size the position to the stop. A wider stop means more risk per unit, so the position gets smaller. Decide the amount you can lose before you enter.
- Decide on the confirmation in advance. Many traders wait for a fourth candle to close higher. That gives one more price observation and moves the entry a day later; whether it improves results was not tested here. Write down which way you use and keep to it.
Common mistakes with star patterns
- Looking for the pattern without a decline. A morning star in a sideways phase is just a sequence of candles. Without a fall before it there is no exhaustion to describe.
- Waiting for the perfect gap. In markets that trade around the clock the textbook gap hardly occurs. Waiting for it means waiting for a pattern that rarely comes.
- Setting the stop too tight. A stop directly under the third candle can be hit when price tests the low again, as in the EUR/USD case.
- Carrying daily results over to short time frames. Our count covers daily candles only. How often the pattern appears on a five-minute chart and what it means there remains open.
- Ignoring the news. The Gold case of August 2023 shows a clean pattern followed by a further decline. A pattern does not know what happens next week.
- Reading a hit rate without context. A hit rate means little without the exact rules and a comparison with ordinary days in the same market.
Conclusion: what the morning star really tells you
The morning star describes a real process, but under clear rules it is a rare event. It shows selling pressure fading and buyers taking back ground over three sessions. In almost 13 years of daily data in four markets we found only 4 to 9 cases per market, too few to measure an edge against ordinary days.
My practical view after four decades at the chart: the pattern is a hint, not an order. It tells me where to look more closely. Whether I trade depends on the level where it forms, the market context and a stop that leaves room below the whole pattern. If you read it as a buy signal on its own, the Gold case of August 2023 shows what can happen.
This article is educational market analysis, not investment advice. Trading involves risk, and past cases say nothing certain about future prices.
Frequently asked questions about the morning star
What is a morning star in trading?
A morning star is a three-candle reversal pattern at the end of a decline. A large red candle is followed by a small star candle and then by a green candle that closes above the middle of the first. It hints at a possible turn from falling to rising prices.
How reliable is the morning star?
Under clear rules there are too few cases for a reliable answer. We found 4 to 9 morning stars per market in the DAX, S&P 500, EUR/USD and Gold from 2014 to September 2026. Below 30 cases we do not compute a hit rate or an average. The single cases go both ways, as the EUR/USD and Gold examples on this page show.
What is the difference between a morning star and an evening star?
The two patterns are mirror images. The morning star forms after a decline and points to rising prices, the evening star forms after a rise and points to falling prices. Both consist of a large candle, a small candle and a large candle in the other direction.
Is Morningstar the same as the morning star pattern?
No, they are two different things. Morningstar, written as one word, is an American investment research firm that rates funds with stars. The chart pattern is written as two words and comes from the Japanese candlestick tradition.
Does a morning star need a gap?
Ideal drawings separate the bodies with gaps, but our count does not require them. In EUR/USD and Gold, which trade almost around the clock, gaps between daily candles hardly occur. We mark our cases “no gap”; the gap version of the pattern is not part of our measurement.
Which time frame is best for the morning star?
Our count covers the daily chart only. Each candle there stands for a whole trading day, and that is where I would start to learn the pattern. How often it appears on other time frames and what it means there was not measured.
This English edition is based on our German edition on kagels-trading.de and has been adapted for international readers.
More Chart Techniques guides
- Draw key levels
Support and Resistance: How to Draw and Use Key Levels
Where useful levels come from, how to draw zones with a stated rule and how to turn a level into a trade plan.
- Read price action
Price Action Trading: How to Read Charts Without Indicators
Market structure, key zones and three bar patterns, with a core setup and a real SPY example where the signal failed.
- Read candlestick charts
How to Read Candlestick Charts: Body, Wicks and Context
Open, high, low and close in one candle, body and wicks, two real Gold candles read step by step and how often patterns really occur.
- Know candlestick patterns
Candlestick Patterns: 10 to Know, Tested on Real Data
Ten patterns with rules and a cheat sheet, counted on DAX, S&P 500, EUR/USD and Gold since 2014: most are rare, none is a signal on its own.
- Trade the hammer candle
Hammer Candlestick: Spot It, Trade It, Know Its Limits
Three features, the difference to inverted hammer and hanging man, entry and stop, and how rarely the hammer appeared in four markets since 2014.
- Spot a topping tail
Topping Tail Candlestick: Rules, Silver Example and Limits
Six measurable rules for the bearish rejection candle, a silver candle from January 2026 checked step by step, the difference from the shooting star and how to trade it with a stop.
- Combine timeframes
Multi-Timeframe Analysis: A Weekly and Daily Workflow
How to combine the weekly chart for context and the daily chart for entry under one stated rule, with a documented SPY case from June 2025.
- Trade pullbacks
Pullback Trading: Entries, Stops and Failed Setups
Pullback or reversal, limit against confirmation entry, and one fixed rule set on three real QQQ cases: a target, a stop and a cancelled setup.
- Trade sideways ranges
Range Trading: Boundaries, Orders and Two Documented Fades
A 14-session rule to draw horizontal boundaries, three order-type variants and two Alpaca-verified SPY fades, one that reached the target and one that was stopped out.
- Read a consolidation
Consolidation in Trading: What the Range Tells You
What a consolidation is, why 25 years of index data showed no stable direction edge from narrow ranges or the prior trend, and two DAX breakouts from 2026.
- Read chart formations
Chart Patterns: Reversals, Continuations and Failures
Reversal, continuation and bilateral formations with the measured-move convention per pattern and two documented SPY rectangle cases.
- Trade rising and falling wedges
Rising and Falling Wedge Patterns: How to Trade Them
How to spot both wedges, where to set entry, stop and target, and why Bulkowski ranks the rising wedge with a downward breakout last of 36 patterns.
- Trade breakouts
Breakout Trading Strategy: Entries and False Breakouts
How often breakouts fell back into the range in our count of 1,472, and how to plan entry, stop and position size.
- Draw and trade trendlines
Trendline Trading: How to Draw Trendlines and Trade Them
How to draw trendlines with a fixed rule, four strategies for bounces, breaks and retests, and a real SPY line break without a lasting reversal.
- Draw a pitchfork channel
Andrews Pitchfork: How to Draw It, Trade It and Test It
Three pivots, a median line and two parallels, Schiff variants, a trade plan and how often price reached the median line in 746 cases.
- Use Fibonacci levels
Fibonacci Retracement Levels: How to Draw and Trade Them
How to calculate and draw retracement levels, trade pullbacks with confluence and a stop at the structure, and what a ten-year test says about the levels.
- Set Fibonacci targets
Fibonacci Extension: Levels, How to Draw It and Calculator
Three-point extension targets from the end of a pullback, why they differ from levels beyond 100%, a free calculator and three SPY swings, one without a single target reached.
- Trade gaps
Gap Trading Strategy: How to Trade Gaps and When Gaps Fill
Opening and full gaps, the four classic gap types, how often SPY gaps filled in our count since 2001, and plans for gap fill and gap and go.
- Calculate pivot points
Pivot Points: Formulas, Types and How to Trade Them
Formulas for standard, Fibonacci, Woodie, Camarilla and DeMark pivots, a free calculator, which session counts and a real SPY day.
- Swing trade
Swing Trading: 4 Strategies, Risk and Real Examples
Four swing trading strategies on the daily chart, position size, gap risk and US rules, with two hypothetical SPY pullbacks: one hit its target, one was stopped out.
- Identify market stages
Stage Analysis: Stan Weinstein's Four Market Stages
Stan Weinstein's four stages on the weekly chart, a Stage 2 checklist and two TSMC breakouts: one ran for a year, one gapped through its stop.
- Read Kagi charts
Kagi Charts: Reversal Amount, Shoulders and Signals
One line, one reversal amount, thick yang and thin yin: tested on DAX hourly data and compared with Renko and point and figure.
- Screen for growth leaders
CAN SLIM: William O’Neil’s Seven Rules for Growth Stocks
William O'Neil's seven CAN SLIM criteria with thresholds, his selling rules, a free screen with real counts and what the tests really show.
- Read Wyckoff ranges
Wyckoff Method: Accumulation, Distribution and Springs
Accumulation and distribution with phases A to E, springs and upthrusts as optional tests, and two real TSMC ranges read with and without hindsight.
- Trade Darvas boxes
Darvas Box Strategy: Rules, Entries and Stop Losses
The box rules step by step, when the edges become known, where the stop goes, and a mechanical test on TSMC in 2024 with two honest results.
- Count Elliott waves
Elliott Wave Theory: Rules, Patterns and Fibonacci
The five-wave pattern, three hard rules, zigzags, flats and triangles, Fibonacci ratios and a real DAX count, from the first German translator of the standard work.
- Understand Smart Money Concepts
Smart Money Concepts (SMC): What They Are and What Holds Up
The seven SMC building blocks, BOS vs CHoCH vs MSS, one labeled SPY sequence that held, one that failed, and what a chart can and cannot show.
- Understand ICT trading
ICT Trading: Silver Bullet, Killzones and What Holds Up
Michael Huddleston's Inner Circle Trader method: Silver Bullet, Judas Swing, the 2022 model and killzones in New York time, with one SPY setup that worked and one that failed.
- Trade order blocks
Order Blocks: How to Spot, Draw and Trade the Zone
The three conditions behind a valid order block, entry and stop at the zone, two SPY cases from 2026 and a 25-year count where a fixed rule lost money.
- Trade fair value gaps
Fair Value Gap (FVG): How to Spot, Trade and Test It
The three-candle rule, bullish, bearish and inverse FVG, two SPY cases from 2026 and a 25-year count of how often gaps were revisited and traded.
- Trade inverse fair value gaps
Inverse Fair Value Gap (IFVG): Rules, Examples and a Test
When a broken gap counts as inverted, three entry styles, one SPY retest that held, one that failed, and a 25-year test with trend and sweep filters.
- Trade failed breakouts with Turtle Soup
Turtle Soup Trading: Raschke Rules, ICT Version and a Test
Linda Raschke's original rules, Turtle Soup Plus One and the ICT version side by side, two SPY examples and a 25-year test on SPY and QQQ.
- Read a break of structure
Break of Structure (BOS): Rules, CHoCH vs MSS and a Test
Which swing counts, BOS vs CHoCH vs MSS under one stated convention, two SPY breaks that won and lost, and a 25-year test against ordinary days.
- Read a change of character
Change of Character (CHoCH): Rules, BOS vs MSS and Data
The first close against the trend, close versus wick, CHoCH vs BOS vs MSS, two SPY cases and what the trend did next after 287 CHoCHs on SPY and QQQ.
- Read a market structure shift
Market Structure Shift (MSS): Rules, BOS vs CHoCH and Data
MSS as a CHoCH with a sweep and a fair value gap, the comparison with BOS and CHoCH, two 2021 cases and what 14 daily MSS on SPY and QQQ did next.
- Draw supply and demand zones
Supply and Demand Trading: Zones, Rules and Real Data
Base and departure rules, the four base patterns, how zones differ from order blocks and SMC, two SPY cases and a fixed test of 86 zone trades on SPY and QQQ.
- Read liquidity sweeps
Liquidity Sweep: How to Spot It and Trade the Reversal
Sweep or run, buy-side and sell-side liquidity, internal and external targets, SPY reversal, continuation and failed-reversal examples and a 25-year count of a fixed sweep rule.
- Spot bull and bear traps
Bull Trap vs Bear Trap: How to Spot a Trapped Market
What bull traps and bear traps are, the two signs of trapped traders, how to trade the reversal with a defined stop, and two real SPY examples from 2025.
- Interpret volume
Volume Analysis in Trading: How to Read Volume Honestly
What volume counts in stocks, futures, forex and crypto, how to read it against its own average, and our SPY test of high-volume days since 2001.