
Fair Value Gap (FVG): How to Spot, Trade and Test It


Contents
- Fair value gaps in 30 seconds
- What is a fair value gap?
- How to identify a fair value gap
- Which fair value gaps are worth trading
- Fair value gap vs. price gap
- Do fair value gaps get filled?
- A simple FVG trading strategy, step by step
- Two real SPY examples: one held, one failed
- What a fixed FVG rule did on 25 years of SPY
- Inverse fair value gap (IFVG)
- Fair value gap indicators
- Fair value gap vs. order block
- Pros and cons of fair value gaps
- What a fair value gap cannot do
- Conclusion: is it worth trading fair value gaps?
- Frequently asked questions about fair value gaps
- About the author
Price shoots through an area in three candles, and afterward there is a band on the chart that the first and the third candle do not cover. That band is a fair value gap. The term sounds like modern Smart Money Concepts, but it describes something old: a fast move that leaves a visible hole between the neighboring candles.
Most explanations show you what a fair value gap looks like and stop where it gets interesting. The real question is which gaps are worth your attention. This guide gives you the exact three-candle rule, clear selection criteria, the inverse FVG, two real SPY examples and a count over 25 years. So you can judge the concept by data, not by the stories around it.
Fair value gaps in 30 seconds
- Definition: a fair value gap is the price range between the first and third candle of a three-candle sequence whose ranges do not overlap, usually after a fast move.
- Rule: bullish when the low of candle 3 is above the high of candle 1, bearish in the mirror case.
- Selection: not every gap is worth trading. Common filters are trend direction, the session and a known support or resistance zone. They are conventions, not tested rules.
- Revisits: in our SPY count price came back into most gaps, but moves of the same size were just as common on other days. High revisit rates alone are no edge.
- Limit: an FVG is a building block, not a strategy. Without a fixed entry and stop it stays an observation.
What is a fair value gap?
A fair value gap (FVG) is the price range between the first and the third candle of a three-candle sequence whose ranges do not overlap, usually created by a fast move in the middle candle.
On the chart this is a fact you can check, not an opinion. Two price levels, the high of candle 1 and the low of candle 3, mark the edges. Between them lies only the range of the middle candle, and not even that when the market jumped at the open. How much actually traded inside the band, a bar chart does not show; for that you need volume by price.
What the Smart Money Concepts add is an interpretation. In their reading, the gap marks unfinished business: one side was so dominant that the other side got too few fills, and price will tend to come back to “rebalance” the area. That is a hypothesis about why price returns. Whether it does return more often than chance is something you can test, and we do that below with SPY.
The name is tied to the Inner Circle Trader. The term is associated with Michael Huddleston, who teaches as the Inner Circle Trader (ICT) and spread it through his free YouTube lessons. The observation behind the label is much older. That price often returns into an area it overshot has been part of classic price action for decades. What is new is the systematic definition, not the phenomenon.
What the chart shows and what it does not
A chart shows the sequence of prices, not who traded them. You can see that one candle ran far and that the next candle did not come back. You cannot see whether a fund, a market maker or thousands of small traders were on the other side.
Even the most detailed exchange data keeps the sender hidden. The Market by Order feed of the CME futures exchange shows every single order, but according to the CME it contains no customer identifiable information and no firm IDs. So when you read that an FVG shows where “smart money” bought, treat it as a story that fits the chart, not as something the chart proves.
How to identify a fair value gap
You identify a fair value gap by a fixed three-candle rule. What matters is not how large the middle candle looks, but how the outer two candles relate to each other. They set the edges. The middle candle is usually a large candle in the direction of the gap, but the rule does not require it: in our SPY count, 259 of 2,142 gaps had a middle candle that closed against the gap direction or unchanged.
A bullish fair value gap forms when the low of candle 3 is above the high of candle 1.
A bearish fair value gap forms when the high of candle 3 is below the low of candle 1.
The space between these two levels is the gap itself. This is why you can draw an FVG without guessing: top and bottom are two concrete prices. If you only look for a big candle instead, you end up marking random zones.
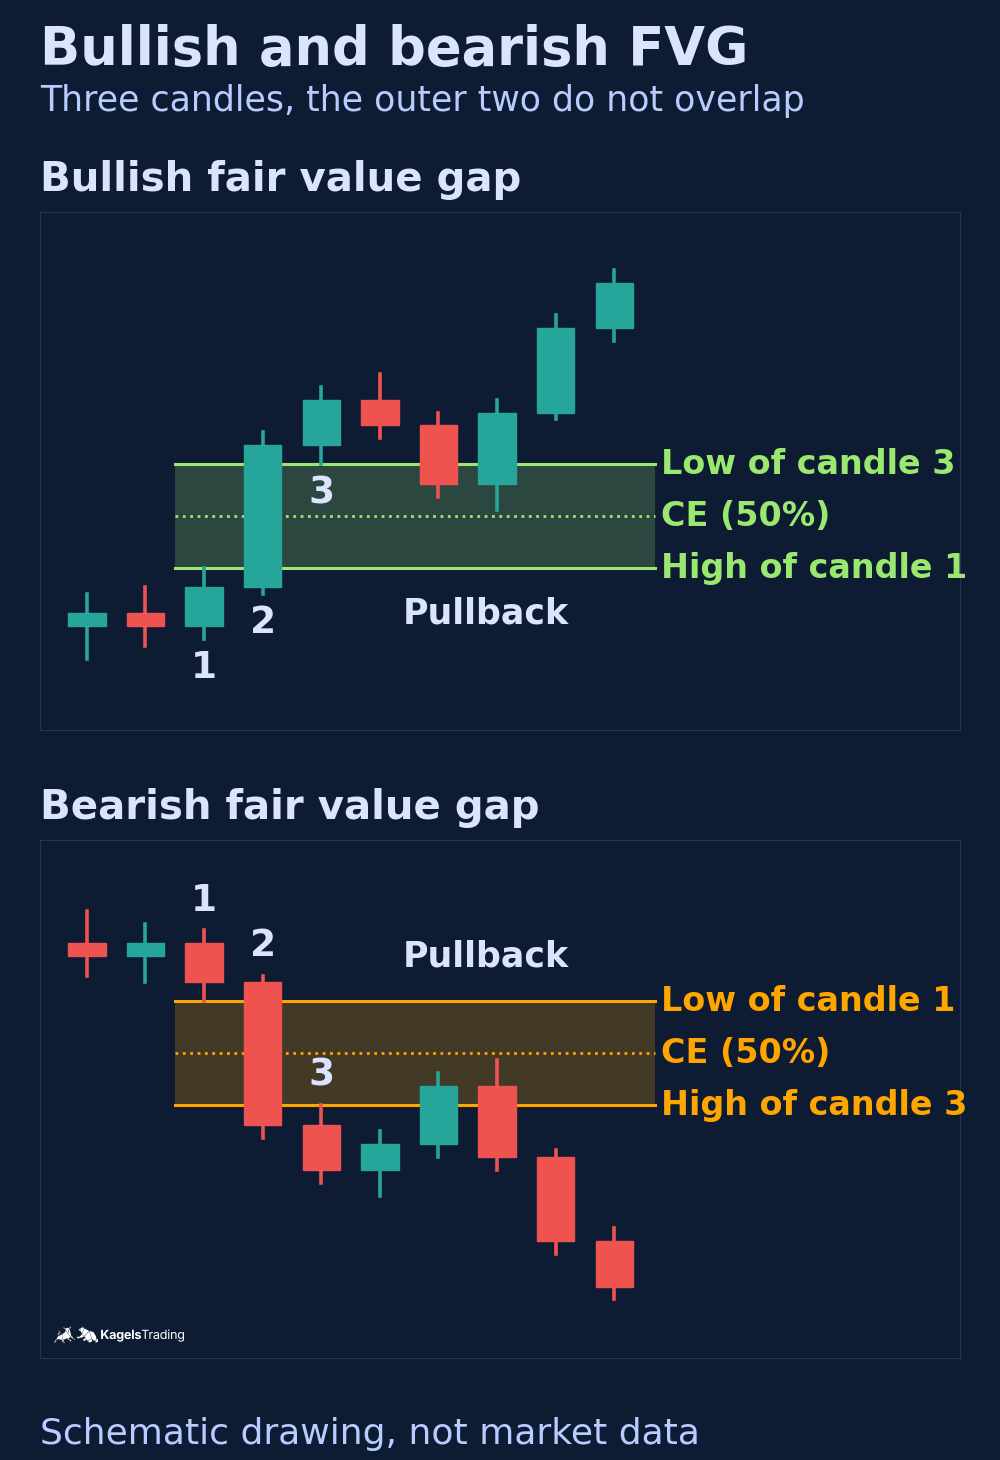 Click to enlarge
Source: Kagels Trading, own drawing.
The impulsive middle candle is often called displacement. The word only describes what you see: a candle with a large body that moves far in one direction. It does not tell you who placed the orders, and a large candle with no gap afterward is still no FVG. Many traders require displacement as an extra condition; the basic rule does not.
Displacement is the impulsive candle that opens the fair value gap.
If you want to spot gaps reliably, you need to read single candles first. Bodies, wicks and closes tell you how the session went. The wicks of candle 1 and candle 3 decide whether there is a gap at all, so draw from wick to wick, not from body to body.
Bullish fair value gap
A bullish fair value gap comes from a fast rise. Price rose so far that the low of candle 3 stayed above the high of candle 1 and the two ranges no longer overlap. For you, the gap is a possible area for a long position when price comes back, as long as the higher trend points up.
Bearish fair value gap
A bearish fair value gap comes from a fast drop and is the mirror case. It can serve as an area for a short position on a later rally. The deciding point stays the same: the ranges of the two outer candles must not touch, otherwise there is no gap.
Consequent encroachment: the 50% line
Consequent encroachment (CE) is the ICT name for the middle of a fair value gap. You calculate it as the average of the top and bottom edge. Many traders use it as a finer entry level or as a test: as long as price does not close beyond the 50% line, they treat the gap as intact.
The CE is a convention, not a law. It gives you a predefined reference instead of a gut decision in a running trade. In our SPY count, price reached the 50% line in most gaps that it entered at all, so on its own the line does not separate good from bad setups.
Which fair value gaps are worth trading
The advice “not every gap works” is useless until somebody tells you how to pick. These five filters are the ones most FVG traders use. They are common conventions and hypotheses to test, not proven rules. Our count used only the trend filter, as part of one fixed rule, and did not test the others.
- Direction of the higher trend: trade gaps in the direction of the trend on the higher timeframe. A bullish gap in a falling daily chart sits against the larger direction.
- Formed in the main session: for US stocks, regular trading hours run from 9:30 a.m. to 4:00 p.m. Eastern Time. Many traders give less weight to gaps from thin pre-market or overnight trading.
- Overlap with a known zone: if the gap sits on an established support or resistance level, two reasons to watch the area meet.
- Prior break of structure: a gap right after price broke the last swing high or low often marks where the new move started.
- Fresh, untouched zone: SMC traders treat the first return as the important one. A gap that price has already entered several times counts as used up by convention.
The session filter rests on a documented trading risk, not on a tested edge. FINRA’s model extended hours risk disclosure lists lower liquidity, higher volatility and wider spreads outside regular hours. It also warns that news in thin trading can have an “exaggerated and unsustainable” effect on price. That gaps from the regular session work better for trading is our editorial view; neither the FINRA text nor our count shows it.
The size of a gap is no quality mark. Very large gaps often form around news, and a large gap needs a large move before it is filled. A tiny gap, on the other hand, is mostly noise. In our count we set a minimum height of a quarter of the 14-day average true range (ATR), so that stop and target were not just a few cents apart.
The timeframe matters as well. On a one-minute chart you find dozens of gaps per day, and most of them are noise. Many traders consider gaps on the hourly chart and higher more reliable, which is an assumption, not a measured result. Often a breakout or a quick run beyond an old high or low comes right before a strong gap. SMC calls that run a liquidity sweep; the chart shows the run, not whose stops were filled.
Fair value gap vs. price gap
Both terms contain the word gap, but they mean two different things. If you mix them up, you look for something in the forex chart that hardly ever appears there.
A classic price gap forms between one session’s close and the next open. A fair value gap forms from the relation of three candles and needs no break in trading.
The classic price gap is a real jump in the price series. Trading pauses, news arrives overnight, and the next morning the market opens visibly above or below the prior close. For stocks and index ETFs this is normal, because the exchange has fixed hours; see our overview of stock exchange hours. How to trade these jumps is covered in our guide to gap trading.
A fair value gap can form in the middle of continuous trading. It appears when one candle runs so far that its neighbors no longer cover its range. That is why you find FVGs in forex, which trades around the clock on weekdays and knows classic gaps mostly at the weekly open.
On daily stock charts the two often overlap, and that matters for your reading. In our SPY count, in 1,541 of 2,142 daily fair value gaps since 2001, about 72%, the jump from one close to the next open ran through part of the gap zone. On a daily SPY chart, a large part of many FVGs is therefore a jump between two regular sessions. If you want gaps that formed inside the session, look at an intraday chart or check the opens.
Do fair value gaps get filled?
The common claim is that fair value gaps act like magnets. We tested that on all SPY daily bars from January 2, 2001, to October 16, 2026, with prices from Yahoo Finance. The count found 2,142 gaps, 1,305 bullish and 837 bearish, about 83 per year.
For each gap we checked the next 20 trading days. Did price trade back to the near edge, and did it fill the gap completely? As a reference we pooled all other days in the sample. For each gap we measured the distance from the close of candle 3 to the edge in units of the 14-day ATR, and checked how often a move of at least that size in the same direction followed on those days. The reference matches direction, time window and distance, but not trend or market phase.
| Within 20 trading days | Bullish gaps (1,300) | Bearish gaps (832) |
|---|---|---|
| Price came back to the near edge | 80.8% | 89.1% |
| Same move on days without a gap | 83.6% | 88.2% |
| Gap completely filled | 68.8% | 80.4% |
| Same move on days without a gap | 72.7% | 79.1% |
Revisits were common, and so were moves of the same size on other days. After bullish gaps, price came back down to the near edge in 80.8% of the cases; in the reference, a move of the same size down followed in 83.6%. After bearish gaps the rates were 89.1% and 88.2%. So the rates were slightly below the reference after bullish gaps and slightly above it after bearish gaps, by a few percentage points at most.
This comparison does not prove a pull, and it does not rule one out. It does not isolate a gap effect, because trend and market phase are not matched and we did not test whether such small differences are reliable. What it does show: high revisit rates alone are no proof of a magnet, because moves of that size were common anyway. Gaps from the last 20 days and the first 14 days of the data are left out of the table.
So the answer to “do fair value gaps always get filled” is no. Many are: over 60 days, 79.5% of the bullish and 91.7% of the bearish gaps were filled completely in our sample. In the reference, moves of the same size followed in 82.5% and 90.3%. A market that moves around a lot reaches most nearby prices sooner or later. That is a base rate, not proof of a magnet.
A simple FVG trading strategy, step by step
A fair value gap is a building block, not a finished strategy. Only together with rules for trend, entry and exit does it become something you can trade. The following sequence is kept simple on purpose, and you can add other ICT concepts later.
- Define the trend: read the sequence of highs and lows on the higher timeframe. Higher highs and higher lows mean uptrend, the mirror image means downtrend. This direction decides which gaps qualify.
- Mark the structure: draw the last relevant swing highs and lows. A break of the last high confirms an uptrend, a break of the last low in an uptrend warns of a turn.
- Mark gaps in trend direction only: if one of them sits on a known support or resistance, it is the best candidate.
- Wait for the pullback: do not trade the impulse, trade the return into the zone. Either with a limit order at the edge of the gap or after a visible reaction. For a start the limit order is easier, because it needs no interpretation.
- Set the risk: the stop belongs behind the zone, not inside it. Then size the position from the stop distance, as shown in our guide to position sizing.
- Set the target: a first target at the previous swing high for longs, at the swing low for shorts. Then trail the stop instead of hoping for a bigger move.
The sequence describes the mechanics, not an edge. Whether it works in your market only shows after a test over enough cases. And it has a clear limit: in a sideways market without visible structure, step 1 gives no result, so all other steps fall away. That is no flaw of the pattern, it is the signal that there is no setup right now.
Two real SPY examples: one held, one failed
Both examples follow exactly the same rule, and both come from 2026. In short: a bullish gap in an uptrend (SPY above its 200-day average), a limit buy at the top edge on the first pullback, a stop one cent below the bottom edge and a target at twice the risk (2R). The full rule is in the next section.
In July 2026 the gap held. On June 26 SPY traded down to 716.58 and closed at 728.99, with a high of 736.53. On June 30 the low was 740.89. That left a bullish gap from 736.53 to 740.89. It formed in regular trading: the June 29 bar opened exactly at 736.53, not above it. On July 2 price came back to 740.03 and filled the buy at 740.89, with the stop at 736.52. On July 6 SPY reached the target at 749.63.
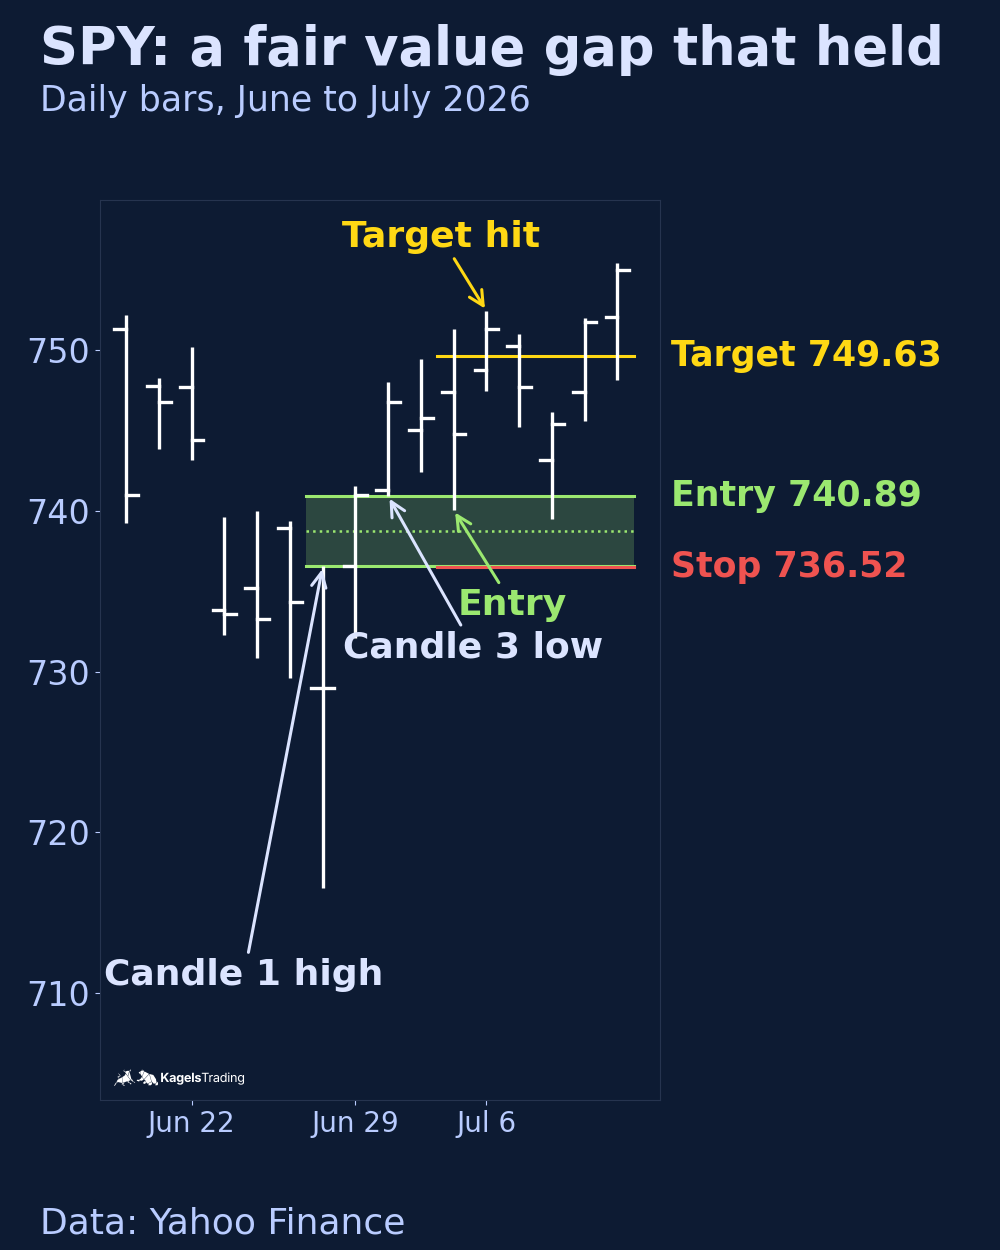 Click to enlarge
In February 2026 the same rule failed. On February 5 the high was 683.69, on February 9 the low was 688.34, a bullish gap of 4.65 points that also formed without an opening jump. On February 12 SPY fell through the whole gap in one day: the buy at 688.34 filled, the stop at 683.68 was hit, and the close at 681.27 was below the gap.
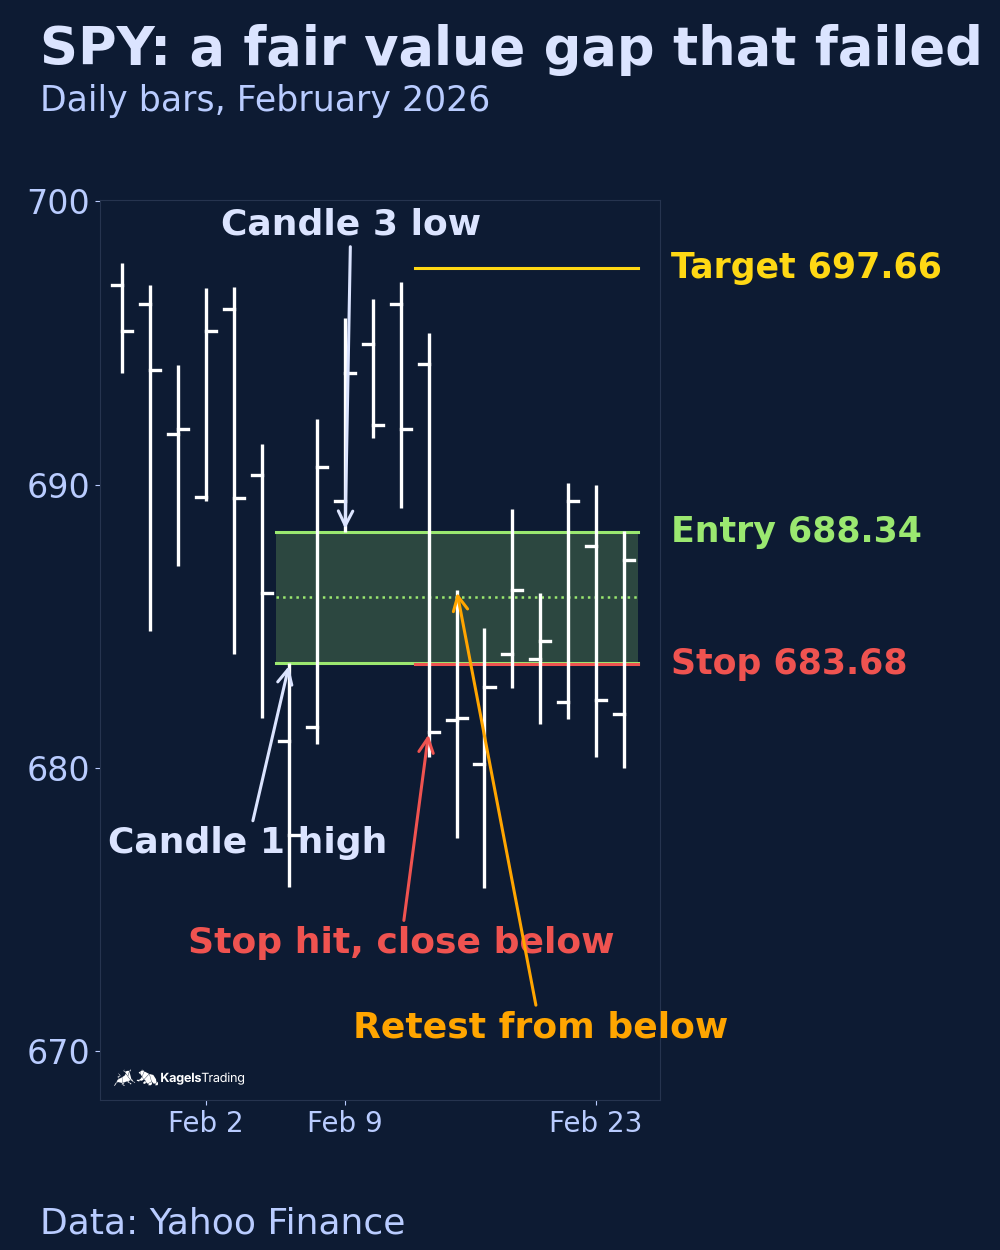 Click to enlarge
The failed gap then turned into the next setup, and that one failed too. Under the inverse FVG reading, the broken zone becomes resistance. On February 13 SPY traded back up to 686.28, into the gap from below. A short at 683.69 with a stop at 688.35 would have been stopped out on February 18, when SPY reached 689.15. Both cases met every condition of the rule at the moment of entry. Only afterward did one gap hold and the other not.
What a fixed FVG rule did on 25 years of SPY
I wanted to know what such a rule does when nobody picks the nice charts. So we applied one fixed rule to all SPY daily bars from 2001 to October 16, 2026, long and short. The rules were set before we looked at any result. Prices are split-adjusted but not dividend-adjusted. There are no commissions and no slippage beyond opening gaps, and the full trade list is available as a CSV file.
- Gap: a bullish gap as defined above, or a bearish one. Its height must be at least a quarter of the average true range (ATR), here the simple average of the last 14 true ranges.
- Trend: bullish gaps only if SPY closed above its 200-day average on candle 3, bearish gaps only if it closed below.
- Entry: a limit order at the near edge on the first bar that trades into the gap, at most 20 bars after candle 3. If that bar opens inside the gap, the fill is at the open. If it opens beyond the far edge, there is no trade.
- Exit: stop one cent beyond the far edge, target at 2R. Without either, the trade closes after 40 bars. If a bar opens beyond the stop or the target, the exit is at that open. If both are touched in the same bar, we count the stop. On a bar that fills intraday, a touched target does not count.
- One at a time: while a trade in one direction is waiting or open, new gaps in that direction are ignored.
| Result | Long | Short | Total |
|---|---|---|---|
| Setups found | 296 | 103 | 399 |
| No pullback in 20 bars | 65 | 14 | 79 |
| Opened past the gap | 5 | 7 | 12 |
| Trades | 226 | 82 | 308 |
| Target | 79 (35.0%) | 24 (29.3%) | 103 (33.4%) |
| Stop hit | 146 | 58 | 204 |
| Closed after 40 bars | 1 | 0 | 1 |
| Total result | +2.4R | −9.4R | −7.0R |
| Per trade | +0.01R | −0.11R | −0.02R |
This rule came out close to zero in this SPY sample. A target at 2R needs a hit rate of about one in three to break even, and that is almost exactly what the long side reached. The short side did worse, which fits a market that rose over most of these years. 28 stops were filled worse than planned because SPY opened beyond them, the worst at −3.9R in May 2021.
What this test does not say. It covers one market, one timeframe and one way of defining the gap, the trend and the exit. A sample of a few hundred trades leaves a wide margin around any hit rate. FVGs on futures intraday charts, with a structure filter or another exit, can behave differently. If you trade them, write your rules down and test them first, for example with our guide to backtesting. Testing many variants on the same data invites curve fitting.
Inverse fair value gap (IFVG)
Not every gap holds. When price breaks through a zone instead of turning there, the zone does not just disappear from many charts. It changes its role, and that is what the inverse fair value gap describes.
An inverse fair value gap (IFVG) is a fair value gap that price has closed through and that traders then read with the opposite role.
In practice that means: a bullish gap that price closed below is now read as resistance. A bearish gap that price closed above is read as support. It is the same principle you know from broken support lines, the classic role reversal, applied to gap zones.
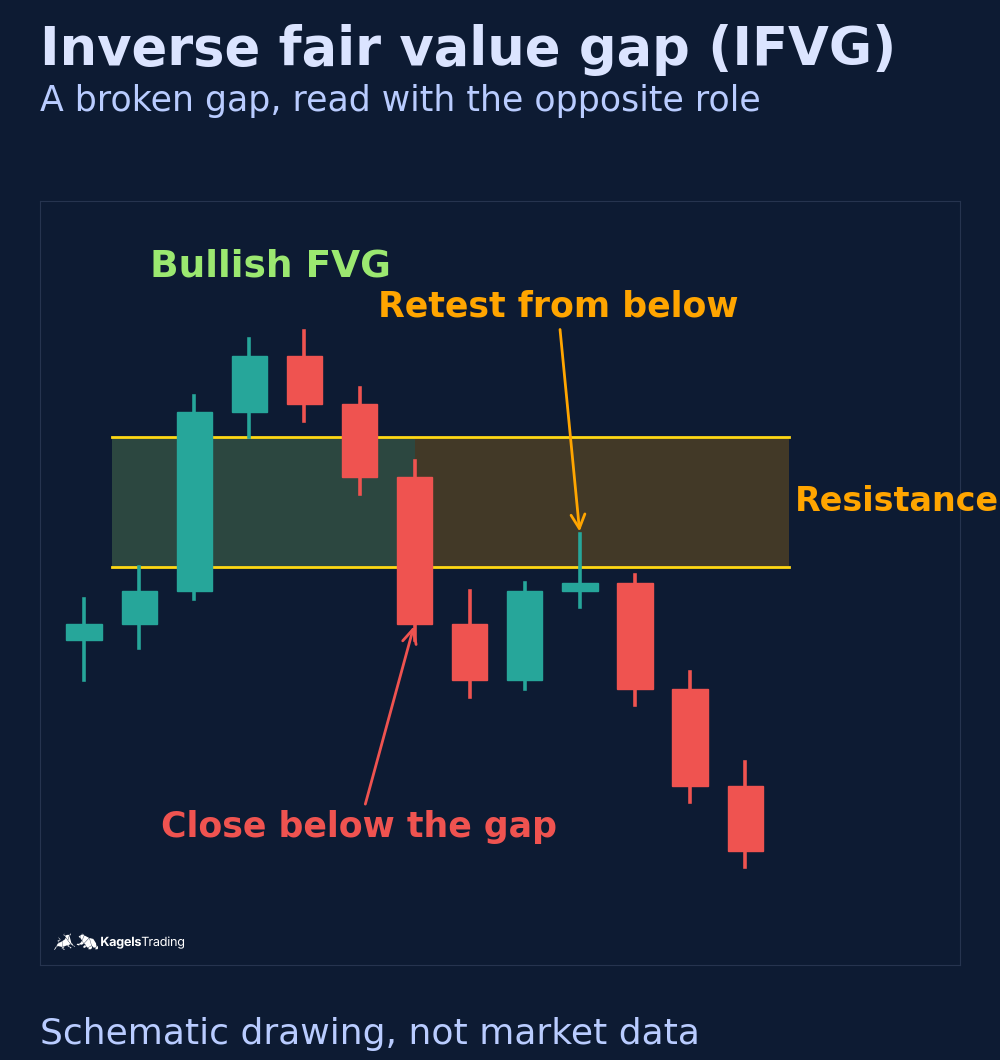 Click to enlarge
Source: Kagels Trading, own drawing.
For you this is first of all a warning against buying the same spot again. When a bullish gap breaks, the original idea was wrong, and adding to the position at the same place makes the mistake bigger. The other reading says that the first return to the inverted gap offers a setup in the new direction.
We tested that reading with a fixed rule as well. The rule uses the same SPY daily bars and the same execution conventions as the FVG rule above. Setups are handled in the order of their inversion day, so no later event decides which trade is taken.
- Gap: a bullish or bearish gap with the same minimum height of a quarter of the ATR. No trend filter.
- Inversion: within 20 bars after candle 3, a close beyond the far edge. For a bullish gap that is a close below its bottom.
- Entry: in the new direction, a limit order at the broken edge on the first bar after the inversion day that trades back to it, at most 20 bars later. For a broken bullish gap that is a sell at the gap bottom. If that bar opens beyond the edge, the fill is at the open.
- Exit: stop one cent beyond the other edge, target at 2R, close after 40 bars. Opening gaps and same-bar conflicts are handled as above.
- One at a time: while an order or trade in one direction is open, new inversions in that direction are ignored.
The inverse rule did worse than the plain one. Of 449 trades, 131 reached the target, about 29%. The total was −46.8R, on average −0.10R per trade. Shorts at broken bullish gaps lost most, with −35.4R over 250 trades in a market that mostly rose; longs at broken bearish gaps lost 11.5R over 199 trades.
On SPY daily bars, this IFVG rule lost more per trade than the plain FVG rule. That does not make the idea worthless on every chart. But it shows that a broken gap is no signal by itself. If you want to use inverse FVGs, add the trend of the higher timeframe and test your exact version before you risk money.
Fair value gap indicators
You can draw a fair value gap by hand in a few seconds. You only need the first and the third candle. Indicators do this for you and mark every zone automatically. That saves time, but it has a price that few people mention.
An indicator does not know your selection criteria. It draws every three-candle pattern that fits the definition, including gaps from thin sessions and gaps against the higher trend. On small timeframes the chart quickly fills with colored boxes. The work moves from drawing to sorting out.
TradingView’s public library offers many free FVG scripts. You find them under fair value gap scripts, from simple markers to versions with filters for minimum size, timeframe and mitigation. The useful ones let you set the minimum height and the timeframe yourself. Paid packages often combine FVGs with order blocks and structure breaks in one chart.
For learning, drawing by hand is still the better way. If you mark gaps by hand for a few weeks, you see at a glance which zone has context and which does not. No indicator gives you that judgment. With the bar replay you can practice bar by bar without seeing the future. If you want to see where volume actually traded inside a fast move, a footprint chart shows that directly; see our guide to order flow trading.
Fair value gap vs. order block
Both concepts come from the same toolbox and often sit right next to each other. The order block is the last opposite candle before the impulse. The fair value gap is the band inside the impulse that the candles did not cover.
In practice the order block is the wider zone and the FVG the narrower one. Some traders use the gap as confirmation that the move away from an order block was strong, others trade the gap alone. Our guide to order blocks explains the three conditions behind a valid zone and shows a 25-year SPY count for that concept as well. Neither concept tells you who traded at the zone.
Pros and cons of fair value gaps
Whether the effort pays off depends on how strictly you apply your selection rules. Know these strengths and weaknesses before you put real money on it.
Pros of trading fair value gaps:
- Clearly defined zones: top and bottom come from two concrete prices. Entry and stop can be set objectively.
- A planned place to wait: the gap gives you a predefined area for a pullback entry instead of a gut feeling.
- Wide use: the pattern needs only price data and can be applied the same way in forex, futures, stocks and crypto.
- No tools needed: you only need the first and the third candle. No indicator, no paid software.
Cons of trading fair value gaps:
- No fill guarantee: whether and when a zone is reached is open. Some gaps stay untouched for months.
- Revisits are not an edge by themselves: in our SPY count, moves of the same size were about as common on other days as the moves back into a gap.
- Many signals, little quality: small timeframes produce so many gaps that selection becomes the real problem.
- Conflicting signals: a bullish gap on the hourly chart can meet a bearish one on the daily chart. Without a fixed timeframe hierarchy you draw the wrong conclusions.
What a fair value gap cannot do
I do not trade with the ICT vocabulary myself. My method comes from classic price action in the tradition of Joe Ross, and there things have other names. But fast moves that leave such holes in the chart are something I have read since 1980, long before the term existed.
From that distance the assessment is sober. A fair value gap is a context tool. It tells you where to look, not what to do. It delivers no hit rate, no price target and no confirmation, and in our SPY count neither the plain rule nor the inverse rule produced an edge.
One part of the concept can be tested, the other cannot. The chart pattern can be defined and counted, as we did above. The claim that large traders left unfilled orders in a particular gap cannot be checked on a price chart. You only see that price came back or did not. If you turn that into certainty, you confuse a plausible story with evidence.
Be careful with the environment, too. A large scene of coaches and channels has grown around ICT and the Smart Money Concepts, and not all of them earn their money from trading. The SEC warns in its investor alert on social media and investment fraud that information found on social media may be inaccurate, incomplete or misleading, and that some influencers are paid to promote an investment. Test every concept on your own charts before you pay for it.
This guide is education, not investment advice. Trading with leverage, futures or options can lose more money than you expect, and past examples do not predict future results. Decide your risk per trade before you enter, and keep it in line with your risk management.
Conclusion: is it worth trading fair value gaps?
A fair value gap is a place to look, not a signal. It shows you where price moved through quickly, and it says nothing about whether and when price will come back. This distinction decides whether the pattern helps or hurts you.
It helps as a filter for entry zones. If you already have a direction, gaps give you concrete areas to wait for a pullback, with a clear top and bottom and therefore a definable stop. That is more than most chart patterns offer.
It hurts as a supposed entry signal. Small timeframes produce so many gaps that you can find one for every direction. If you trade without trend context and without selection rules, you do not have a setup, you have a reason for a decision you wanted to make anyway.
After decades at the chart, one observation remains. The market often returns into areas it moved through quickly, but it owes nobody that return. Our SPY count fits that: many revisits, but moves of the same size were about as common on other days. Treat the concept as a tendency to watch, not as a mechanism, and it becomes a useful tool.
Frequently asked questions about fair value gaps
What is a fair value gap (FVG)?
A fair value gap is the band between two candles whose ranges do not overlap. You recognize it by a three-candle pattern in which the ranges of the first and the third candle do not overlap. The band between them is the gap.
How do I identify a fair value gap on the chart?
Compare the first and the third candle of a three-candle sequence. If the low of candle 3 is above the high of candle 1, you have a bullish gap. If the high of candle 3 is below the low of candle 1, it is bearish. The range in between is the gap.
Do fair value gaps always get filled?
No, many gaps are filled, but not all. In our SPY count since 2001, about 69% of the bullish gaps were completely filled within 20 trading days. On all other days, a move of the same size followed in about 73%, so a high fill rate alone does not prove a pull. News or a strong trend can leave a zone untouched for months.
Which fair value gaps are worth trading?
Most traders pick gaps in the direction of the higher trend that formed in the main session. These are conventions, not tested rules. Extra weight often goes to gaps that sit on a known support or resistance zone or follow a break of structure. A gap that price has entered several times counts as used up by convention.
What is the difference between an FVG and a price gap?
A price gap forms in the pause between close and open and is a visible jump. A fair value gap forms from the relation of three candles and can appear in continuous trading, so you also find it in forex. On daily SPY charts, most FVGs also include a jump from one close to the next open.
What is an inverse fair value gap (IFVG)?
An inverse fair value gap is a gap that price closed through and that is then read with the opposite role. A broken bullish gap is treated as resistance, a broken bearish gap as support. In our SPY count a fixed IFVG rule lost money over 449 trades.
What is consequent encroachment?
Consequent encroachment (CE) is the ICT term for the 50% line of a fair value gap. Traders use it as a finer entry or as a test: a close beyond the middle counts as a sign that the gap is weakening. It is a convention, not a measured level.
Is FVG trading a good strategy?
On its own, our fixed FVG rule on SPY daily bars came out close to zero. Over 308 trades, 33.4% reached the 2R target, a total of −7.0R. That covers one market, one timeframe and one rule, so it is no verdict on every approach. Test your own rules before you risk money.
In which markets do fair value gaps appear?
In every market with candle charts: stocks, forex, futures, commodities and crypto. Because the pattern only uses price data, it is tied neither to an instrument nor to a timeframe.
This English edition is based on our German edition on kagels-trading.de and has been adapted for international readers.
More Chart Techniques guides
- Draw key levels
Support and Resistance: How to Draw and Use Key Levels
Where useful levels come from, how to draw zones with a stated rule and how to turn a level into a trade plan.
- Read price action
Price Action Trading: How to Read Charts Without Indicators
Market structure, key zones and three bar patterns, with a core setup and a real SPY example where the signal failed.
- Trade breakouts
Breakout Trading Strategy: Entries and False Breakouts
How often breakouts fell back into the range in our count of 1,472, and how to plan entry, stop and position size.
- Draw and trade trendlines
Trendline Trading: How to Draw Trendlines and Trade Them
How to draw trendlines with a fixed rule, four strategies for bounces, breaks and retests, and a real SPY line break without a lasting reversal.
- Use Fibonacci levels
Fibonacci Retracement Levels: How to Draw and Trade Them
How to calculate and draw retracement levels, trade pullbacks with confluence and a stop at the structure, and what a ten-year test says about the levels.
- Set Fibonacci targets
Fibonacci Extension: Levels, How to Draw It and Calculator
Three-point extension targets from the end of a pullback, why they differ from levels beyond 100%, a free calculator and three SPY swings, one without a single target reached.
- Trade gaps
Gap Trading Strategy: How to Trade Gaps and When Gaps Fill
Opening and full gaps, the four classic gap types, how often SPY gaps filled in our count since 2001, and plans for gap fill and gap and go.
- Calculate pivot points
Pivot Points: Formulas, Types and How to Trade Them
Formulas for standard, Fibonacci, Woodie, Camarilla and DeMark pivots, a free calculator, which session counts and a real SPY day.
- Swing trade
Swing Trading: 4 Strategies, Risk and Real Examples
Four swing trading strategies on the daily chart, position size, gap risk and US rules, with two hypothetical SPY pullbacks: one hit its target, one was stopped out.
- Identify market stages
Stage Analysis: Stan Weinstein's Four Market Stages
Stan Weinstein's four stages on the weekly chart, a Stage 2 checklist and two TSMC breakouts: one ran for a year, one gapped through its stop.
- Read Wyckoff ranges
Wyckoff Method: Accumulation, Distribution and Springs
Accumulation and distribution with phases A to E, springs and upthrusts as optional tests, and two real TSMC ranges read with and without hindsight.
- Trade Darvas boxes
Darvas Box Strategy: Rules, Entries and Stop Losses
The box rules step by step, when the edges become known, where the stop goes, and a mechanical test on TSMC in 2024 with two honest results.
- Count Elliott waves
Elliott Wave Theory: Rules, Patterns and Fibonacci
The five-wave pattern, three hard rules, zigzags, flats and triangles, Fibonacci ratios and a real DAX count, from the first German translator of the standard work.
- Trade order blocks
Order Blocks: How to Spot, Draw and Trade the Zone
The three conditions behind a valid order block, entry and stop at the zone, two SPY cases from 2026 and a 25-year count where a fixed rule lost money.
- Interpret volume
Volume Analysis in Trading: How to Read Volume Honestly
What volume counts in stocks, futures, forex and crypto, how to read it against its own average, and our SPY test of high-volume days since 2001.