
Pullback Trading: Entries, Stops and Failed Setups


Contents
- Pullback trading in 30 seconds
- Pullback, retest or reversal: what is the difference?
- Context first: trend, timeframe and events
- Two ways to enter: limit order or confirmation
- One complete pullback method with fixed rules
- Three QQQ cases: target, stop and no trade
- Position size and execution: gaps, spread and costs
- Common pullback trading mistakes
- Pullback trading: my conclusion
- Frequently asked questions about pullback trading
- About the author
A pullback is a short move against the trend that you hope will end soon. That hope is the whole difficulty. While it happens, a pullback looks exactly like the first part of a reversal, and no indicator can tell you in advance which one it will be.
This guide does not promise a pullback that always works. It shows how to decide before the entry: what counts as a trend, where the pullback should stop, which signal you need and where you are wrong. Then it applies one fixed rule set to three real QQQ cases, a winner, a loser and a setup that was cancelled before it cost money. This article follows our editorial policy and is for education, not investment advice.
Pullback trading in 30 seconds
- A pullback is a pause, not a discount. Price moves back against the trend. Whether it resumes is only known afterwards.
- Two ways in. A limit order caps the price you pay but may not fill, or fills while the decline keeps going. A confirmation entry waits for a closed signal bar and takes the next market price; sometimes it never triggers.
- Rules first, cases second. Define the trend filter, the pullback, the signal, the stop, the target and a time limit before you look at examples.
- Three real cases, one rule set. On QQQ, the same rules produced a 2R winner, a full 1R loss and a cancelled setup. Three cases prove nothing about a win rate.
Pullback, retest or reversal: what is the difference?
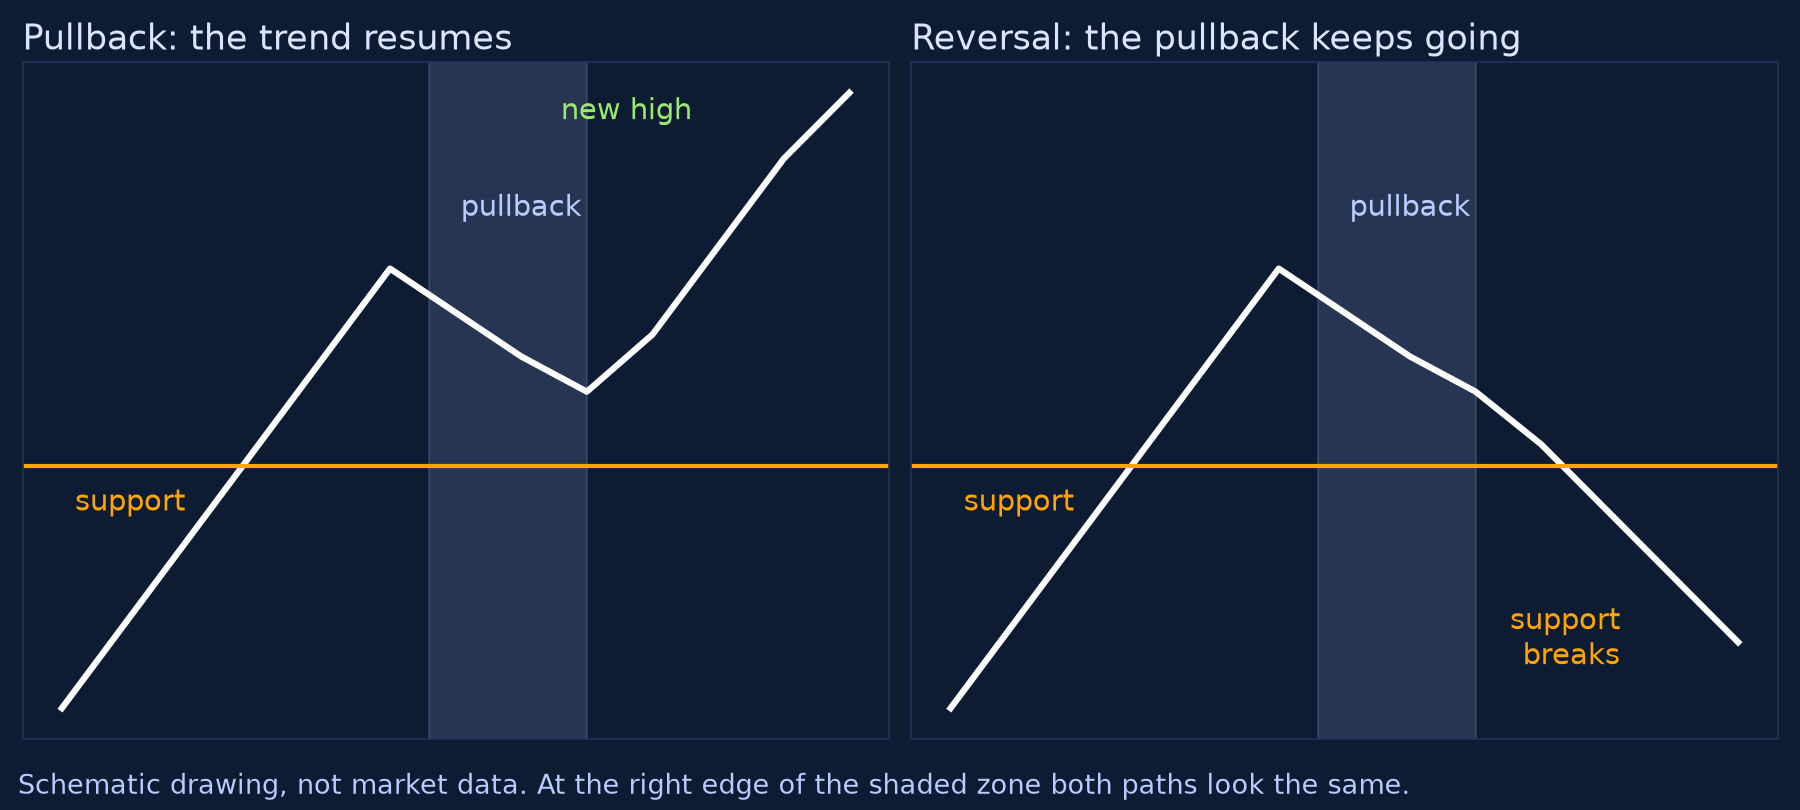
A pullback is a temporary move against an existing trend, after which the trend may continue. In an uptrend, price falls back for a few bars, often towards a moving average or an earlier price zone, before buyers take over again. A retest is a special case: price returns to a level it has just broken, as described in our guide to breakout trading.
 Click to enlarge
Source: Kagels Trading, own drawing.
A reversal starts the same way and then does not stop. Schwab describes this as a bull trap: an uptrending stock seems to make a temporary pullback, traders buy, and the stock keeps falling (Schwab, read on 25 October 2026). You cannot rule out a reversal in advance. You can only decide where your idea is wrong and how much that will cost.
Three signs suggest that a pullback is turning into something larger. Price closes below the last swing low, the decline is much faster than the rise before it, or the longer average starts to turn down. None of these is a guarantee; each is a reason to step aside rather than to buy more.
Context first: trend, timeframe and events
A pullback only exists inside a trend, so the trend definition comes first. Write it down as a rule you can check on a chart, for example “close above the 50-day average and the average rising”. Our guide to moving averages explains how these lines are calculated and where they lag.
Choose one timeframe for the trend and one for the entry. Many traders read the trend on the weekly or daily chart and time the entry on the daily or a shorter chart, as shown in our guide to multi-timeframe analysis. Mixing them freely after the fact is how a losing trade turns into “it was still a pullback on the weekly”.
Check the calendar before you trust a quiet pullback. Earnings reports, central bank decisions and inflation data can turn a calm pullback into a fast move in either direction. In thin markets, spreads widen and a planned entry can fill at a worse price. Our economic calendar lists the main US release dates.
Two ways to enter: limit order or confirmation
A limit order buys at your planned level; a confirmation entry buys after the market has shown strength. Both are valid. A limit controls the price but may not fill, or may fill during a decline; a confirmation entry waits for a completed signal and accepts the next market price.
| Limit at the planned level | Confirmation after a closed bar | |
|---|---|---|
| Entry price | At the limit or better, if it fills | The market price after the signal, higher or lower |
| When the decline continues | Fills on the way down | No entry unless a signal appears first |
| When price turns early | Can stay unfilled | Can stay out if no signal bar forms |
| What it controls | The highest price you pay | That the market showed strength first |
The QQQ cases below show the trade-off in numbers. Take a buy limit at the previous session’s 20-day average, known before the open and valid for the touch day only. In November 2024 it would have filled at 499.21, 3.95 below the confirmation entry. On 13 October 2026 it would have filled at 739.38, and on 23 October QQQ closed at 704.40, 4.73 percent below that price. We did not test stop or exit rules for this limit variant; the confirmation rule never entered that second trade.
One complete pullback method with fixed rules
The rules below were written down before we looked at any case. They are a teaching example, not an optimized strategy and not a method we claim has an edge. The point is that every decision is fixed in advance, so the outcome cannot be explained away later.
| Rule | Definition (daily bars) |
|---|---|
| Market and data | QQQ, regular US session, split-adjusted daily bars from Yahoo Finance |
| Trend filter | On the signal day: close above the 50-day simple average, and the 50-day average higher than 20 sessions earlier |
| Pullback | A touch day: the low reaches the 20-day average while the close stays above the 50-day average, after at least 5 sessions with lows above the 20-day average |
| Signal | Within the next 5 sessions, a close above the previous day’s high, trend filter still true |
| Cancelled | A close below the 50-day average before a signal, or no signal within 5 sessions |
| Entry | Open of the session after the signal; no trade if that open is at or below the stop |
| Stop | Lowest low from the touch day to the signal day |
| Target | Entry plus 2 × (entry minus stop), called 2R |
| Time limit | Exit at the close of the 15th session after entry |
Daily bars hide the order of events inside a day, so the fill rules are conservative. If a session opens beyond the stop or the target, the trade is filled at that open. If the stop and the target both fall inside the same day’s range, we count the stop first. A signal bar is known only after its close, so no trade is filled inside that bar.
From January 2024 to 23 October 2026, these rules produced 19 setups on QQQ. Fifteen became trades: three reached the target, seven were stopped out (one by a gap at the open) and five ended at the time limit; four setups were cancelled. Each setup was evaluated on its own, so two trades overlapped in time. The results add up to +1.8R before costs over 15 trades; that is not an account return, and the sample is far too small to say anything about an edge. We show the most recent case of each kind, chosen by that rule, not by how good it looks.
Three QQQ cases: target, stop and no trade
Case 1: the target was reached
 Click to enlarge
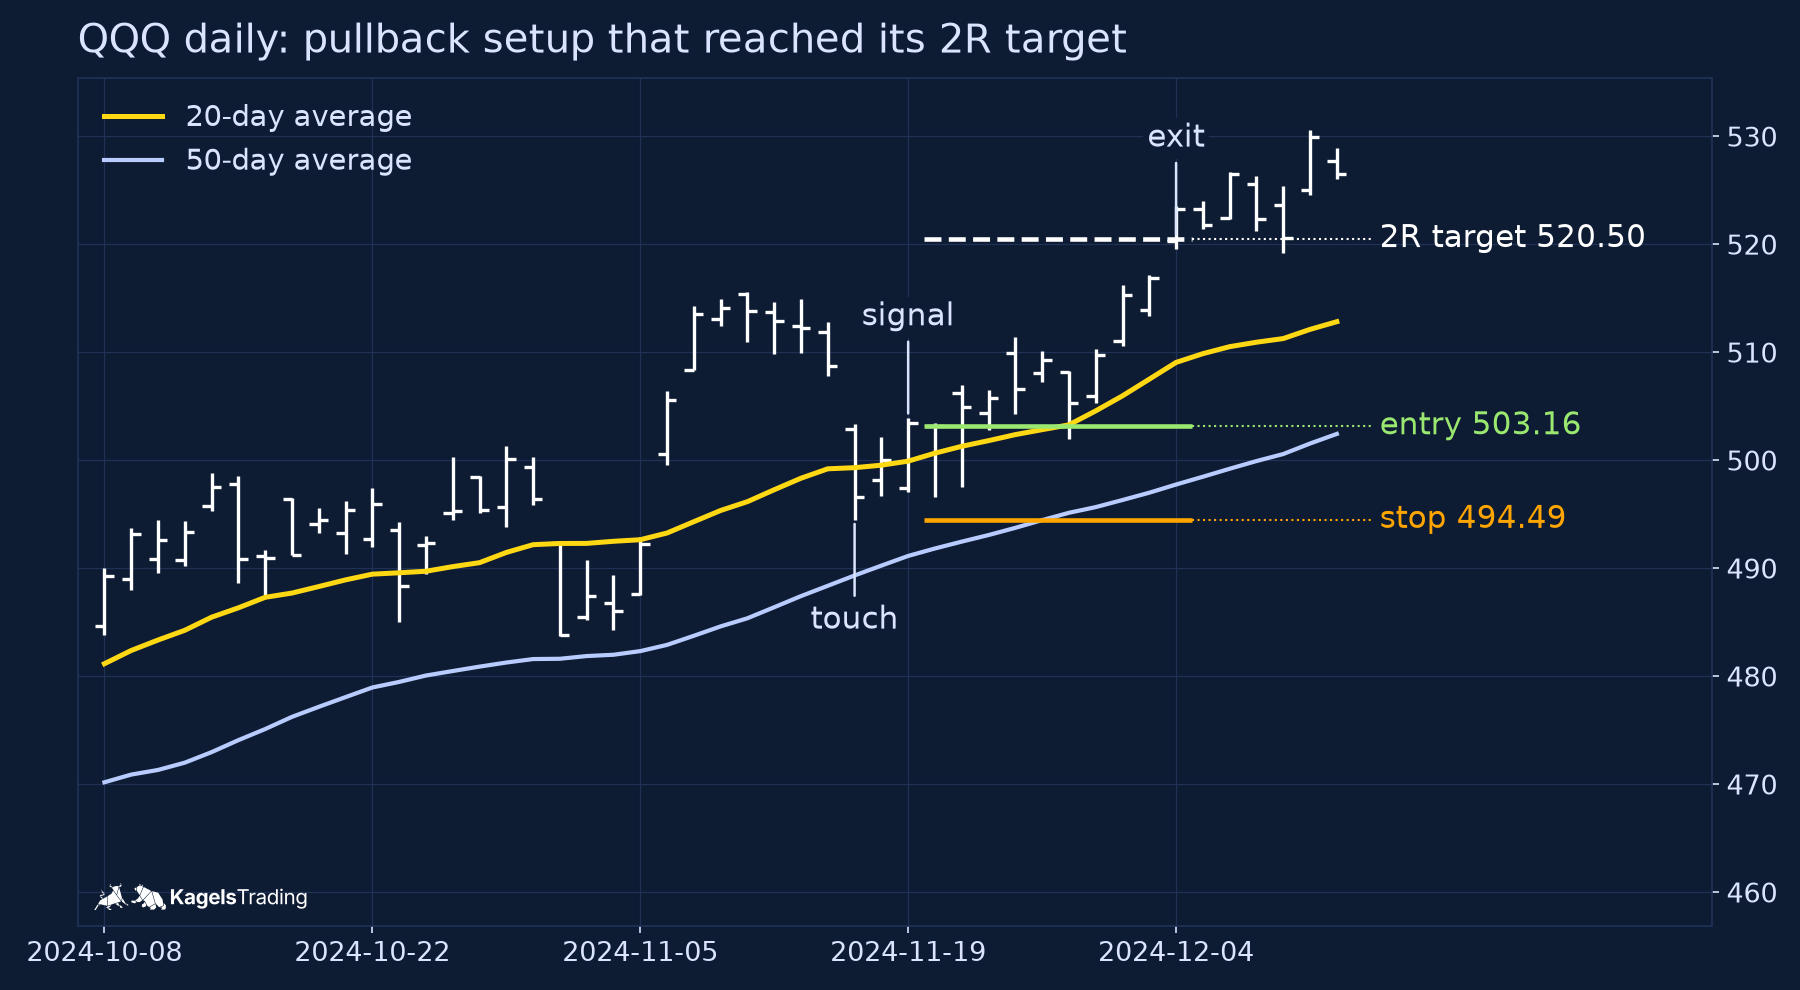
In November 2024, the setup worked as planned. On 15 November, QQQ fell to a low of 494.49, below its 20-day average of 499.32, and closed at 496.57, above the 50-day average. On 19 November it closed at 503.46, above the previous day’s high of 502.14: the signal. The entry was the open on 20 November at 503.16.
The stop sat at the pullback low of 494.49, so the risk was 8.67 per share. The 2R target was 520.50. QQQ opened at 520.32 on 4 December and traded up to 523.52, so the target was filled that day. Result: plus 2R before costs.
Case 2: the same rules were stopped out
 Click to enlarge
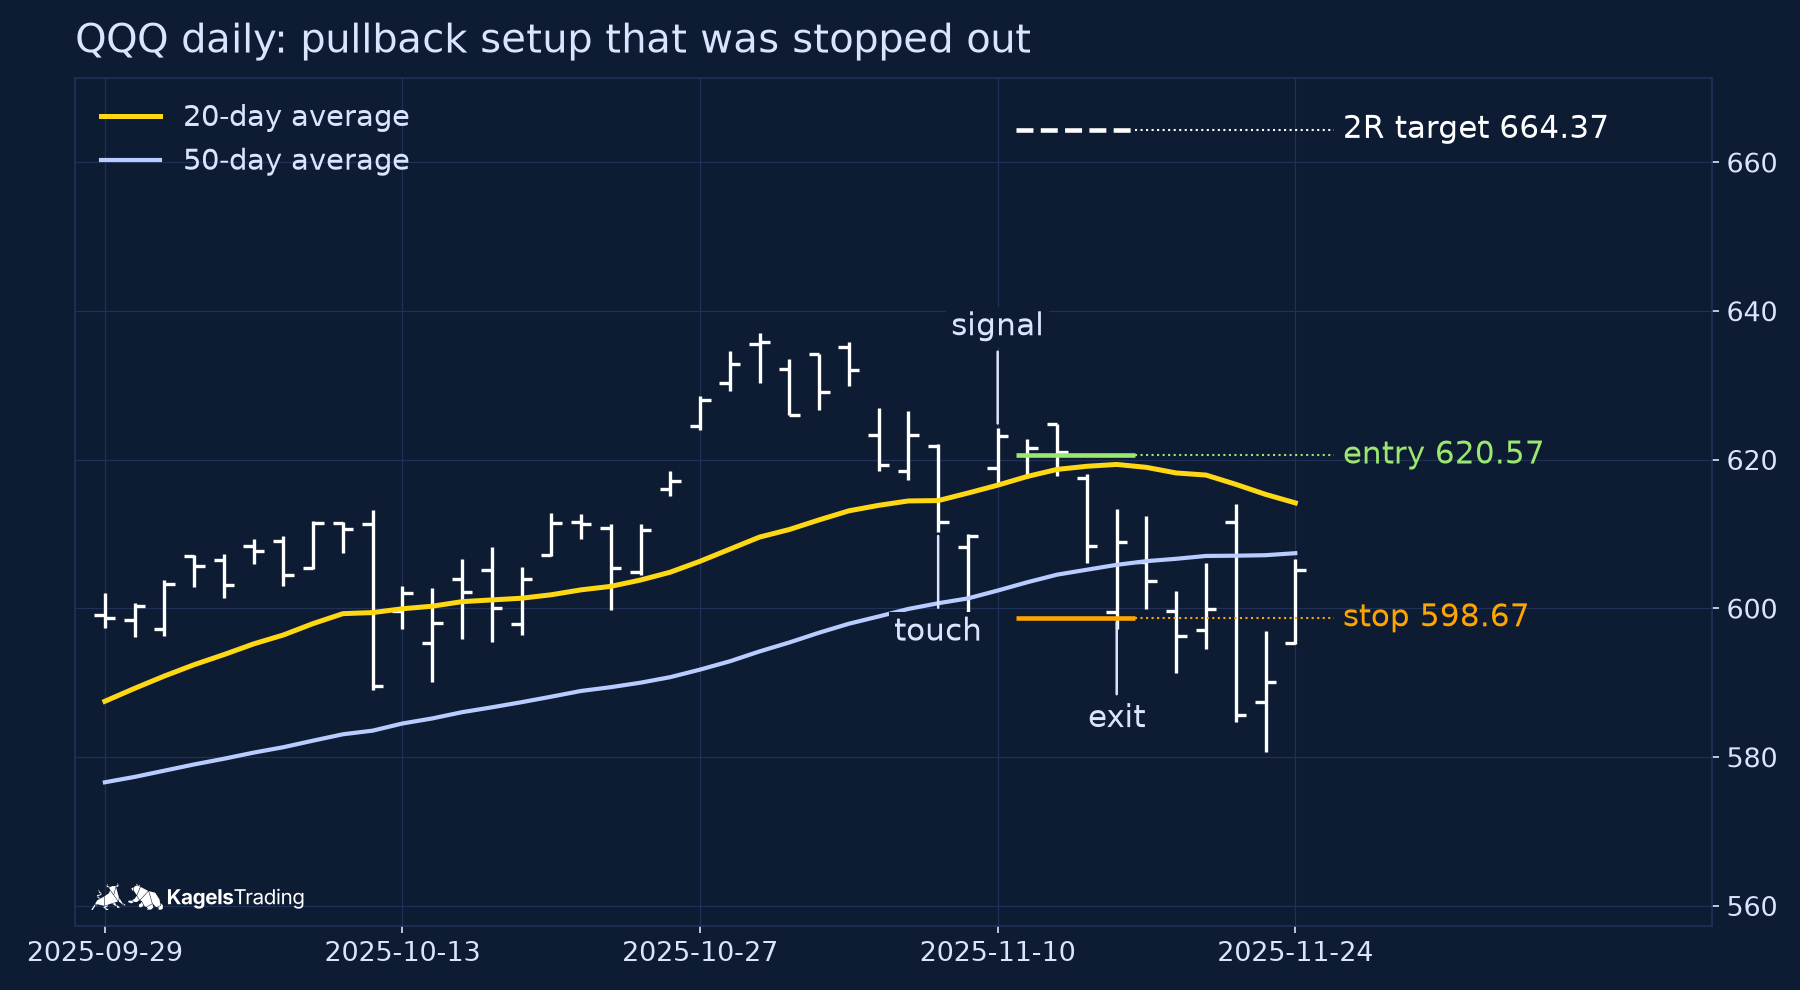
In November 2025, the same rules produced a loss. QQQ touched the 20-day average on 6 November, fell to 598.67 on 7 November and gave a signal on 10 November with a close of 623.23 above the previous high. The entry on 11 November was the open at 620.57, with the stop at 598.67 and a target of 664.37.
On 14 November, QQQ opened at 599.55, just above the stop, and traded down to 597.17. The stop was hit. By the close, QQQ was back at 608.86, above the stop. That is a normal part of pullback trading: a stop that is hit and then left behind is still a loss of 1R, and a fill on a real stop order can be worse than 598.67.
Case 3: the setup was cancelled before a signal
 Click to enlarge
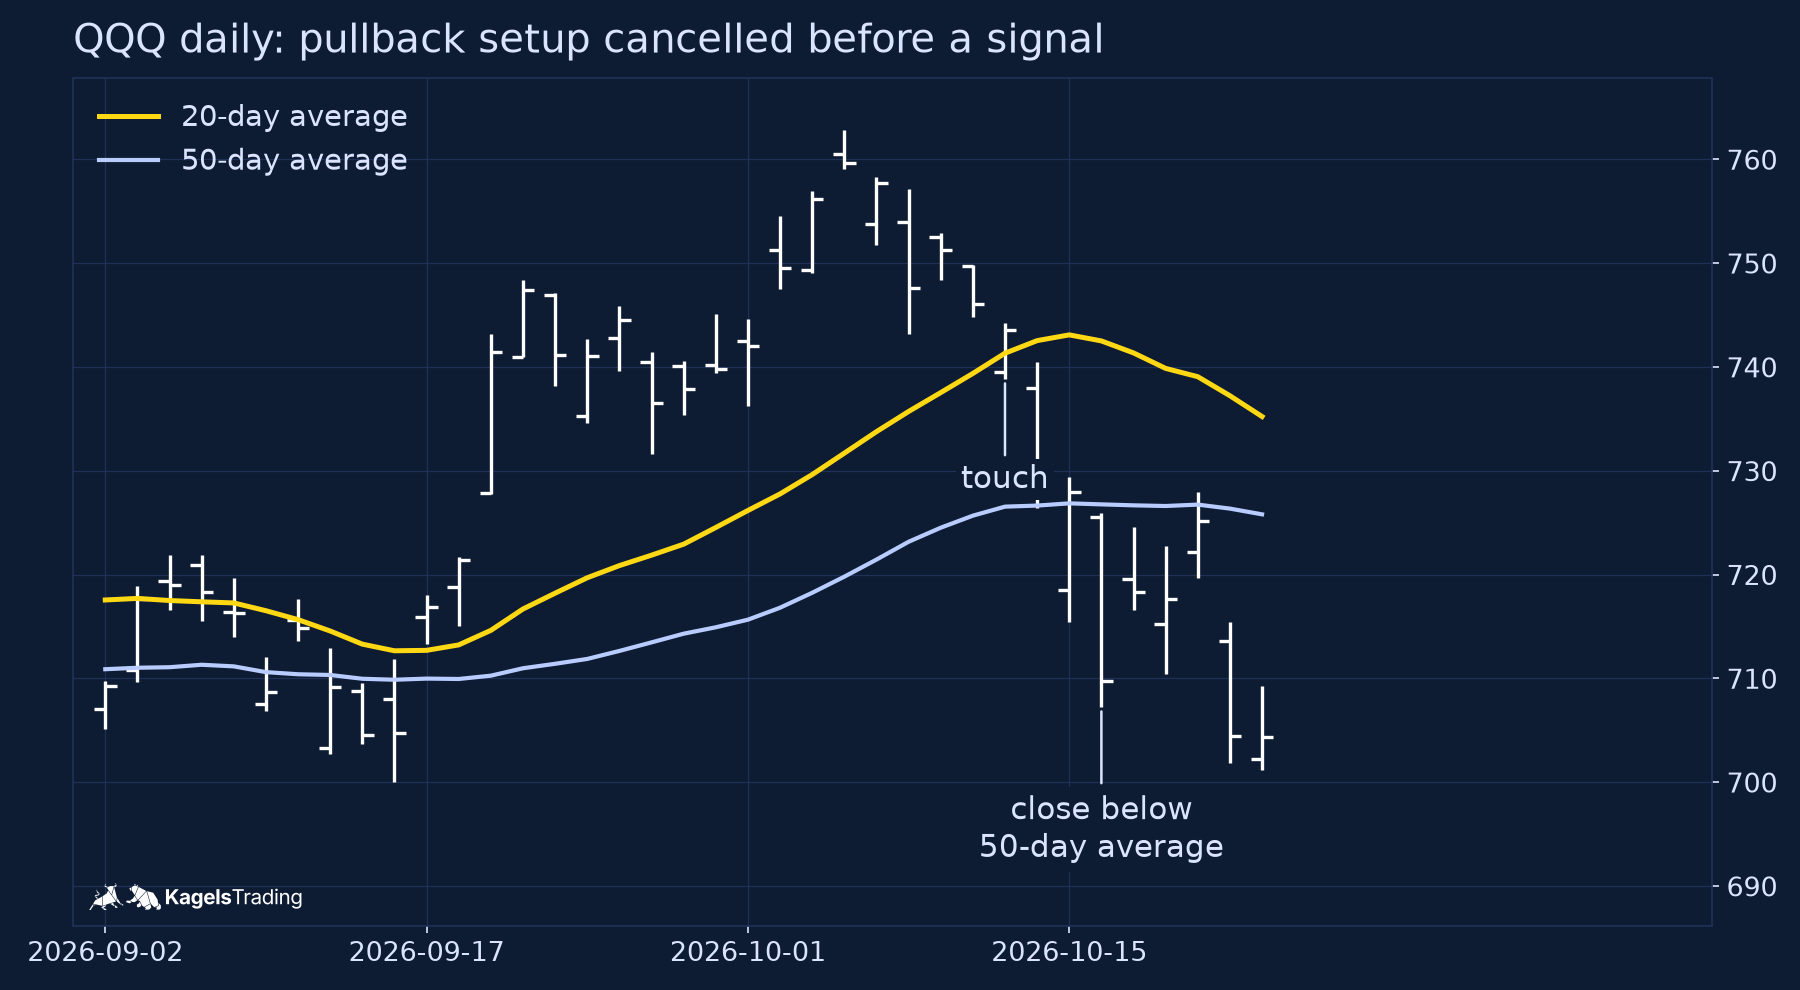
In October 2026, the method did nothing, and that was the useful part. On 13 October, QQQ dipped to 738.83, just below its 20-day average of 741.34, and closed at 743.57. No signal followed. On 16 October, QQQ closed at 709.80, below the 50-day average, and the setup was cancelled.
A limit buyer at the 20-day average would have been filled and then faced a falling market. QQQ closed at 704.40 on 23 October, 4.73 percent below the limit price of 739.38. The confirmation rule missed nothing here, because there was nothing to miss. A cancelled setup is a result, not a failure, and it belongs in any honest list of examples.
Position size and execution: gaps, spread and costs
Position size follows from the stop, not from how good the setup looks. Divide your risk budget by the distance from entry to stop and round down, as explained in our guide to position sizing. In Case 2, a stop distance of 21.90 per share and a $500 budget allow 22 shares, before costs.
The R figures above leave out costs, spread and slippage. In a real account, commissions, the bid-ask spread and a worse stop fill reduce every result. Overnight gaps can jump past a stop completely; in the 19 setups above, one trade lost slightly more than 1R that way.
A 2:1 reward-to-risk ratio is not a 67 percent chance of winning. It only says how far the target is from the entry compared with the stop. How often a target is reached depends on the market and the rules, and you only learn that by testing many cases, as described in our guide to backtesting.
Common pullback trading mistakes
Buying a falling market and calling it a pullback can cause substantial losses. If the trend filter is no longer true, there is no pullback to trade. The 50-day average in Case 3 was the line that ended the idea.
Moving the stop further away after entry turns a planned loss into an open-ended one. The stop belongs to the plan you made before the trade. If it is hit, the setup failed; a new setup needs a new plan, a new stop and a new size.
Spotting pullbacks in hindsight is easy and worthless. On a finished chart, every successful pullback looks obvious and the failed ones look like reversals. Only rules that use information available at the time, such as a closed bar, give you something you can test.
Pullback trading: my conclusion
Pullback trading is a way to join a trend at a planned risk, not a way to avoid losses. The same rules that produced a clean 2R winner in 2024 produced a full loss in 2025, and in 2026 they kept the trader out of a decline. That is what a rule set is for: it tells you in advance what you will do in each case.
Start with one market, one timeframe and written rules. Test them on past charts, record every setup including the cancelled ones, and size each trade from the stop. The pullback chapter in our swing trading guide shows a second rule set on SPY for comparison, and our comparison of day trading strategies applies a pullback rule to VWAP on 5-minute SPY bars.
Frequently asked questions about pullback trading
How do you identify a pullback?
A pullback is a move against an existing trend that you have defined in advance. For example: the price is above a rising 50-day average and falls back to the 20-day average. Without a written trend rule, any decline can be called a pullback afterwards.
What is the difference between a pullback and a reversal?
A pullback ends and the trend continues; a reversal turns the trend. At the time, the two look the same. A close below the last swing low or below your trend filter is a common sign that the idea is wrong, which is why the stop goes there.
Where should you enter a pullback?
Either with a limit order at a planned level or after a confirmation bar. The limit order caps the price but may not fill, or fills while the decline continues. The confirmation entry takes the next market price after a signal and can miss moves, but it avoided the October 2026 decline in our QQQ example.
Which timeframe is best for pullback trading?
There is no best timeframe, only one that fits your schedule and your test. Daily bars suit traders who check the market once a day; intraday charts need more screen time and are more affected by costs. Use the same timeframe for your rules, your backtest and your live trades.
More Chart Techniques guides
- Draw key levels
Support and Resistance: How to Draw and Use Key Levels
Where useful levels come from, how to draw zones with a stated rule and how to turn a level into a trade plan.
- Read price action
Price Action Trading: How to Read Charts Without Indicators
Market structure, key zones and three bar patterns, with a core setup and a real SPY example where the signal failed.
- Read candlestick charts
How to Read Candlestick Charts: Body, Wicks and Context
Open, high, low and close in one candle, body and wicks, two real Gold candles read step by step and how often patterns really occur.
- Know candlestick patterns
Candlestick Patterns: 10 to Know, Tested on Real Data
Ten patterns with rules and a cheat sheet, counted on DAX, S&P 500, EUR/USD and Gold since 2014: most are rare, none is a signal on its own.
- Combine timeframes
Multi-Timeframe Analysis: A Weekly and Daily Workflow
How to combine the weekly chart for context and the daily chart for entry under one stated rule, with a documented SPY case from June 2025.
- Trade sideways ranges
Range Trading: Boundaries, Orders and Two Documented Fades
A 14-session rule to draw horizontal boundaries, three order-type variants and two Alpaca-verified SPY fades, one that reached the target and one that was stopped out.
- Read chart formations
Chart Patterns: Reversals, Continuations and Failures
Reversal, continuation and bilateral formations with the measured-move convention per pattern and two documented SPY rectangle cases.
- Trade breakouts
Breakout Trading Strategy: Entries and False Breakouts
How often breakouts fell back into the range in our count of 1,472, and how to plan entry, stop and position size.
- Draw and trade trendlines
Trendline Trading: How to Draw Trendlines and Trade Them
How to draw trendlines with a fixed rule, four strategies for bounces, breaks and retests, and a real SPY line break without a lasting reversal.
- Use Fibonacci levels
Fibonacci Retracement Levels: How to Draw and Trade Them
How to calculate and draw retracement levels, trade pullbacks with confluence and a stop at the structure, and what a ten-year test says about the levels.
- Set Fibonacci targets
Fibonacci Extension: Levels, How to Draw It and Calculator
Three-point extension targets from the end of a pullback, why they differ from levels beyond 100%, a free calculator and three SPY swings, one without a single target reached.
- Trade gaps
Gap Trading Strategy: How to Trade Gaps and When Gaps Fill
Opening and full gaps, the four classic gap types, how often SPY gaps filled in our count since 2001, and plans for gap fill and gap and go.
- Calculate pivot points
Pivot Points: Formulas, Types and How to Trade Them
Formulas for standard, Fibonacci, Woodie, Camarilla and DeMark pivots, a free calculator, which session counts and a real SPY day.
- Swing trade
Swing Trading: 4 Strategies, Risk and Real Examples
Four swing trading strategies on the daily chart, position size, gap risk and US rules, with two hypothetical SPY pullbacks: one hit its target, one was stopped out.
- Identify market stages
Stage Analysis: Stan Weinstein's Four Market Stages
Stan Weinstein's four stages on the weekly chart, a Stage 2 checklist and two TSMC breakouts: one ran for a year, one gapped through its stop.
- Read Wyckoff ranges
Wyckoff Method: Accumulation, Distribution and Springs
Accumulation and distribution with phases A to E, springs and upthrusts as optional tests, and two real TSMC ranges read with and without hindsight.
- Trade Darvas boxes
Darvas Box Strategy: Rules, Entries and Stop Losses
The box rules step by step, when the edges become known, where the stop goes, and a mechanical test on TSMC in 2024 with two honest results.
- Count Elliott waves
Elliott Wave Theory: Rules, Patterns and Fibonacci
The five-wave pattern, three hard rules, zigzags, flats and triangles, Fibonacci ratios and a real DAX count, from the first German translator of the standard work.
- Trade order blocks
Order Blocks: How to Spot, Draw and Trade the Zone
The three conditions behind a valid order block, entry and stop at the zone, two SPY cases from 2026 and a 25-year count where a fixed rule lost money.
- Trade fair value gaps
Fair Value Gap (FVG): How to Spot, Trade and Test It
The three-candle rule, bullish, bearish and inverse FVG, two SPY cases from 2026 and a 25-year count of how often gaps were revisited and traded.
- Read liquidity sweeps
Liquidity Sweep: How to Spot It and Trade the Reversal
Sweep or run, buy-side and sell-side liquidity, internal and external targets, SPY reversal, continuation and failed-reversal examples and a 25-year count of a fixed sweep rule.
- Interpret volume
Volume Analysis in Trading: How to Read Volume Honestly
What volume counts in stocks, futures, forex and crypto, how to read it against its own average, and our SPY test of high-volume days since 2001.