
RSI Indicator: Formula, Settings and a 75-Year Test


Contents
- RSI in 30 seconds
- What is the RSI?
- How the RSI is calculated
- Overbought and oversold: 70 and 30
- My test: what RSI signals did on the S&P 500
- Trading the RSI: a buy-the-dip model on SPY
- RSI settings: 14, 9 or 2?
- RSI divergence
- RSI vs Stochastic RSI
- How to use the RSI with price action
- Advantages and disadvantages of the RSI
- My conclusion: a momentum gauge, not a reversal signal
- Frequently asked questions about the RSI
- About the author
The RSI is a widely used indicator, and its best-known rule did not hold up in my test. Above 70 a market is called overbought, below 30 oversold. Many traders read that as sell and buy. I tested both signals on the S&P 500 from 1951 to 2026. With the standard RSI 14 and the levels 30 and 70, the result did not match what the names suggest.
In this guide you learn how the RSI is calculated, which settings traders use and how to read it. Then you see the test against the base rate, a trading model on the SPY ETF and what a 2-period RSI changes. This article follows our editorial policy.
RSI in 30 seconds
- Definition: the Relative Strength Index (RSI) compares smoothed recent gains with smoothed recent losses on a scale from 0 to 100. The default setting is 14 periods.
- Overbought did not mean down in this test: after the RSI 14 first rose above 70, the S&P 500 was higher 21 sessions later in 66.7% of cases, more often than after any day (61.6%).
- Oversold did not mean up in this test: after it first fell below 30, the index was higher in 58.1% of cases, slightly less often than after any day.
- A buy-the-dip model won often but earned little: 41 trades on SPY since 1993, 78% winners, but only 2.2% a year, because the money was invested 7% of the time.
- Use it as a momentum gauge, not as a reversal signal. A high RSI shows strength; it does not show a top.
What is the RSI?
The Relative Strength Index (RSI) is a momentum oscillator that measures the speed and size of recent price changes on a scale from 0 to 100.
J. Welles Wilder introduced the RSI in 1978 in his book New Concepts in Technical Trading Systems, according to the RSI help page of TradingView. An oscillator is an indicator that swings within a fixed range. Momentum means the direction and speed of a price move.
Do not confuse the RSI with relative strength. Relative strength usually compares one stock with an index, for example to find stocks that rise faster than the market; Stage Analysis uses it that way. The RSI compares a market only with its own past gains and losses.
I trade without indicators myself, based on price action. The RSI is still worth understanding, because it is on many charts and because its signals are often misread.
How the RSI is calculated
The RSI divides Wilder-smoothed gains by Wilder-smoothed losses and turns the result into a number between 0 and 100. The steps for the default setting of 14 periods:
- For each close, take the change from the previous close. A rise counts as a gain, a fall as a loss (as a positive number).
- Average the gains and the losses of the first 14 changes (that needs 15 closes).
- From then on, smooth both averages Wilder’s way: new average = (previous average × 13 + today’s value) ÷ 14.
- RS = average gain ÷ average loss.
- RSI = 100 − 100 ÷ (1 + RS).
Wilder’s smoothing gives the newest change a weight of 1/14. A conventional 14-period exponential average would give it 2/15, so Wilder’s version reacts a little more slowly. Older changes never drop out completely; their weight shrinks with every new close. That is why two platforms with different data histories can show slightly different RSI values. My values start in 1950 and use S&P 500 closes from Yahoo Finance.
A worked reading from October 15, 2026: the S&P 500 closed at 7,744.06 points with an RSI 14 of 51.9. That is close to the middle: the smoothed gains and losses were roughly balanced. The 2-period RSI, which reacts much faster, stood at 38.6 after a weak close on October 14.
Overbought and oversold: 70 and 30
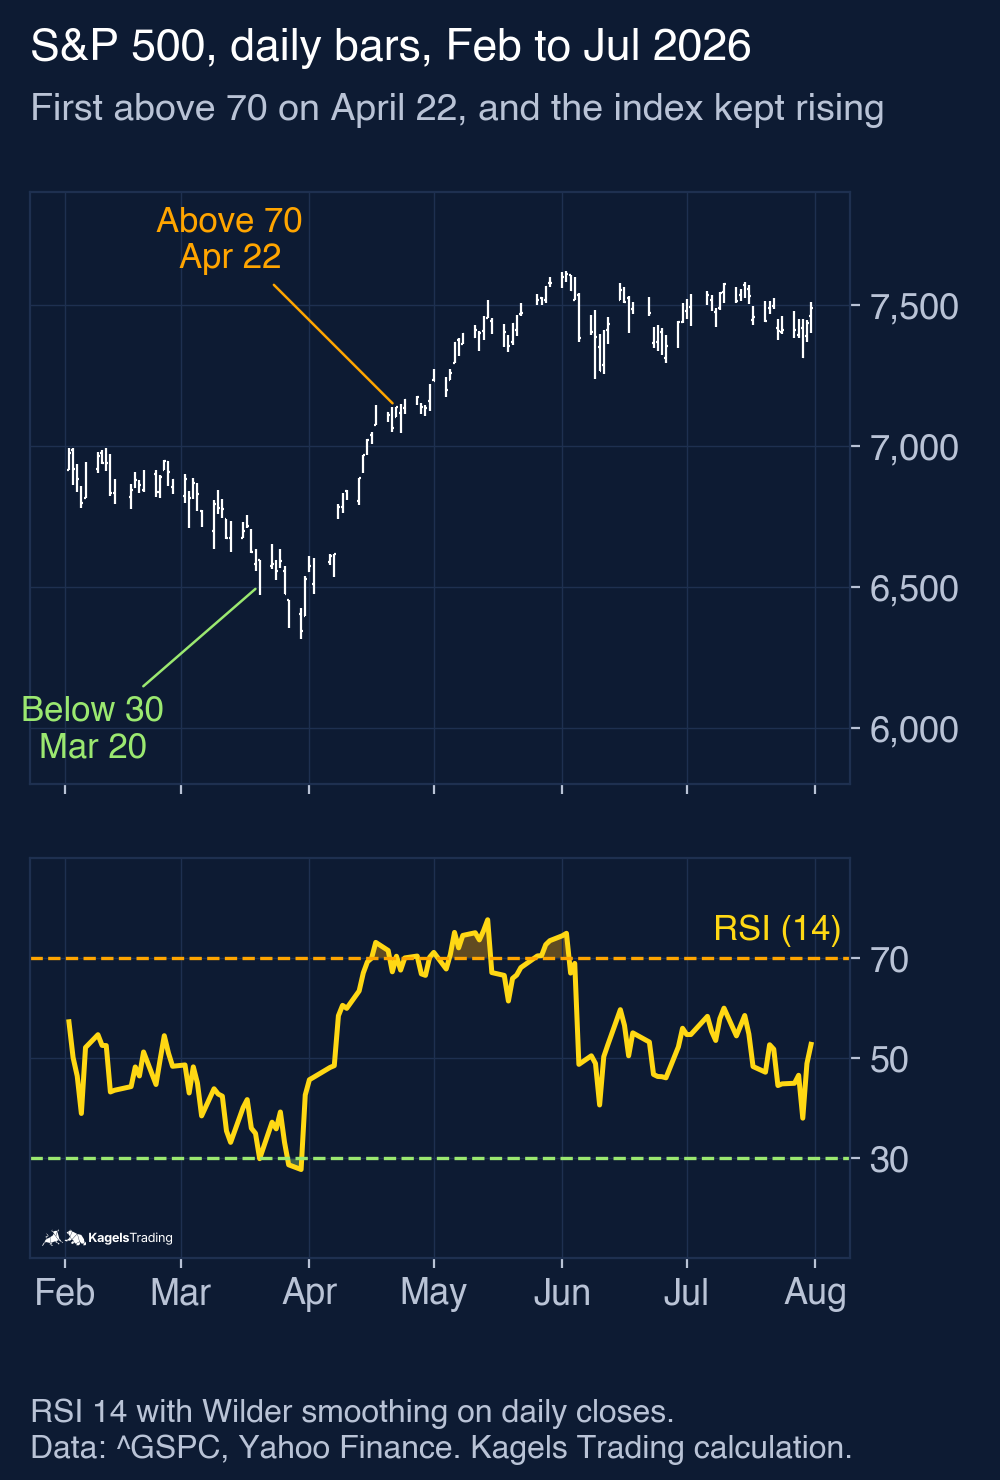
By convention, an RSI above 70 is called overbought and an RSI below 30 oversold. The words suggest that the market has gone too far and must turn. The formula says something else: an RSI above 70 only means that the smoothed gains clearly outweighed the smoothed losses, with the most weight on recent sessions.
 Click to enlarge
The spring of 2026 shows the problem. The RSI first closed below 30 on March 20, 2026, at 6,506.48 points. The index still fell further: the lowest close came on March 30 at 6,343.72. On April 22 the RSI first closed above 70, at 7,137.90 points. Anyone who sold there missed the rest of the rise: on May 26 the index closed at 7,519.12, and between April 22 and June 30 the RSI was above 70 on 19 sessions in total, not all in a row.
In a strong trend the RSI can stay at an extreme for weeks. Since 1951 the RSI 14 of the S&P 500 was above 70 on 10.8% of all days and below 30 on only 3.4%. Stock indices rise more often than they fall, so high readings are more common than low ones.
My test: what RSI signals did on the S&P 500
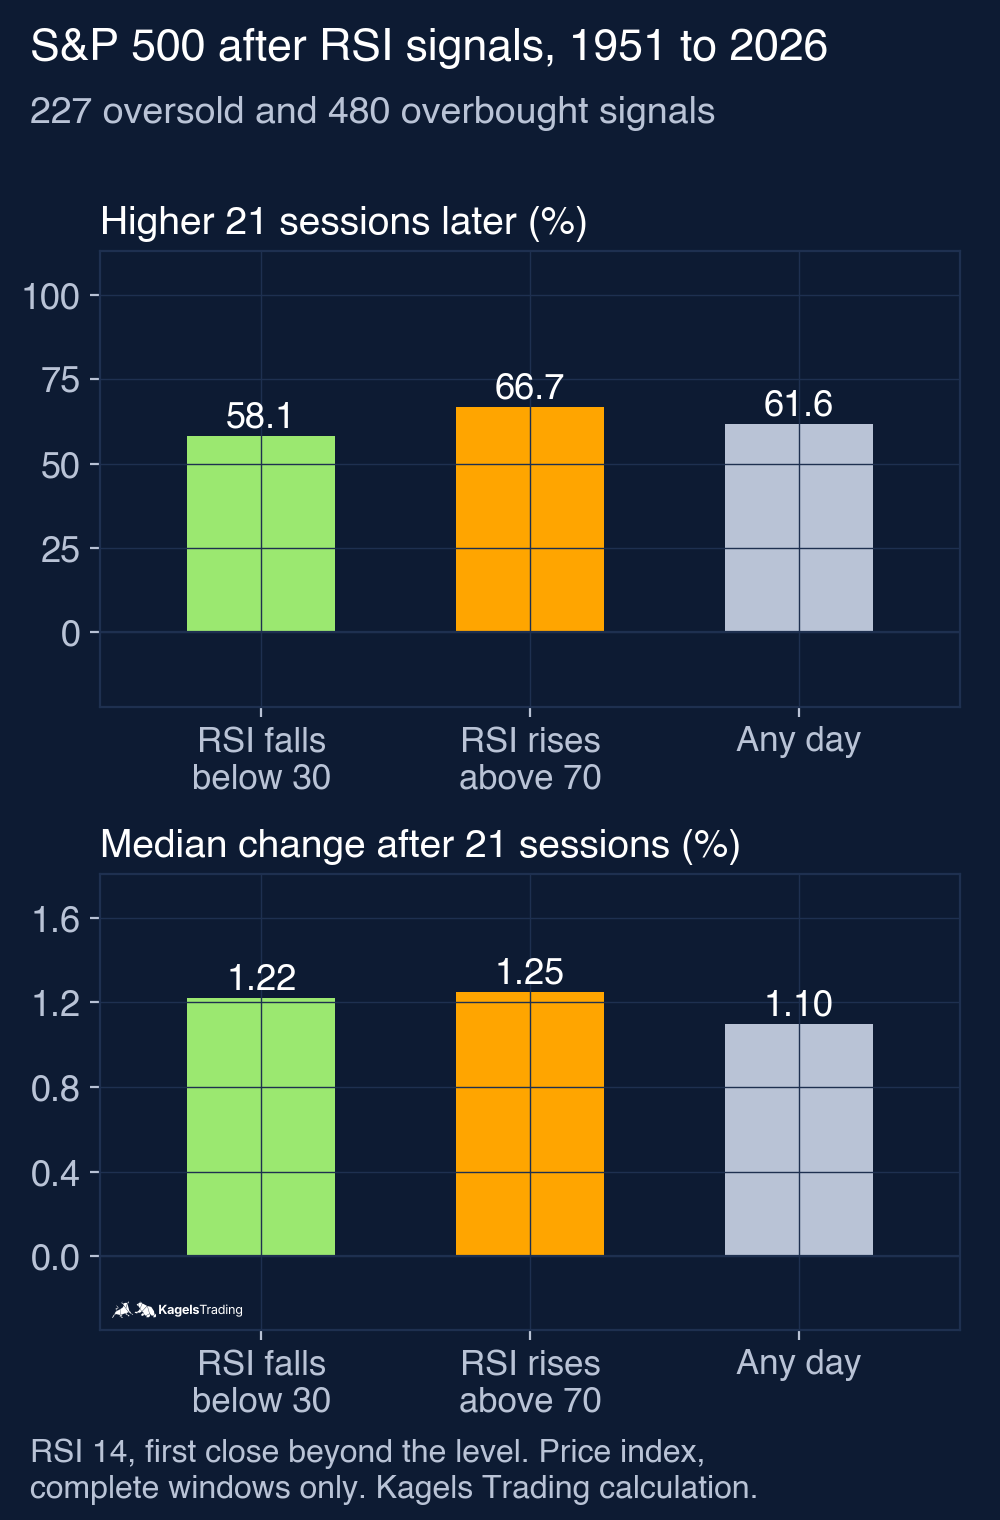
I wrote down the rules before I calculated anything. Data: daily closes of the S&P 500 price index from January 1950 to October 15, 2026, with a 250-session warm-up, so the count starts on January 3, 1951. A signal is the first close beyond the level: an RSI 14 below 30 after a close at or above 30, or above 70 after a close at or below 70. Every day below 30 would count the same weak market many times. I then measured the price change 5, 21 and 63 sessions later and compared it with all days (the base rate). Only complete windows count.
 Click to enlarge
| Window after the signal | RSI falls below 30 (227) | RSI rises above 70 (480) | Any day |
|---|---|---|---|
| 5 sessions, share higher | 53.7% (122) | 61.7% (296) | 56.7% (10,812 of 19,064) |
| 21 sessions, share higher | 58.1% (132) | 66.7% (320) | 61.6% (11,740 of 19,048) |
| 21 sessions, median change | +1.22% | +1.25% | +1.10% |
| 63 sessions, share higher | 63.9% (145) | 69.6% (334) | 66.6% (12,667 of 19,006) |
| 63 sessions, median change | +3.36% | +3.08% | +2.67% |
| 21 sessions, 10% worst cases below | −5.5% | −3.5% | −4.4% |
Overbought was followed by gains more often than an average day. After the RSI first rose above 70, the index was higher 21 sessions later in 66.7% of cases, against 61.6% for any day, and the bad cases were milder. In this sample, a first close above 70 marked strength that tended to continue, not a top. I tested this only as an outcome study; I did not test a short strategy.
Oversold was not a reliable buy signal either. After the first close below 30, the share of higher windows was slightly below the base rate on all three horizons, and the bad cases were worse. The median change after 63 sessions was somewhat higher, so the picture is mixed: oversold markets swing more in both directions.
Read these numbers with care. 227 and 480 signals are not tiny samples, but windows overlap: in the base rate, and also among signals that follow each other within a few weeks. A few percentage points can come from chance. These are descriptions of the S&P 500 price index, not proof of an edge. The base rate here covers January 1951 to October 2026.
The variants: 20/80 levels and the 2-period RSI
I planned two variants before I calculated, and both are reported here. Neither was picked after the fact. They show that the result depends on the threshold.
| Variant | Signals | 5 sessions higher | 21 sessions higher | 63 sessions higher |
|---|---|---|---|---|
| RSI 14 falls below 20 | 35 | 68.6% (24) | 60.0% (21) | 57.1% (20) |
| RSI 14 rises above 80 | 65 | 63.1% (41) | 55.4% (36) | 56.9% (37) |
| RSI 2 falls below 10 | 1,179 (1,178 complete) | 54.9% (647) | ||
| Any day | 56.7% (10,812 of 19,064) | 61.6% (11,740 of 19,048) | 66.6% (12,667 of 19,006) |
The stricter levels give few signals and no stable pattern. After the RSI 14 fell below 20, the index rose more often over the next five sessions (68.6%), but over 63 sessions less often than on an average day. Above 80, the pattern of the 70 level did not hold: only 55.4% were higher after 21 sessions, below the base rate. With 35 and 65 cases, these numbers move a lot with each single event. The 2-period RSI below 10 gave 1,179 signals and was slightly below the base rate after five sessions.
All registered results
This table lists every result the test plan promised, including the weak ones. Each row counts the first close beyond the level. Mean and median are price changes of the S&P 500 index; the last column shows the change that the worst tenth of cases reached or fell below (10th percentile).
| Signal and window | Higher | Mean | Median | 10th percentile |
|---|---|---|---|---|
| RSI 14 below 30, 5 sessions | 122 of 227 (53.7%) | +0.18% | +0.24% | −2.96% |
| RSI 14 below 30, 21 sessions | 132 of 227 (58.1%) | +0.91% | +1.22% | −5.47% |
| RSI 14 below 30, 63 sessions | 145 of 227 (63.9%) | +3.23% | +3.36% | −7.52% |
| RSI 14 above 70, 5 sessions | 296 of 480 (61.7%) | +0.22% | +0.33% | −1.70% |
| RSI 14 above 70, 21 sessions | 320 of 480 (66.7%) | +0.88% | +1.25% | −3.53% |
| RSI 14 above 70, 63 sessions | 334 of 480 (69.6%) | +2.23% | +3.08% | −6.05% |
| RSI 14 below 20, 5 sessions | 24 of 35 (68.6%) | +1.10% | +1.20% | −2.27% |
| RSI 14 below 20, 21 sessions | 21 of 35 (60.0%) | +0.62% | +1.66% | −10.97% |
| RSI 14 below 20, 63 sessions | 20 of 35 (57.1%) | +1.95% | +1.70% | −7.24% |
| RSI 14 above 80, 5 sessions | 41 of 65 (63.1%) | +0.01% | +0.28% | −1.38% |
| RSI 14 above 80, 21 sessions | 36 of 65 (55.4%) | −0.10% | +0.49% | −4.03% |
| RSI 14 above 80, 63 sessions | 37 of 65 (56.9%) | +0.61% | +1.21% | −6.22% |
| RSI 2 below 10, 5 sessions | 647 of 1,178 (54.9%) | +0.25% | +0.22% | −2.38% |
| Any day, 5 sessions | 10,812 of 19,064 (56.7%) | +0.18% | +0.30% | −2.34% |
| Any day, 21 sessions | 11,740 of 19,048 (61.6%) | +0.75% | +1.10% | −4.37% |
| Any day, 63 sessions | 12,667 of 19,006 (66.6%) | +2.24% | +2.67% | −6.67% |
Trading the RSI: a buy-the-dip model on SPY
A test of single signals is not the same as a trading rule. So I also tested the most common use, buying oversold dips, as a hypothetical model on the SPY ETF from 1993 to October 2026. The RSI 14 is calculated from SPY’s own unadjusted closes, as on a chart, after a 250-session warm-up. When it first closes below 30, the model buys at the next opening price. When the RSI closes above 50, it sells at the next open. Both exits (above 50, and above 70 for the RSI 2 variant) were set before the test as simple illustrative rules, not optimised. Entry and exit each cost an assumed 0.05%, cash earns nothing, and dividends are reinvested at the opening price of the ex-dividend date, an idealised convention.
| SPY, Jan 1993 to Oct 2026 | RSI 14 dip model | RSI 2 variant | Buy and hold |
|---|---|---|---|
| Completed trades | 41 | 368 (plus 1 open) | 1 entry |
| Winning trades | 78.0% | 70.9% | |
| Average / median trade | +1.88% / +2.46% | +0.52% / +0.72% | |
| Worst trade | −11.2% | −13.6% | |
| Return per year | 2.2% | 5.6% | 10.8% |
| Largest drawdown | −28.8% | −31.2% | −55.2% |
| Time in the market | 6.9% | 20.8% | 100% |
The model won often and earned little. Four out of five trades were winners, which is what makes this rule look attractive in a screenshot. But the money was invested only 6.9% of the time, and one losing trade of 11.2% wiped out several winners. Over 33 years the model earned 2.2% a year, against 10.8% for buy and hold. The RSI 2 variant (buy below 10, sell above 70) traded far more and earned 5.6% a year. Its last position, entered on October 15, 2026, was still open; it is not in the trade statistics but is included in the equity at the last close. Taxes are not included.
A high hit rate alone says little. What counts is the size of the wins against the size of the losses and how long the money is tied up. The guide to backtesting explains how to test such a rule without fooling yourself, and risk management covers what one bad trade may cost.
RSI settings: 14, 9 or 2?
The default of 14 periods comes from Wilder’s original work. A shorter setting makes the RSI faster and more extreme; a longer one makes it smoother and rarely reach 30 or 70.
- RSI 14: the standard. On the S&P 500 it was above 70 on 10.8% and below 30 on 3.4% of days.
- Shorter (2 to 9): reaches the extremes much more often. The RSI 2 fell below 10 on 1,179 separate occasions since 1951.
- Longer (20 to 30): smoother; the 70 and 30 levels are reached rarely, so some traders move them closer to 50.
Whatever you choose, test it before you trust it, and keep it. If you change the length after every loss, you will always find a setting that would have worked in the past.
RSI divergence
A divergence forms when price makes a new high or low and the RSI does not. A bearish divergence is a higher price high with a lower RSI high; a bullish one is a lower price low with a higher RSI low. Traders read it as a sign that momentum is fading, before price shows it.
I have not tested RSI divergences here. The same idea is explained and counted for the MACD in the MACD indicator guide: there, most bearish divergences in the S&P 500 did not end the rise. A divergence is a warning to watch the chart more closely, not a signal on its own.
RSI vs Stochastic RSI
The Stochastic RSI applies the stochastic formula to the RSI values instead of to price. It shows where today’s RSI stands within its own range over a set period, from 0 to 1 (or 0 to 100). According to TradingView’s help page, Tushar Chande and Stanley Kroll introduced it in 1994.
It is an indicator of an indicator, and therefore much faster. The Stochastic RSI reaches its extremes far more often than the RSI itself. More signals do not mean better ones; I have not tested it here.
How to use the RSI with price action
In my test, a high RSI looked more like strength than like a coming reversal. The first close above 70 was followed by more gains than average; above 80 that did not hold, so treat it as a tendency in one sample, not a rule. That fits the idea of momentum: markets that rise strongly have often kept rising for a while.
One option is to combine the RSI with levels from the chart. An oversold reading near a support zone that held before gives the reading a place on the chart; in the middle of a move it has none. How to draw such zones is shown in the guide to support and resistance. This combination is an idea, not something this test measured.
Advantages and disadvantages of the RSI
The RSI is easy to read, but its classic rules did not hold up in my test. The lists sum up the strengths and the weaknesses.
What speaks for the RSI
- Simple and bounded: a scale from 0 to 100 makes readings comparable across markets.
- A momentum gauge: first closes above 70 marked strength that tended to continue on the S&P 500.
- Available everywhere: every charting platform has it built in with the same default.
What speaks against the RSI
- Overbought was not a sell signal in this test: after the first close above 70 the index rose more often than average.
- Oversold was not a buy signal in this test: after the first close below 30 the index rose slightly less often than average.
- High hit rates can mislead: the dip model won 78% of its trades and earned 2.2% a year.
- Sensitive to settings: the length and the levels change the number of signals a lot.
My conclusion: a momentum gauge, not a reversal signal
The RSI is more useful as a momentum gauge than as a reversal signal. On the S&P 500 since 1951, a first close of the RSI 14 above 70 was followed by gains more often than an average day, and a first close below 30 slightly less often. The stricter levels 20 and 80 behaved differently, so the result depends on the threshold. The classic rule of selling at 70 and buying at 30 does not fit these numbers.
For me as a price action trader the RSI adds little to the chart itself. It summarizes what the bars already show: strong gains or strong losses. If it helps you see momentum at a glance, use it for that, and take entries from price.
This article is market analysis, not investment advice. Past results of an index study or a model do not show future returns.
Frequently asked questions about the RSI
What is the RSI in simple terms?
The RSI shows whether recent gains or losses dominated, smoothed over about 14 periods, on a scale from 0 to 100. Above 50, gains were larger; below 50, losses were larger.
What does an RSI above 70 mean?
It means that smoothed gains clearly outweighed smoothed losses, with the most weight on recent sessions. It is called overbought, but on the S&P 500 since 1951 the index was higher 21 sessions later in 66.7% of cases after the first close above 70, more often than after any day.
Is an RSI below 30 a buy signal?
Not on its own, at least not in my S&P 500 test. After the first close below 30, the index was higher 21 sessions later in 58.1% of cases, slightly less often than after any day (61.6%). A support zone on the chart can add context; I have not tested that combination.
What is the best RSI setting?
There is no tested best setting; 14 periods is the standard. Shorter settings like 2 or 9 react faster and give many more signals. Longer ones are smoother. Choose one, test it and keep it.
What is the difference between RSI and Stochastic RSI?
The RSI measures price momentum; the Stochastic RSI measures where the RSI stands within its own recent range. That makes the Stochastic RSI much faster and more often at its extremes.
Does the RSI work for day trading?
The formula works on any time frame, including 1-minute or 5-minute charts. I tested only daily closes of the S&P 500 here, so I cannot say how the signals behave intraday.
More Technical Indicators guides
- Judge a golden cross
Golden Cross: Definition and S&P 500 Test Results
How the 50-day and 200-day averages cross, and what 38 signals in the S&P 500 since 1950 did against the base rate and buy and hold.
- Use moving averages
Moving Averages: SMA, EMA and a 76-Year 200-Day Test
SMA, EMA and WMA formulas with a worked example, common periods, and what the 200-day line showed on the S&P 500 since 1950.
- Read volatility with Bollinger Bands
Bollinger Bands: Settings, Squeeze and a 76-Year Test
Settings, the three typical chart situations, five strategies with rules, and what the bands and the squeeze showed on the S&P 500 since 1950.
- Set stops with the ATR
ATR Indicator: Average True Range for Stops and Size
True range and Wilder smoothing, stop distance and position size, and how ATR stops behaved on SPY from 1994 to 2026 against a fixed stop.
- Trade Donchian breakouts
Donchian Channel: Breakout Rules and a 20-Year ETF Test
Channel rules, the current-bar pitfall, the Turtle systems, and what 499 breakout trades in SPY, GLD and TLT from 2006 to 2026 showed.
- Read the MACD
MACD Indicator: Histogram, Divergence and a 31-Year Test
Formula, histogram, crossovers and divergences, with a 31-year test on the S&P 500 and the DAX against the base rate.
- Use VWAP
VWAP Indicator: Formula, Anchored VWAP and TradingView Setup
The VWAP formula, trend day versus range day, Anchored VWAP and the right settings in TradingView.