
Support and Resistance: How to Draw and Use Key Levels


Contents
- Support and resistance in 30 seconds
- What are support and resistance?
- How to draw support and resistance
- Using volume as a supporting filter
- Calculated levels: moving averages, Fibonacci and pivots
- My level map: how I build a chart
- From a level to a trade plan
- Strengths, limitations and common mistakes
- Conclusion: a map, not a signal
- Frequently asked questions about support and resistance
- About the author
Many traders draw far too many lines on their charts. After ten minutes the chart looks like a grid of possibilities and stops helping with a decision. I have traded mainly at support and resistance since 1980, and my biggest step forward was not a new method. It was leaving out the unimportant levels and keeping the few with a clear origin.
Support and resistance tell you where to look, not when to buy. This guide shows where useful levels come from, how to draw them with a stated rule and how to turn them into a trade plan with a trigger, a stop and a target. It also shows a level that did not hold. This article follows our editorial policy.
Support and resistance in 30 seconds
- Support is a price area below the market where buying stopped a decline before. Resistance is the area above the market where selling stopped a rise.
- Zones, not exact prices: markets rarely turn to the cent. Draw an area with a rule you can repeat.
- Four sources give most useful levels: swing highs and lows, consolidations, gaps and round numbers.
- Role reversal: a broken level can change sides. It can hold, and it can fail.
- A level is not an entry. You still need a trigger, a stop planned before entry, a position size and a target.
What are support and resistance?
Behind every level is a record of where buying and selling changed balance. Price rises while demand outweighs supply and falls when that balance turns. At a price where the market turned before, some traders want to add to a position and others want out of a losing trade, so orders can gather there again.
| Support | Resistance | |
|---|---|---|
| Where | Below the current price | Above the current price |
| What happened there before | Buying stopped a decline | Selling stopped a rise |
| After a clean break | May act as resistance on a return from below | May act as support on a return from above |
Liquidity and execution conditions differ across markets. Whether a level is useful needs to be tested for the market and the method you trade. A level on a major index future and one on a thinly traded stock are not the same kind of evidence.
Zones and exact reference prices
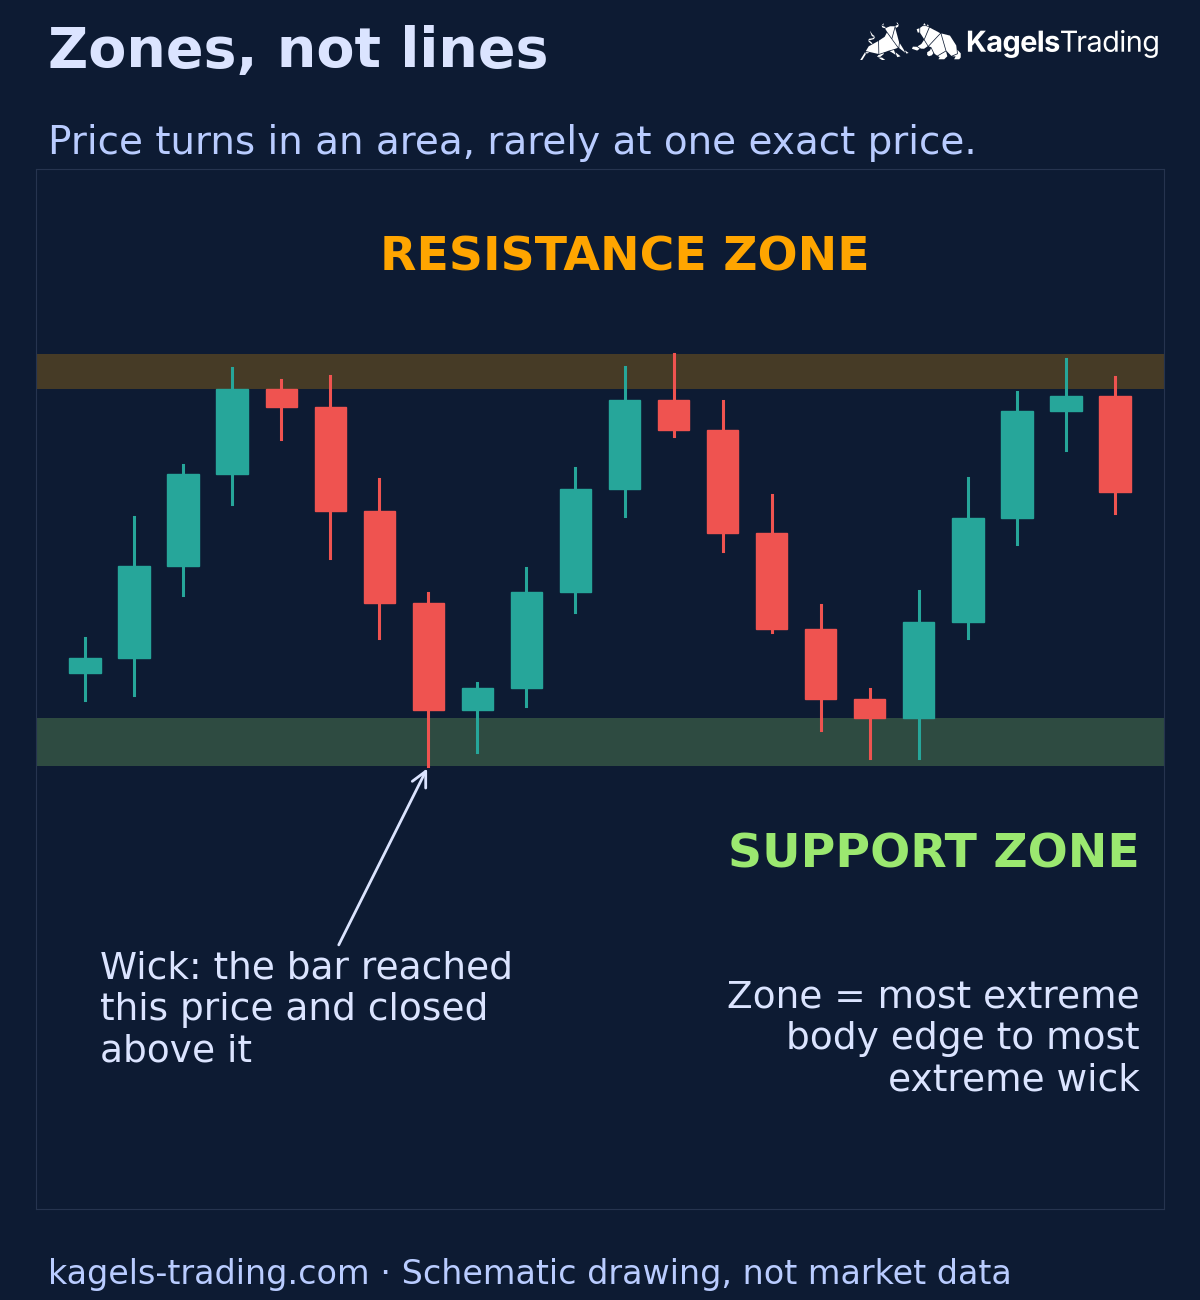
A chart line looks precise, but the market does not trade that way. Price does not turn at exactly 5,000.00; it turns somewhere around it. A hairline on one extreme gets hit by normal noise even when the idea was right. The CME Group makes the same point: levels are zones, not prices that hold to the penny.
 Click to enlarge
Source: Kagels Trading, own drawing.
A candle shows four prices, not how long price stayed there. The body spans the open and the close; the wicks extend to the high and the low of the bar. On transaction-based charts these are traded prices; on quote-based forex or CFD charts they are feed quotes. I draw a zone from the most extreme body edge to the most extreme wick of the bars that turned. That is a method, not a definition, and the width of the zone shows how much room a stop needs.
Some prices deserve a line of their own, even inside a zone. Last month’s low, last year’s high or a quarter’s open are named reference prices with a date and a clear origin. In my charts they stay as separate lines, and the reaction area is the space they form together.
Role reversal: when support becomes resistance
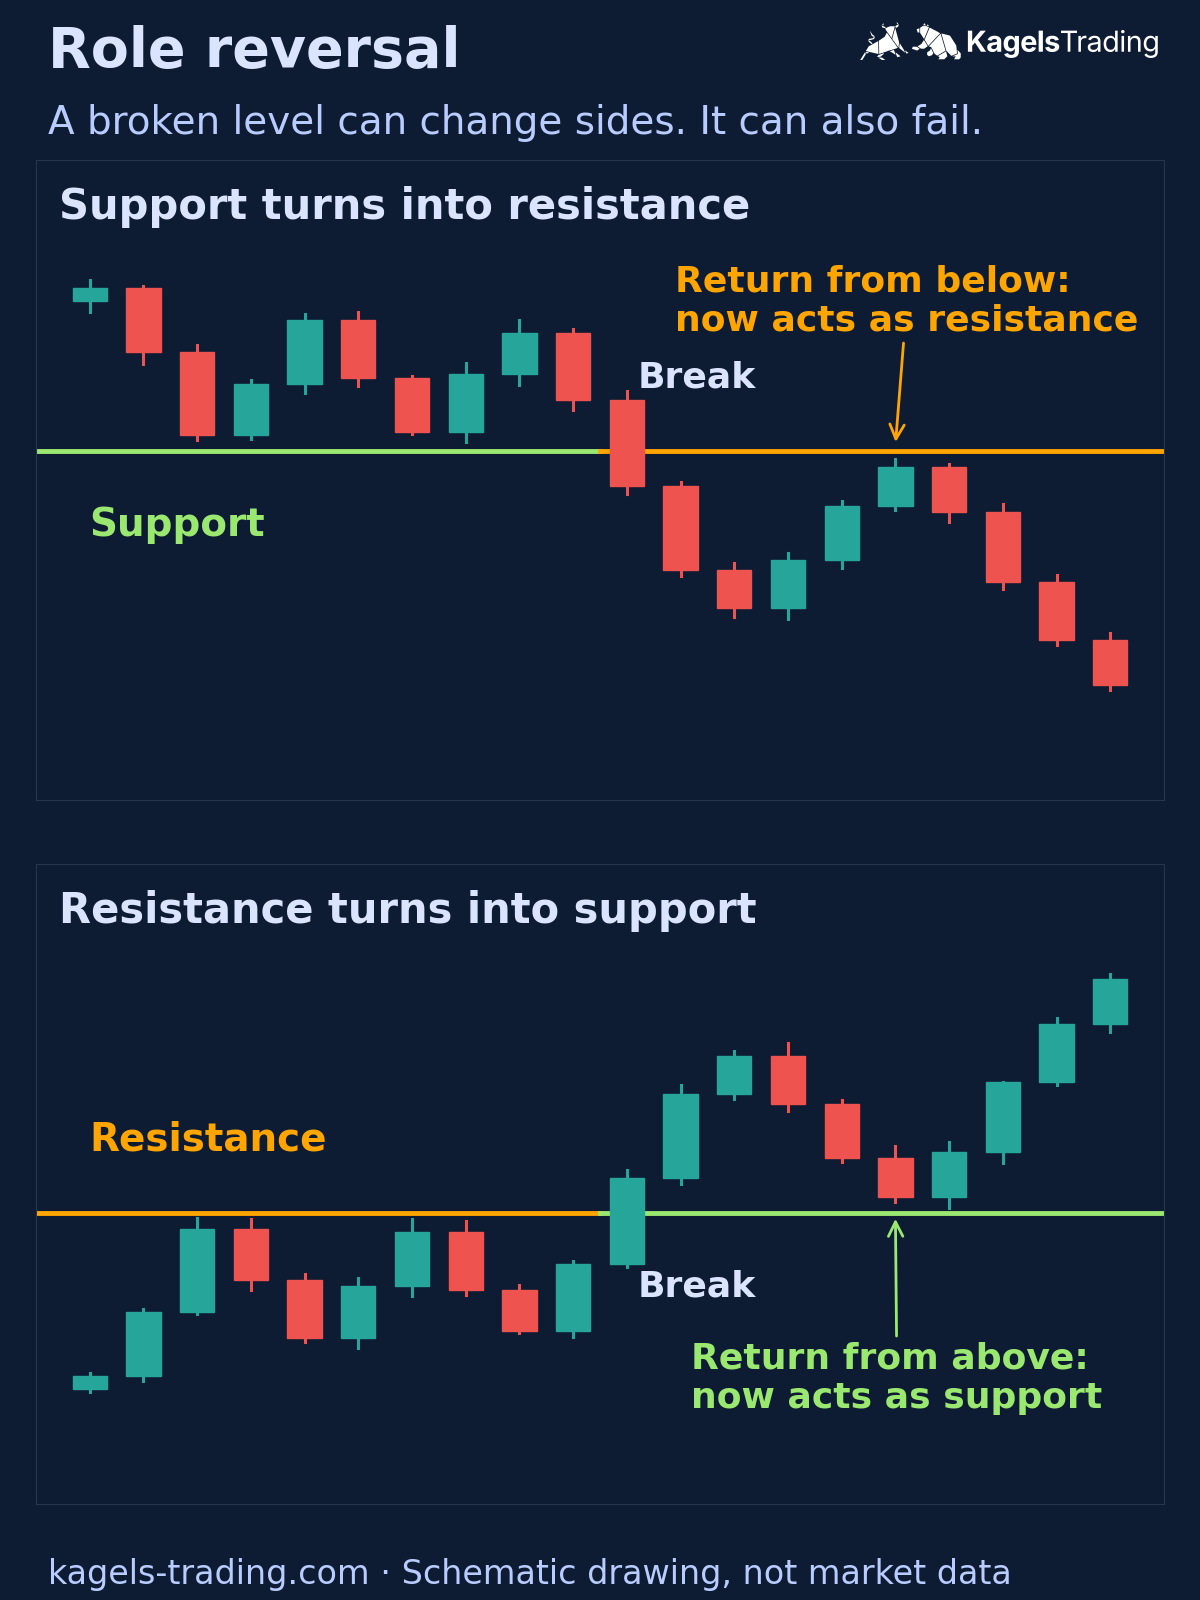
Role reversal is the most useful single idea in this concept. When price breaks below support and later rallies back to it from below, the old support may act as resistance. When price breaks above resistance and later returns from above, it may act as support. The CME describes the same potential reversal, not a guaranteed one. Our guide to swing trading uses role reversal as one of four setups.
 Click to enlarge
Source: Kagels Trading, own drawing.
The practical value is a second, calmer look. You do not have to chase the breakout. You wait until price returns to the broken level and check how it behaves there. The two historical examples below show two very different outcomes.
How to draw support and resistance
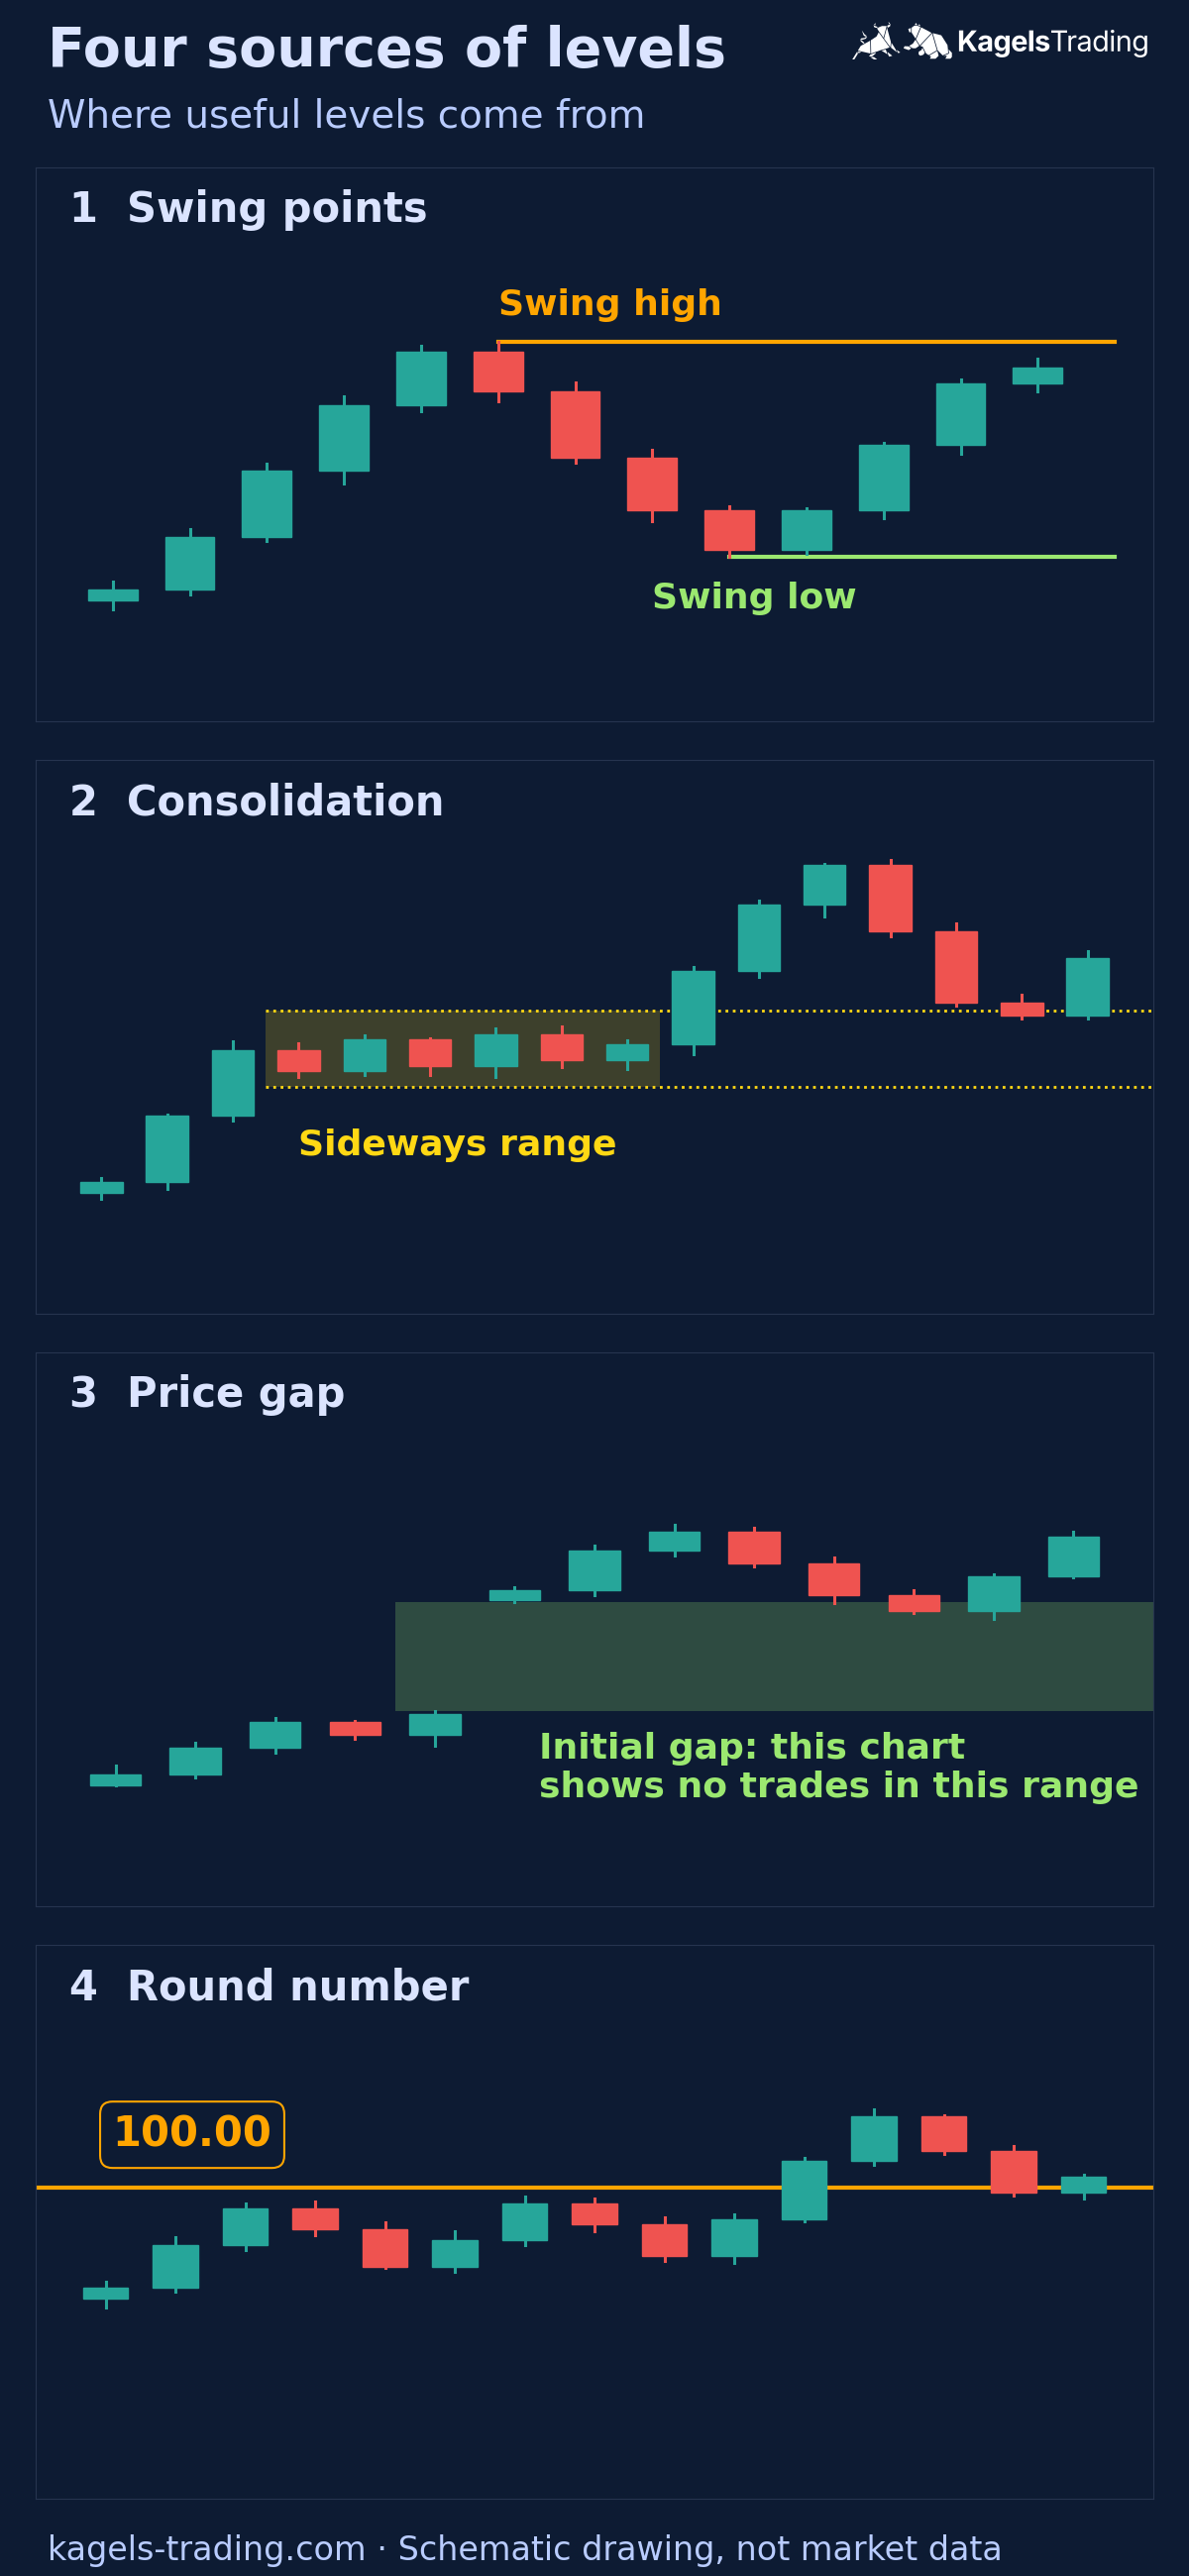
If you allow only four sources for your levels, the chart stays readable. I work with swing points, consolidations, gaps and round numbers, first on the higher time frame, then on the lower one. A line through two swing points on a slope is a trendline, which has its own guide to trendline trading.
 Click to enlarge
Source: Kagels Trading, own drawing.
Swing highs and swing lows
A swing high is a bar whose high is above the highs of the bars on both sides. A swing low is the mirror image. I only take swings that are visible on the higher time frame: a turn on the weekly chart counts, a twitch on the five-minute chart does not.
A swing point only becomes known after the bars to its right have formed. If your rule needs five lower highs on each side, the swing high is confirmed five bars later. Mark that confirmation delay, and never judge an example with bars that were not yet visible at the time.
Consolidations
A consolidation is a phase in which the market moves sideways for some time. Positions are built there over days or weeks, and the whole sideways range becomes the zone. I give repeated consolidations at the same prices more attention, but that does not quantify the chance that the next test will hold.
Price gaps
A gap appears when a chart jumps over a price range between two bars. On a daily chart of a stock or ETF, the gap often reflects trading outside the regular session that the chart does not show, and futures or currencies may have traded through those prices. A gap tells you something about the instrument, feed and session you are looking at. Because many chart users see the same empty space, the gap area often gets attention when price returns. How often SPY gaps actually filled, and how to trade them, is in the gap trading guide.
Round numbers
Round numbers attract attention because people think in round numbers. Carol Osler of the Federal Reserve Bank of New York studied the support and resistance levels six firms published from January 1996 to March 1998 for the German mark, Japanese yen and British pound. In her 2000 study (Table 4, page 57), 70.1 percent of the levels ended in 0 and 95.5 percent in 0 or 5, against 10 and 20 percent for random digits.
Those figures measure how levels were chosen, not how often price bounced. Osler also found that intraday trends in her sample stopped at the published levels more often than at arbitrary ones. That is a result for those firms and years, not proof that a plan built on levels is profitable after costs. For your chart it means one step: mark the round numbers around the current price.
Using volume as a supporting filter
Volume can help you choose which zone to study. An unusually high-volume bar records more units traded during that period, so its range can be a candidate area. Bar volume does not show where within the range most trading occurred, and it does not count participants.
Check what kind of volume your chart shows. Stocks and ETFs show volume from your data feed, often consolidated across venues; exchange-traded futures show exchange volume. Spot forex and many CFDs show tick volume, which counts feed updates, not contracts. Set your threshold for “unusual” before you look at an example. Our VWAP guide shows a related way of weighting prices by traded volume.
Calculated levels: moving averages, Fibonacci and pivots
Calculated levels come from a formula, so they move when the inputs move. Traders who use the same formula, anchor points, data and session get the same lines; change any input and the lines change. No calculated level guarantees a reaction.
| Method | Where it comes from | Watch out for |
|---|---|---|
| Moving average (for example 50 or 200-day) | Average of past closes | Runs through the middle of sideways markets |
| Fibonacci retracement | 38.2% and 61.8% of a finished swing, plus the common 50% line | 50% is not a Fibonacci ratio; the result depends on the swing you pick |
| Daily pivot points | Prior day’s high, low and close, standard formula | Several levels every day, even when only two matter |
Calculated levels add most where they meet a drawn zone. A 200-day moving average is widely watched, and a Fibonacci line inside a consolidation makes that area more interesting. On its own, neither is enough for me to take a trade. Pivot points from the daily standard formula change once per session.
My level map: how I build a chart
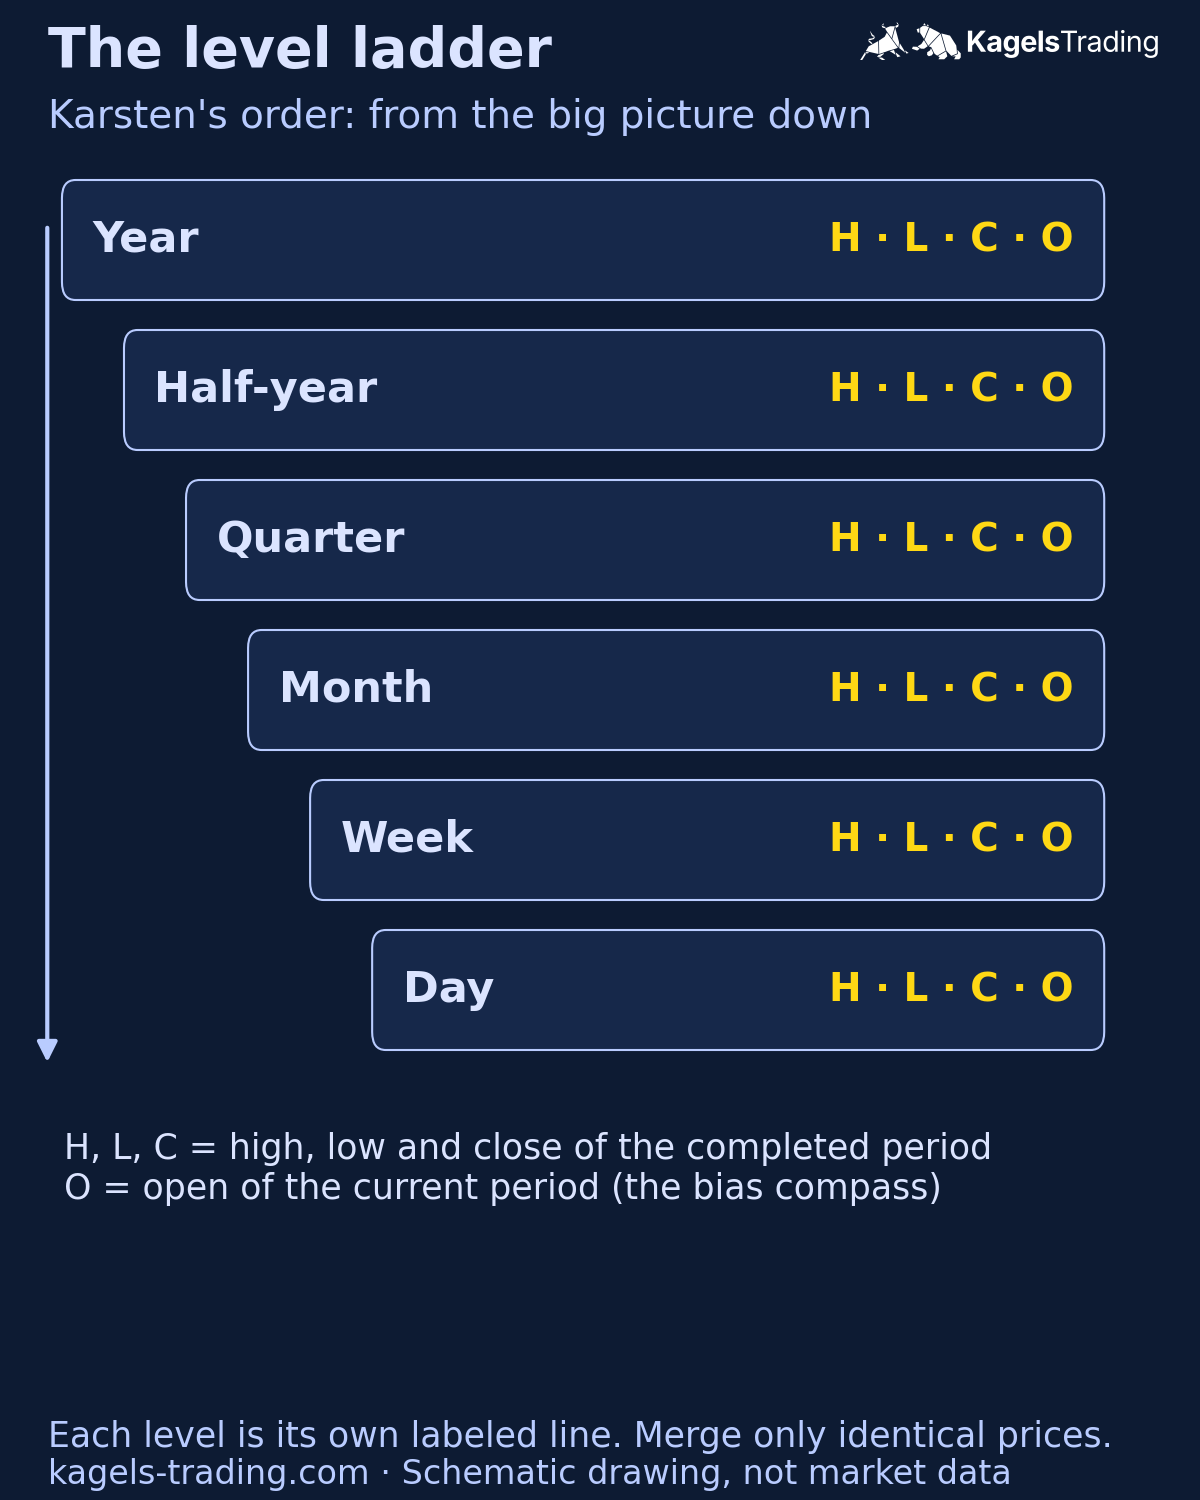
In practice you need a fixed order, or the chart fills up again. I work from the higher time frame down: year, half-year, quarter, month, week and day. On each rung I note the high, low and close of the completed period and the open of the current period, and I label every line with its origin, for example “July 2026 low 1.1353”.
 Click to enlarge
Source: Kagels Trading, own drawing.
The opens are my compass for the bias. If the market trades above the weekly open and the monthly open, my directional bias is bullish. If it slips below both, the bias turns. Before any session I also fix the instrument, feed and session: a cash index, a future, an ETF and a CFD show different prices, so I never mix their levels on one chart.
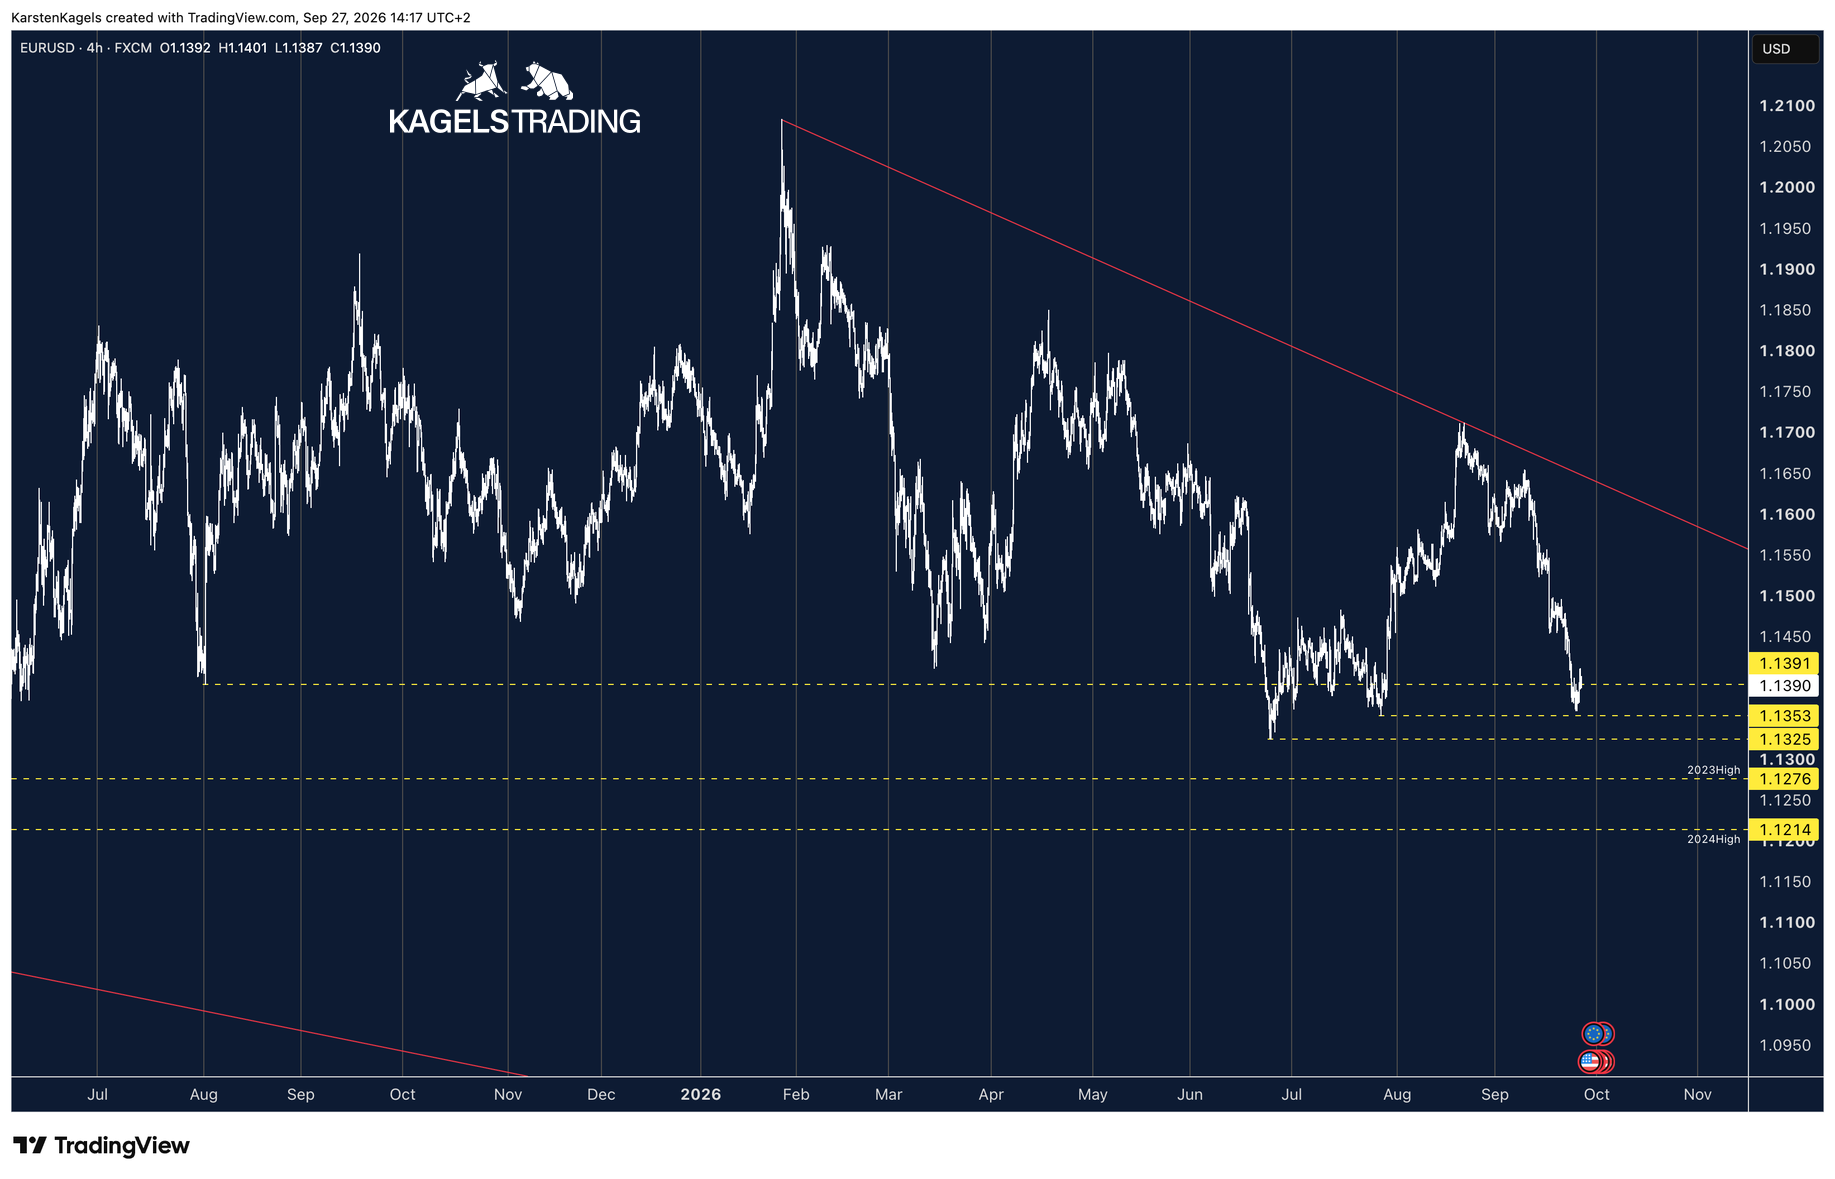 Click to enlarge
- 1 August 2025 low at 1.1391. The line starts at that low.
- 2 July 2026 low at 1.1353 and June 2026 low at 1.1325: two separate lines inside one support area.
- 3 The 2023 high at 1.1276 and the 2024 high at 1.1214, the next reference prices below.
Source: Karsten Kagels, EUR/USD forecast.
Keep nearby levels separate
A common mistake is merging nearby levels into one wide zone. On the EUR/USD chart above, the August 2025 low at 1.1391, the July 2026 low at 1.1353 and the June 2026 low at 1.1325 lie close together and form one support area. They are still three different reasons for a reaction, so I draw and label each one.
Separate lines tell you what is left when the first one breaks. If price falls through 1.1391, you know at once that 1.1353 and 1.1325 are still below, and after them the 2023 high at 1.1276 and the 2024 high at 1.1214. I only combine levels with an identical value, for example a monthly and quarterly open at the same price. You can follow this map on the current EUR/USD forecast.
There is no optimal number of lines and no correct zone width. Both depend on the market, the time frame and the volatility. Levels far from price go into a note, not onto the screen, and the test is simple: can you explain every line in one sentence?
From a level to a trade plan
A finished level map is not yet a strategy. It shows where something may happen, not when to act. The translation into a trade takes five steps.
- ChartContextHigher time frame direction and the nearest levels above and below.
- [Price action](/blog/price-action-trading/)TriggerAn observable signal at the zone, for example a quick break and return.
- Your planInvalidationThe price that proves the idea wrong. The stop goes there, planned before entry.
- Your accountSizeChoose the [position size](/blog/position-sizing/) so that the planned loss at the stop fits your risk budget.
- ChartTargetThe next opposite level, or a reason to skip the trade.
A planning diagram, not a trading signal. A stop order can be filled at a worse price than planned when the market gaps or moves fast.
Direction, trigger and the reason to skip
Levels show the trend without an indicator. If supports hold and resistances break one after the other, the market is in an uptrend, and I look for long trades at support. Nearby resistance can limit the potential reward, so compare the target distance with the planned stop distance before you take the trade.
The zone is the place; the trigger is the permission. Two signals count for me: a quick break below the zone followed by an immediate return, and the break of a small structure followed by a retest. Nearness to a zone is not a trigger, and a false breakout can trigger your stop and leave you out of the move that follows.
Stop: first the place, then the size
When I went back through my own trades at levels, the place of the stop mattered most. A common mistake is forcing the stop to fit a chosen position size, which puts it inside the zone where normal noise hits it. I first find the price beyond the zone where the idea is clearly wrong, plus a small buffer. Then I reduce the position size until the planned loss at that stop fits my risk budget, allowing for costs and possible slippage.
Many traders place their stops just beyond obvious highs and lows. A chart does not show where those stop orders really sit or who placed them. A brief move through a level can trigger some of them and reverse, or keep going. Plan the stop before entry and never widen it after the trade is open; a wider stop changes your risk per share, not the certainty of the trade. The Smart Money Concepts build their order blocks on such stop runs, and our SPY count there shows how often the zone still failed.
Exits follow the same logic in reverse. A long target sits just below the next resistance, a short target just above the next support. For day traders, the previous day’s high and low are widely watched reference levels.
SPY: a retest, a breach and a recovery
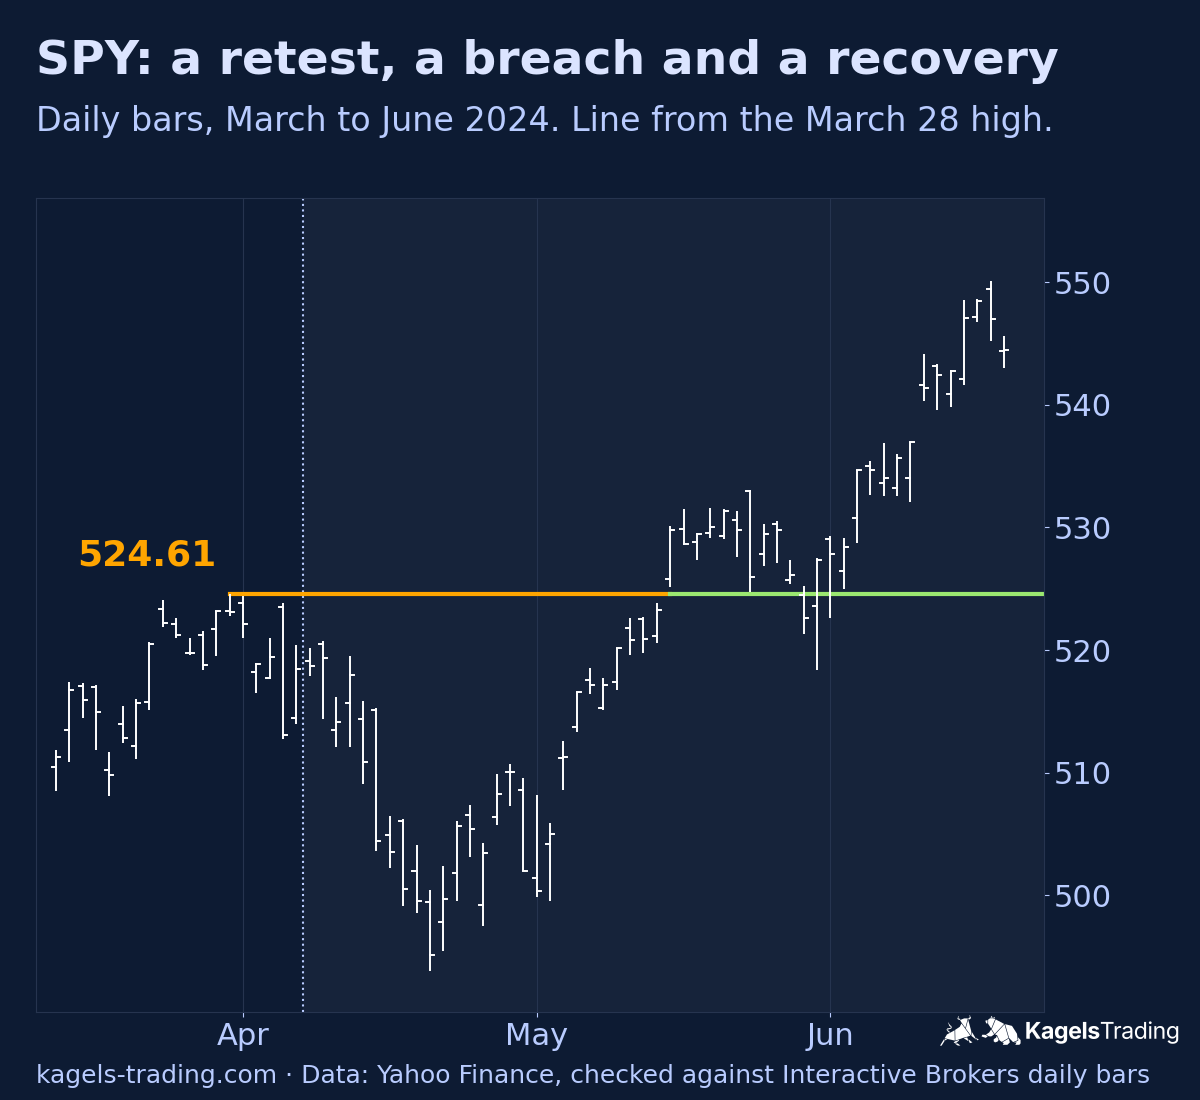 Click to enlarge
- 1 May 15: first close above 524.61, at 529.78.
- 2 May 23: retest with a low of 524.72 and a close of 525.96.
- 3 May 30 closed at 522.61, below the line; May 31 traded down to 518.36 and closed at 527.37.
The March 28, 2024 high in SPY at 524.61 shows a messy retest. The level was confirmed on April 5, after five lower highs. SPY fell below 495 in April, closed above the level on May 15 at 529.78 and retested it on May 23 with a low of 524.72. On May 30 it closed at 522.61, below the line, traded down to 518.36 the next day and closed at 527.37. By June 14 the close was 542.78.
This example shows why the reference level alone cannot determine a trade’s outcome. A wider stop increases the loss per share. A smaller position can keep the planned dollar risk unchanged, although a gap or slippage can increase the actual loss.
GLD: a break followed by a deeper decline
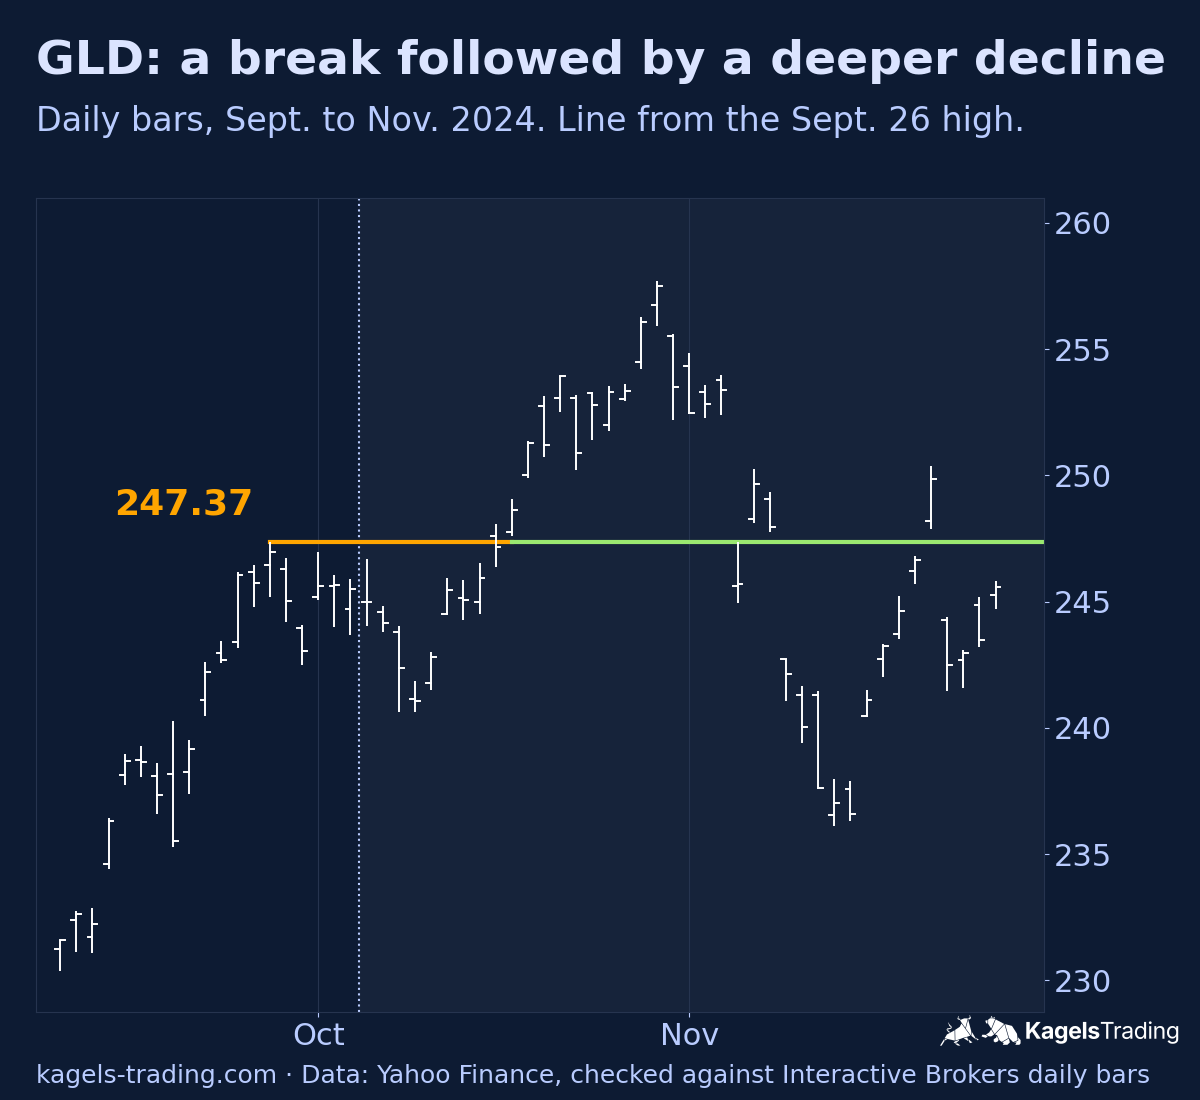 Click to enlarge
- 1 October 17: first close above 247.37, at 248.63.
- 2 November 6: gap down, close at 245.70. November 7 and 8 closed above the line again.
- 3 November 11 fell back below; November 15 closed at 236.59.
The September 26, 2024 high in GLD at 247.37 looked like a similar setup. It was confirmed on October 3, and the first close above it came on October 17 at 248.63. GLD rose to 257.71 on October 30. On November 6 it opened with a gap down and closed at 245.70, below the old resistance.
The brief recovery did not last. GLD closed above 247.37 on November 7 and 8, then fell back below it on November 11. By November 15 it closed at 236.59. These examples describe price paths, not completed trading strategies. Whether a trade won or lost depends on rules fixed before entry, and you can practice such rules with TradingView’s replay mode or paper trading.
Strengths, limitations and common mistakes
- Works across markets: stocks, futures, forex and commodities all have supply and demand, so the idea transfers. The usefulness still needs testing per market.
- Studied in research, with limits: Osler found intraday trend interruptions at published currency levels more often than at arbitrary prices, with large differences between firms, and the firms’ own strength ratings were not reliable.
- Hindsight and overfitting: on a finished chart every good level looks obvious. Freeze your levels before you look at what came next. How hindsight inflates a test is shown in our backtesting guide.
- Delays, feeds and false breaks: a swing point is known only after later bars; cash, futures and CFD charts differ; a level can break briefly and recover, or break and keep going.
- Unclear rules: if you cannot say how a zone was drawn and what would invalidate it, you cannot test it.
Conclusion: a map, not a signal
Support and resistance give you a map of the market before you open a position. The trigger, the stop, the position size and the target turn that map into a plan. No level is guaranteed to hold, some are never tested again, so plan the loss you can accept if the level fails, and keep leveraged products away from your first trades. This is educational content, not investment advice.
Frequently asked questions about support and resistance
How do you draw support and resistance?
Start on the weekly or daily chart and mark only turning points visible there. Draw a zone with a written rule, add the round numbers near the current price and label every level with its origin.
Should I use wicks or closes for support and resistance?
The choice is a method, not a truth. Closes are steadier; wicks show how far the bar reached. I use the zone between the extreme body edge and the extreme wick, and I apply it the same way every time.
How many touches make a valid level?
A prior swing can provide a candidate level. Further reactions may reinforce its relevance, but they do not guarantee that it will hold, and a level tested many times can also break.
What is role reversal in support and resistance?
Role reversal means a broken level may change sides. Broken support may act as resistance on a return from below, and broken resistance may act as support on a return from above.
Which time frame is best for support and resistance?
Start with the highest time frame you care about and work down. Yearly, quarterly, monthly and weekly levels set the frame; daily and intraday levels add the detail.
Why do support and resistance levels fail?
Levels fail when the balance of buyers and sellers changes. News, a shift in the bigger trend or more orders on the other side can push through any level, and a gap can jump over a stop.
Do you need an indicator for support and resistance?
No, the key levels come from price itself. Moving averages, Fibonacci retracements and pivot points can add context where they meet a drawn zone, but they do not replace a stated rule.
This article was written by Karsten Kagels, a discretionary price action trader. The German edition was reviewed by Christian Möhrer. The SPY and GLD examples are historical charts built from Yahoo Finance data and checked against Interactive Brokers daily bars; they are selected to explain the method, are not trades I executed and are not a statistic. This is educational content, not investment advice.
This US edition is based on our German edition on kagels-trading.de and has been adapted for US readers.
More Chart Techniques guides
- Read price action
Price Action Trading: How to Read Charts Without Indicators
Market structure, key zones and three bar patterns, with a core setup and a real SPY example where the signal failed.
- Trade breakouts
Breakout Trading Strategy: Entries and False Breakouts
How often breakouts fell back into the range in our count of 1,472, and how to plan entry, stop and position size.
- Draw and trade trendlines
Trendline Trading: How to Draw Trendlines and Trade Them
How to draw trendlines with a fixed rule, four strategies for bounces, breaks and retests, and a real SPY line break without a lasting reversal.
- Use Fibonacci levels
Fibonacci Retracement Levels: How to Draw and Trade Them
How to calculate and draw retracement levels, trade pullbacks with confluence and a stop at the structure, and what a ten-year test says about the levels.
- Set Fibonacci targets
Fibonacci Extension: Levels, How to Draw It and Calculator
Three-point extension targets from the end of a pullback, why they differ from levels beyond 100%, a free calculator and three SPY swings, one without a single target reached.
- Trade gaps
Gap Trading Strategy: How to Trade Gaps and When Gaps Fill
Opening and full gaps, the four classic gap types, how often SPY gaps filled in our count since 2001, and plans for gap fill and gap and go.
- Calculate pivot points
Pivot Points: Formulas, Types and How to Trade Them
Formulas for standard, Fibonacci, Woodie, Camarilla and DeMark pivots, a free calculator, which session counts and a real SPY day.
- Swing trade
Swing Trading: 4 Strategies, Risk and Real Examples
Four swing trading strategies on the daily chart, position size, gap risk and US rules, with two hypothetical SPY pullbacks: one hit its target, one was stopped out.
- Identify market stages
Stage Analysis: Stan Weinstein's Four Market Stages
Stan Weinstein's four stages on the weekly chart, a Stage 2 checklist and two TSMC breakouts: one ran for a year, one gapped through its stop.
- Read Wyckoff ranges
Wyckoff Method: Accumulation, Distribution and Springs
Accumulation and distribution with phases A to E, springs and upthrusts as optional tests, and two real TSMC ranges read with and without hindsight.
- Trade Darvas boxes
Darvas Box Strategy: Rules, Entries and Stop Losses
The box rules step by step, when the edges become known, where the stop goes, and a mechanical test on TSMC in 2024 with two honest results.
- Count Elliott waves
Elliott Wave Theory: Rules, Patterns and Fibonacci
The five-wave pattern, three hard rules, zigzags, flats and triangles, Fibonacci ratios and a real DAX count, from the first German translator of the standard work.
- Trade order blocks
Order Blocks: How to Spot, Draw and Trade the Zone
The three conditions behind a valid order block, entry and stop at the zone, two SPY cases from 2026 and a 25-year count where a fixed rule lost money.
- Interpret volume
Volume Analysis in Trading: How to Read Volume Honestly
What volume counts in stocks, futures, forex and crypto, how to read it against its own average, and our SPY test of high-volume days since 2001.