
Break of Structure (BOS): Rules, CHoCH vs MSS and a Test


Contents
- Break of structure in 30 seconds
- What is a break of structure?
- Bullish and bearish BOS
- Which swing counts: write the rule down
- BOS, CHoCH and MSS: the convention this guide uses
- Real break or false breakout?
- What a BOS does in numbers: our test
- How to use a BOS in a trade plan
- BOS with indicators
- Pros and cons of trading the BOS
- Common BOS mistakes
- Conclusion: a filter, not an entry signal
- Frequently asked questions about the break of structure
- About the author
The break of structure, or BOS, is one of the most used terms in Smart Money Concepts. It means a break: price gets past an obvious high or low and closes beyond it. That confirms the direction the market was already moving in. It does not turn anything.
Many explanations go wrong right here. A BOS is not a reversal. For the first break against the trend there is another term, the change of character (CHoCH), and some teachers add a third, the market structure shift (MSS). This guide defines all three under one stated convention, shows one SPY break that worked and one that failed, and tests a fixed BOS rule against comparison days over 25 years. This article follows our editorial policy.
Break of structure in 30 seconds
- Definition: a BOS is a close beyond a prior confirmed swing high or swing low in the direction of the trend.
- Difference: BOS means continuation. CHoCH means the first break against the trend, a possible turn. MSS is used in different ways; in ICT teaching it often marks a break after a liquidity sweep, with a fast move.
- Which swing: write down a fixed rule. Ours: a high above the three bars before and after it, usable only after those three bars have closed.
- Our test: on SPY and QQQ since 2001, bullish breaks reached a 1R target about as often as comparison days with the same stop on SPY, and more often on QQQ. The label is a filter, not an entry signal.
What is a break of structure?
A break of structure (BOS) is a close beyond a prior confirmed swing high or swing low in the direction of the existing trend, which confirms that the current move continues.
The term comes from Smart Money Concepts. In the SMC reading, large traders need counterparties and find them where many stops and pending orders rest, above obvious highs and below obvious lows. That is a hypothesis. What you can see on a chart is simpler: above a prior high, triggered buy stops add buying; below a prior low, triggered sell stops add selling. The chart does not show who traded.
In practice, a BOS is bookkeeping about market structure. It answers one question: has the market cleared its last relevant level or not? If price closes above the prior swing high in an uptrend, the structure is intact. If it closes below the prior swing low in a downtrend, the same is true the other way round. Nothing more is implied about the next trade.
A wick alone is not enough. Price must close beyond the level. A brief push through it that is reversed within the same bar is not a break. It is closer to the opposite, a liquidity sweep, where price runs past a level and closes back inside. The difference between the two is decided by the close, and you only know it when the bar has finished.
The idea is much older than the English label. The Wyckoff method described a market leaving its trading range a century ago, and classic breakout trading works with the same event. BOS is a modern name for it, not a new discovery.
Bullish and bearish BOS
Market structure has two states, and the BOS looks the same in both, only mirrored. What matters is which level breaks: a high or a low.
In an uptrend, price forms higher highs (HH) and higher lows (HL). Each push exceeds the prior high, and each pullback ends above the prior low. A bullish BOS occurs when a bar closes above the last confirmed swing high. In a downtrend it works the other way: lower lows (LL) and lower highs (LH), and a bearish BOS occurs when a bar closes below the last confirmed swing low.
One detail is often skipped: the first high after a low is not yet a higher high. It only becomes one when price later exceeds the previous high. If you name the points too early, you see a structure the market has not confirmed. On a chart you look at after the fact, every swing looks obvious; in real time, a swing only exists once enough later bars have closed.
Which swing counts: write the rule down
Before you can judge a break, you need the points that are being broken. This is where most of the damage happens. If every small bump counts as structure, every chart shows a dozen breaks and not one useful one.
Our rule is simple and arbitrary, but checkable. A bar is a swing high if its high is above the highs of the three bars before it and the three bars after it. A swing low is the mirror image. Because the rule needs three later bars, a swing becomes usable only after the third bar after it has closed. Drawing swings by eye later is easier and looks cleaner, but it uses information you did not have at the time, which is called look-ahead.
The second variable is the timeframe. Market structure repeats on every timeframe: what looks like a harmless pullback on a daily chart contains several clean breaks on a 4-hour chart. A break on a daily chart describes a shift that can last weeks; a break on a 5-minute chart may be over in an hour. Decide the direction one or two timeframes higher than your entry, as our guide to multi-timeframe analysis explains, so the small structure confirms the large one instead of replacing it.
BOS, CHoCH and MSS: the convention this guide uses
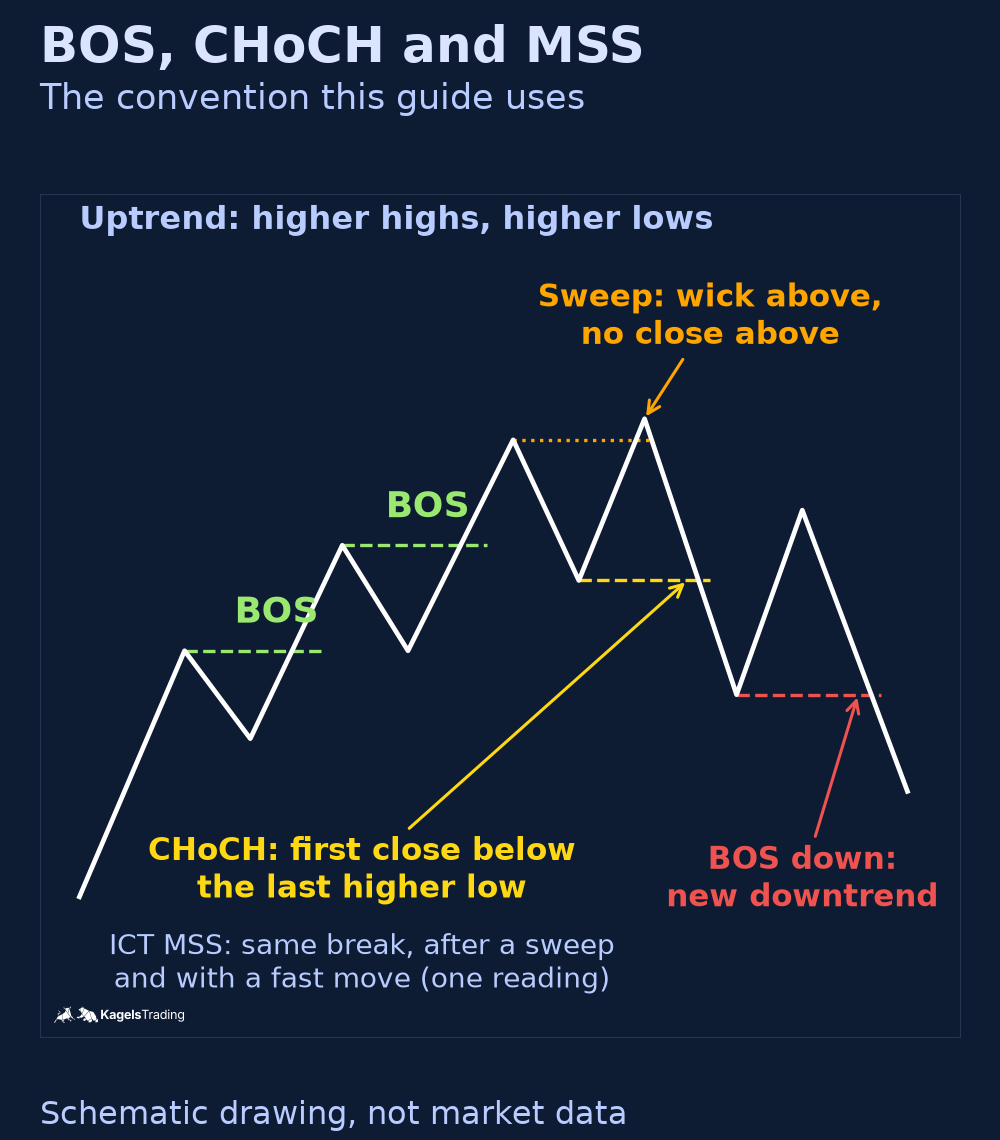
All three labels describe a break of a prior swing, and the teaching is not uniform. This guide uses one stated convention, shown in the drawing. Where other teachers differ, the table says so. Read it as a set of definitions for this page, not as the only correct reading.
 Click to enlarge
Source: Kagels Trading, own drawing.
| Label | Our definition | Common variations |
|---|---|---|
| BOS | A close beyond the last confirmed swing in the trend direction | Wick or close; which swing size counts |
| CHoCH | The first close beyond the last confirmed swing against the trend; in an uptrend, below the last higher low | An early warning, or already a reversal |
| MSS | Not used as a separate rule here; see the text | In ICT’s 2022 lessons, a break of a short-term swing after a liquidity run, with a fair value gap; elsewhere a synonym for CHoCH |
We treat a CHoCH as a warning, not as a confirmed turn. In an uptrend, the first close below the last higher low ends the chain of rising lows. The market behaves differently than before, hence the name. Whether a downtrend follows is only answered later. Under our convention, the turn is confirmed when price then makes a lower high and a BOS down, a close below the next swing low. Our guide to the change of character shows how often that happened after a CHoCH on SPY and QQQ.
MSS is where sources disagree most. In the Inner Circle Trader’s free 2022 mentorship, a market structure shift is a break of a short-term swing after price has run an old high or low, and the setup only counts if the move leaves a fair value gap. Our ICT trading guide describes that model. Other teachers use MSS as another word for CHoCH, and some put MSS before CHoCH while others put it after, as the SMC guide linked above documents with sources. Before you trade a label, check which definition the source uses. Our guide to the market structure shift defines MSS for our pages as a CHoCH with a prior sweep and a fair value gap.
Real break or false breakout?
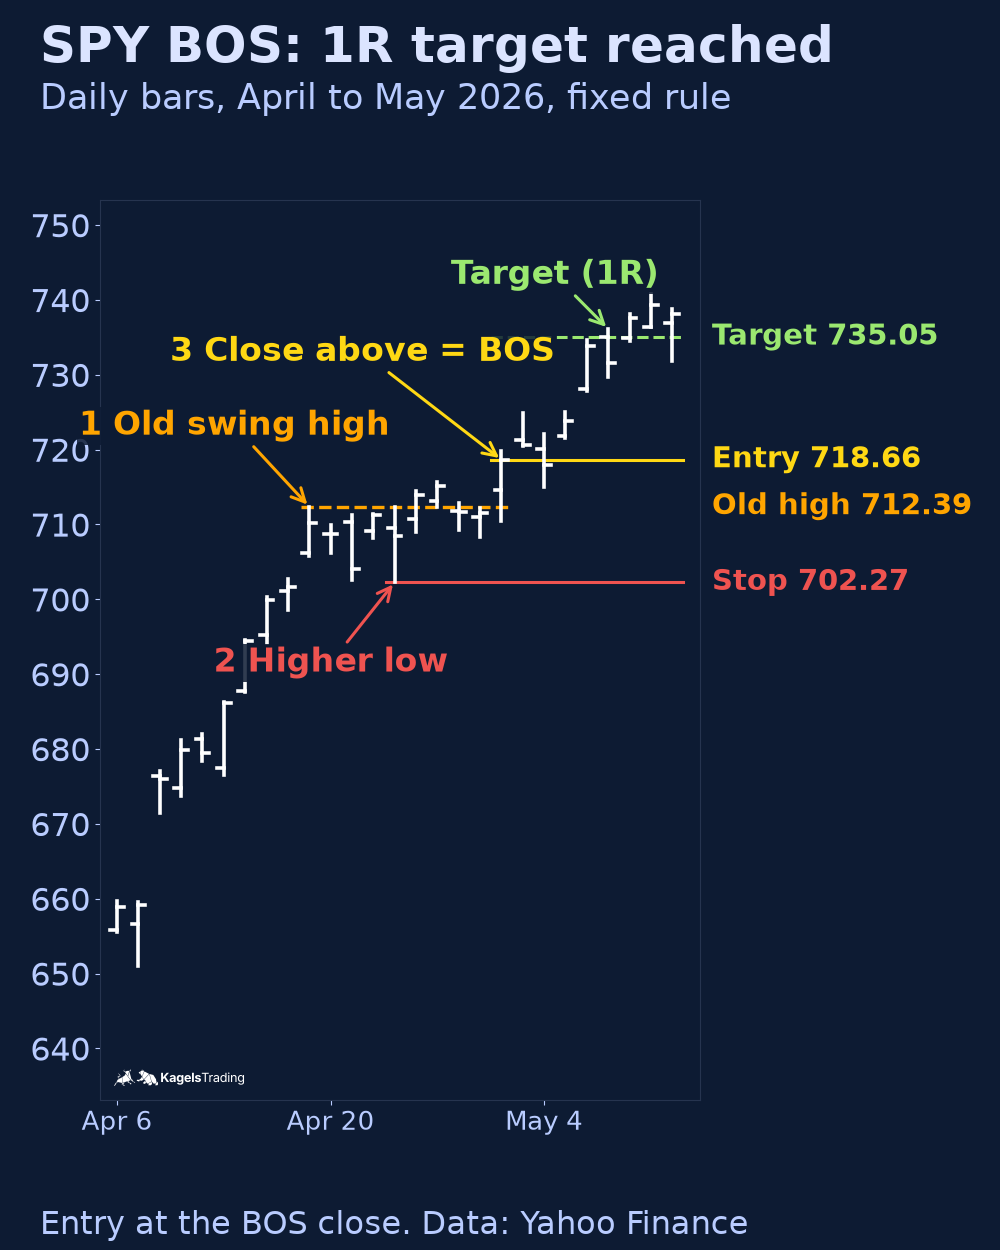
You cannot tell at the moment of the break, and any source that says otherwise sells a certainty that does not exist. Two SPY breaks from 2026 show it. Both met the same rule equally well, and they ended in opposite ways. We picked them by a fixed rule: the last bullish break that reached its 1R target and the last one that hit its stop, in a sample ending October 16, 2026.
The break held: SPY in April 2026
- Old swing high: 712.39 on April 17.
- Higher low: 702.28 on April 23, above the previous swing low, so the uptrend was intact.
- BOS: on April 30, SPY closed at 718.66, above the old high. Under the rule, the entry is that close, with a stop one cent below the higher low at 702.27.
- Target: 1R, the same distance as the risk, at 735.05. SPY opened at that price on May 7.
 Click to enlarge
The stop was wide, about 2.3% of the price, because the last higher low sat far below the break. That is typical for this rule. A stop at the point where the structure fails is logical, but it is often far from the entry. The trade still reached its target within five sessions, and nothing in the bars says why it worked or who was buying.
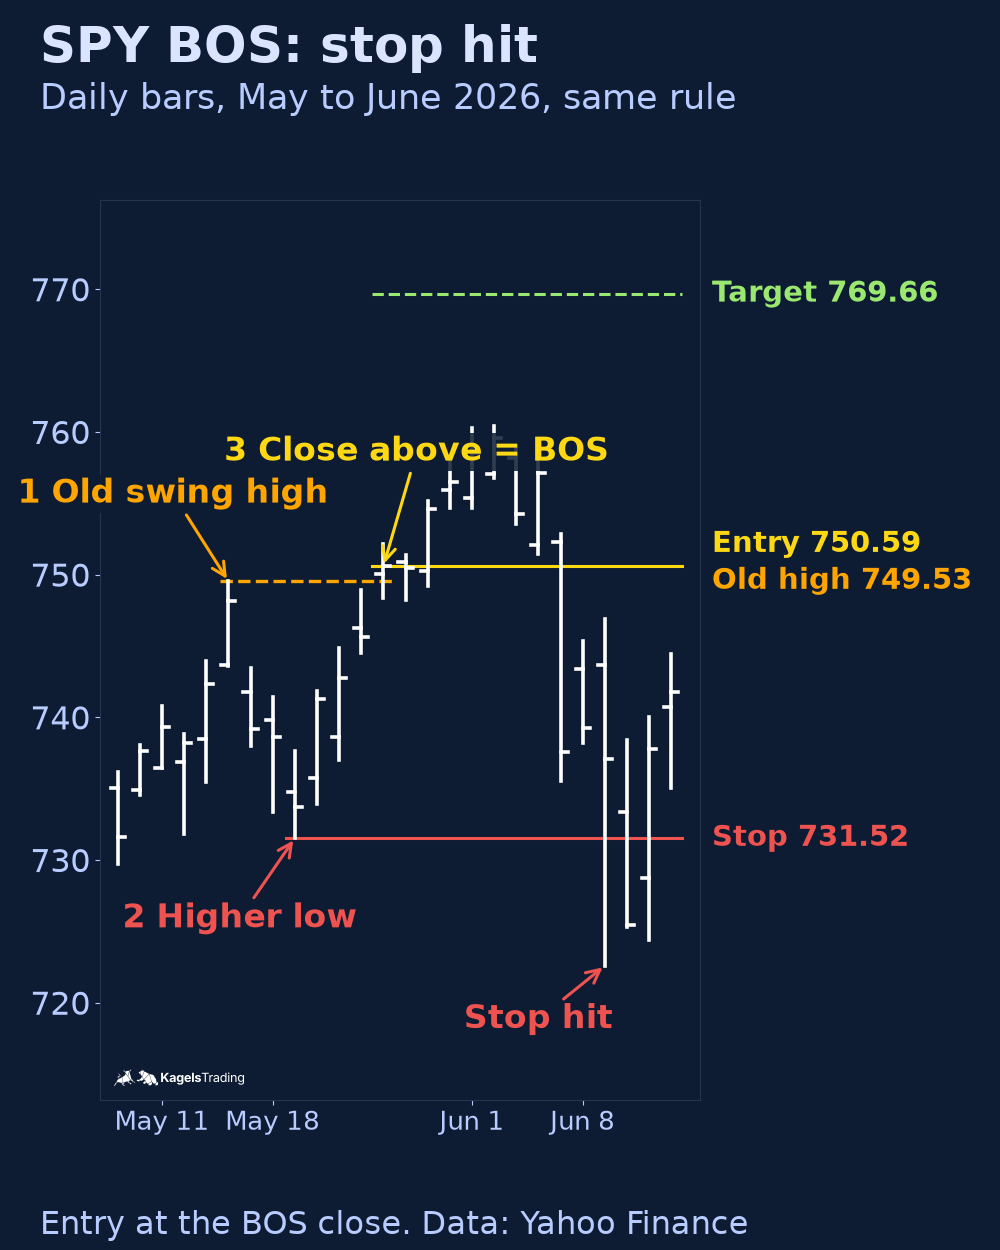
The break failed: SPY in May 2026
The last stop-out came only weeks later. SPY set a swing high of 749.53 on May 14 and a higher low of 731.53 on May 19. On May 26 it closed at 750.59, a clean BOS. The stop sat at 731.52, the 1R target at 769.66.
 Click to enlarge
Price rose to about 760, turned and hit the stop on June 9, with a low of 722.59. Our Smart Money Concepts guide uses the very same break as an example that held: there, a buy at an order block near 748.94 with a much tighter stop reached its target on May 29. The structure was identical. Only the entry and the stop differed, and that decided the outcome. A BOS tells you about structure; the trade plan around it decides the result.
What a BOS does in numbers: our test
A lot is claimed about the break of structure and little is counted. The German version of this page reports a test of 322 bullish breaks in four markets, but we could not find its script and data, so we cannot check how the swings were timed. We do not reuse those numbers. Instead we ran our own test with the rule above.
- Data: SPY and QQQ daily bars from January 2, 2001 to October 16, 2026, from Yahoo Finance, adjusted for splits, not for dividends.
- Swings and trend: three bars on each side; a swing is usable only after the third bar after it has closed. Uptrend means the last two confirmed swing highs and the last two confirmed swing lows are rising.
- Signal: the first close above the last confirmed swing high in an uptrend (bearish: the mirror image).
- Entry and stop: at the signal close, an idealization, because the signal is known only at that close. Stop one cent beyond the last swing on the other side.
- Outcome: did price reach 1R (or, separately, 2R) before the stop, within 60 bars? Opens beyond a level count at the open; stop and target in one bar count as the stop. A signal counts only if all 60 later bars exist in the data. Cases that reach neither level within 60 bars count as “target not reached”, not as losses. No fees, no slippage.
- Base rate: the same rule, with the same stop distance in percent, applied to every eligible comparison day of the same ETF from January 4, 2002 to July 22, 2026, except the signal’s own day. Other BOS days are included. It answers whether a BOS day does better than the average comparison day with the same risk.
| ETF and direction | Signals | 1R first | Stop first | Neither | 1R first, approx. range | Comparison days, 1R first |
|---|---|---|---|---|---|---|
| SPY, bullish BOS | 135 | 70 (51.9%) | 58 | 7 | 43.4% to 60.3% | 49.9% |
| QQQ, bullish BOS | 129 | 80 (62.0%) | 40 | 9 | 53.6% to 70.4% | 52.4% |
| SPY, bearish BOS | 57 | 24 (42.1%) | 31 | 2 | 29.3% to 54.9% | 29.9% |
| QQQ, bearish BOS | 49 | 23 (46.9%) | 19 | 7 | 33.0% to 60.9% | 26.3% |
On SPY, bullish breaks were barely better than the comparison days. 51.9% reached the 1R target first, against 49.9% on the comparison days with the same stop distance, and the approximate range of the signal rate easily covers that difference. On QQQ, bullish breaks reached the target more often, 62.0% against 52.4%, and here the range stays above the base rate.
Bearish breaks reached the target first more often than the comparison days. In two rising markets, a short with a wide stop rarely reaches its target, so the base rate is low: 29.9% on SPY and 26.3% on QQQ. After a bearish BOS it was 42.1% and 46.9%. These are target-first frequencies, not profits: on SPY the stop came first more often than the target, on QQQ the target did, and some cases reached neither within 60 bars. Turning them into a result per trade would need a complete exit rule, which this test does not have. With the 2R target, bullish SPY breaks did slightly worse than the comparison days, 24.4% against 27.5%.
Read the numbers for what they cover. Eight comparisons on two related ETFs make one good-looking row likely by chance. The ranges are approximate 95% ranges for the signal rate only, from a normal approximation without any adjustment for overlapping 60-bar windows; they are not ranges for the difference from the comparison days, which reuse much of the same history. The test uses one swing definition, one trend rule and an entry at the break close. It says nothing about intraday charts or about pullback entries. What it does show: the label alone did not make a day clearly better than the comparison days on SPY.
How to use a BOS in a trade plan
Entering at the break close often means a wide stop. If the stop belongs below the last higher low, the distance from the break close to that stop can be large, as both SPY examples show. We did not compare entry methods, so this is not a ranking. The label becomes useful once you build a plan around it.
Look for the entry in the pullback
A pullback entry is an alternative with a different trade-off. Possible zones are the broken high itself, which may act as support now, a fair value gap inside the breakout move, or the order block the move started from. Our guide to pullback trading covers the general method. If the order fills, a lower entry shortens the distance to the same stop. But some breaks never pull back, so you miss those trades, and the trades you do get are a different sample. Whether that improves the overall result is a question for your own test.
Put the stop where the structure fails
In an uptrend, the stop belongs below the last higher low. If price falls below it, the upward structure is broken and the idea behind the trade no longer holds. The stop is then not at an arbitrary number but exactly where the assumption fails. Size the position from that distance, as our guide to position sizing shows, because a structural stop can be wide.
Take the target from the chart
Natural targets are the next obvious high, an open gap above, or an area where the market turned before. What does not work is working backward from a desired reward-to-risk ratio. The market does not know your ratio. Our April example reached 1R within five sessions but needed until May 26 to reach 2R, so where you take partial profits often matters as much as the entry rule.
BOS with indicators
Market structure needs no indicator, only highs and lows. If you want a second opinion, know what each tool can and cannot add.
Volume is the most natural addition. A break on clearly higher volume has more participation behind it than one in thin trading, as our guide to volume analysis explains. In spot forex there is no central volume, so the chart shows only one provider’s ticks. A 200-day moving average works as a rough direction filter: above it, bullish breaks count more. The price is lag.
A momentum indicator such as the RSI helps less than many expect. It measures speed, not structure, and in strong trends it can stay overbought while the breaks keep coming. The higher timeframe is often the better second opinion: it costs nothing, adds no lag and answers the one question that counts before an entry, whether the break runs with the larger market or against it.
Pros and cons of trading the BOS
The break of structure has real strengths, and weaknesses that many explanations leave out. Weigh both before you make it part of your trading and your rules.
Pros:
- Checkable: whether a close is above a level is a yes-or-no question you can verify later.
- No indicator needed: the pattern needs only highs and lows and works in any charting software.
- A logical stop: the last higher low is a reasoned exit point. If it breaks, the trade idea is wrong.
- Works across timeframes: the same rule applies on daily and 5-minute charts.
Cons:
- No clear edge on its own: on SPY, bullish breaks barely beat the comparison days in our test.
- Depends on the market: QQQ looked better than SPY with the same rule, which you cannot assume elsewhere.
- Swing choice is a judgment: two traders see different breaks on the same chart unless they fix the rule.
- Prone to false breaks: a short push past a high followed by a reversal is a common pattern.
- Invites overtrading: on small timeframes there is almost always a break somewhere.
Common BOS mistakes
Most losses with this pattern do not come from missing the break, but from taking it out of context. These five mistakes come up again and again, and each has a simple fix:
- Trading the break without context: check the higher timeframe first, then the level, not the other way round.
- Confusing CHoCH and BOS: the first break against the trend is a warning, not a confirmed turn. Wait for a break in the new direction if you want confirmation.
- Ignoring the stop distance at the break: an entry at the break close can sit far from the structural stop. Size the position for that distance, or plan a pullback entry and accept that you will miss some trades.
- Ignoring the timeframe: a break on a 1-minute chart says little if the hourly trend points the other way.
- Too many lines: ten marked breaks create noise, not clarity. Keep to the last two or three relevant swings.
Conclusion: a filter, not an entry signal
A break of structure does one thing reliably: it tells you whether a market’s structure is still intact. That is more than many chart patterns deliver, because it can be checked. What it does not deliver is an edge on its own. In our test, bullish breaks on SPY reached their target about as often as the comparison days with the same stop, and QQQ was better without that being transferable.
Use the BOS as one part of a plan. The higher timeframe gives the direction, the break confirms it, the pullback offers the entry and the last higher low the stop. Our two SPY examples show that the same break can win or lose depending on that plan. If you start with it, use one timeframe and one fixed swing rule, and mark structure for a few weeks before you trade it.
This guide is education, not investment advice. Trading futures, options or leveraged products can lose more money than you expect, and past examples do not predict future results. Decide your risk per trade before you enter.
Frequently asked questions about the break of structure
What is a break of structure (BOS)?
A break of structure is a close beyond a prior swing high or swing low that continues the existing structure. In an uptrend it means a new higher high, in a downtrend a new lower low. The break confirms the current direction; it does not turn it.
What is the difference between BOS and CHoCH?
A BOS breaks a level in the trend direction, a CHoCH breaks one against it. In an uptrend, a close above the last swing high is a BOS, and a close below the last higher low is a CHoCH. Under the convention of this guide, a CHoCH is a warning, and the turn is confirmed by a later BOS in the new direction.
What is the difference between BOS and MSS?
A BOS continues the trend, while an MSS, in most uses, marks a break against it. In the Inner Circle Trader’s 2022 lessons, an MSS is a break of a short-term swing after a liquidity run, with a fair value gap. Other teachers use MSS as another name for CHoCH, so check the definition first.
How do I tell a real BOS from a false breakout?
You cannot tell for sure at the moment of the break. Two things help: the bar must close beyond the level, and the break should run in the direction of the higher timeframe. Beyond that, the position size decides how much a false break costs you.
How reliable is a break of structure?
On its own, not very. In our test on SPY daily bars since 2001, bullish breaks reached a 1R target before the stop in 51.9% of cases, against 49.9% on comparison days with the same stop. QQQ did better, at 62.0% against 52.4%. These are target-first frequencies within 60 bars, not profits, and they apply only to the tested rule and ETFs.
Can I trade BOS without indicators?
Yes, the pattern consists only of highs and lows. If you want a second opinion, the higher timeframe is usually more useful than an oscillator, because it adds no lag. Volume can help in stocks and futures, less so in spot forex.
Which timeframe works best for BOS?
The pattern appears on every timeframe, and no timeframe is proven best. A break on a daily chart describes a shift over weeks, one on a 5-minute chart a move over hours. Set the direction one or two timeframes above your entry chart.
This English edition is based on our German edition on kagels-trading.de and has been adapted for international readers.
More Chart Techniques guides
- Draw key levels
Support and Resistance: How to Draw and Use Key Levels
Where useful levels come from, how to draw zones with a stated rule and how to turn a level into a trade plan.
- Read price action
Price Action Trading: How to Read Charts Without Indicators
Market structure, key zones and three bar patterns, with a core setup and a real SPY example where the signal failed.
- Read candlestick charts
How to Read Candlestick Charts: Body, Wicks and Context
Open, high, low and close in one candle, body and wicks, two real Gold candles read step by step and how often patterns really occur.
- Know candlestick patterns
Candlestick Patterns: 10 to Know, Tested on Real Data
Ten patterns with rules and a cheat sheet, counted on DAX, S&P 500, EUR/USD and Gold since 2014: most are rare, none is a signal on its own.
- Combine timeframes
Multi-Timeframe Analysis: A Weekly and Daily Workflow
How to combine the weekly chart for context and the daily chart for entry under one stated rule, with a documented SPY case from June 2025.
- Trade pullbacks
Pullback Trading: Entries, Stops and Failed Setups
Pullback or reversal, limit against confirmation entry, and one fixed rule set on three real QQQ cases: a target, a stop and a cancelled setup.
- Trade sideways ranges
Range Trading: Boundaries, Orders and Two Documented Fades
A 14-session rule to draw horizontal boundaries, three order-type variants and two Alpaca-verified SPY fades, one that reached the target and one that was stopped out.
- Read chart formations
Chart Patterns: Reversals, Continuations and Failures
Reversal, continuation and bilateral formations with the measured-move convention per pattern and two documented SPY rectangle cases.
- Trade breakouts
Breakout Trading Strategy: Entries and False Breakouts
How often breakouts fell back into the range in our count of 1,472, and how to plan entry, stop and position size.
- Draw and trade trendlines
Trendline Trading: How to Draw Trendlines and Trade Them
How to draw trendlines with a fixed rule, four strategies for bounces, breaks and retests, and a real SPY line break without a lasting reversal.
- Use Fibonacci levels
Fibonacci Retracement Levels: How to Draw and Trade Them
How to calculate and draw retracement levels, trade pullbacks with confluence and a stop at the structure, and what a ten-year test says about the levels.
- Set Fibonacci targets
Fibonacci Extension: Levels, How to Draw It and Calculator
Three-point extension targets from the end of a pullback, why they differ from levels beyond 100%, a free calculator and three SPY swings, one without a single target reached.
- Trade gaps
Gap Trading Strategy: How to Trade Gaps and When Gaps Fill
Opening and full gaps, the four classic gap types, how often SPY gaps filled in our count since 2001, and plans for gap fill and gap and go.
- Calculate pivot points
Pivot Points: Formulas, Types and How to Trade Them
Formulas for standard, Fibonacci, Woodie, Camarilla and DeMark pivots, a free calculator, which session counts and a real SPY day.
- Swing trade
Swing Trading: 4 Strategies, Risk and Real Examples
Four swing trading strategies on the daily chart, position size, gap risk and US rules, with two hypothetical SPY pullbacks: one hit its target, one was stopped out.
- Identify market stages
Stage Analysis: Stan Weinstein's Four Market Stages
Stan Weinstein's four stages on the weekly chart, a Stage 2 checklist and two TSMC breakouts: one ran for a year, one gapped through its stop.
- Screen for growth leaders
CAN SLIM: William O’Neil’s Seven Rules for Growth Stocks
William O'Neil's seven CAN SLIM criteria with thresholds, his selling rules, a free screen with real counts and what the tests really show.
- Read Wyckoff ranges
Wyckoff Method: Accumulation, Distribution and Springs
Accumulation and distribution with phases A to E, springs and upthrusts as optional tests, and two real TSMC ranges read with and without hindsight.
- Trade Darvas boxes
Darvas Box Strategy: Rules, Entries and Stop Losses
The box rules step by step, when the edges become known, where the stop goes, and a mechanical test on TSMC in 2024 with two honest results.
- Count Elliott waves
Elliott Wave Theory: Rules, Patterns and Fibonacci
The five-wave pattern, three hard rules, zigzags, flats and triangles, Fibonacci ratios and a real DAX count, from the first German translator of the standard work.
- Understand Smart Money Concepts
Smart Money Concepts (SMC): What They Are and What Holds Up
The seven SMC building blocks, BOS vs CHoCH vs MSS, one labeled SPY sequence that held, one that failed, and what a chart can and cannot show.
- Understand ICT trading
ICT Trading: Silver Bullet, Killzones and What Holds Up
Michael Huddleston's Inner Circle Trader method: Silver Bullet, Judas Swing, the 2022 model and killzones in New York time, with one SPY setup that worked and one that failed.
- Trade order blocks
Order Blocks: How to Spot, Draw and Trade the Zone
The three conditions behind a valid order block, entry and stop at the zone, two SPY cases from 2026 and a 25-year count where a fixed rule lost money.
- Trade fair value gaps
Fair Value Gap (FVG): How to Spot, Trade and Test It
The three-candle rule, bullish, bearish and inverse FVG, two SPY cases from 2026 and a 25-year count of how often gaps were revisited and traded.
- Trade inverse fair value gaps
Inverse Fair Value Gap (IFVG): Rules, Examples and a Test
When a broken gap counts as inverted, three entry styles, one SPY retest that held, one that failed, and a 25-year test with trend and sweep filters.
- Trade failed breakouts with Turtle Soup
Turtle Soup Trading: Raschke Rules, ICT Version and a Test
Linda Raschke's original rules, Turtle Soup Plus One and the ICT version side by side, two SPY examples and a 25-year test on SPY and QQQ.
- Read a change of character
Change of Character (CHoCH): Rules, BOS vs MSS and Data
The first close against the trend, close versus wick, CHoCH vs BOS vs MSS, two SPY cases and what the trend did next after 287 CHoCHs on SPY and QQQ.
- Read a market structure shift
Market Structure Shift (MSS): Rules, BOS vs CHoCH and Data
MSS as a CHoCH with a sweep and a fair value gap, the comparison with BOS and CHoCH, two 2021 cases and what 14 daily MSS on SPY and QQQ did next.
- Read liquidity sweeps
Liquidity Sweep: How to Spot It and Trade the Reversal
Sweep or run, buy-side and sell-side liquidity, internal and external targets, SPY reversal, continuation and failed-reversal examples and a 25-year count of a fixed sweep rule.
- Interpret volume
Volume Analysis in Trading: How to Read Volume Honestly
What volume counts in stocks, futures, forex and crypto, how to read it against its own average, and our SPY test of high-volume days since 2001.