
Gold Price Forecast: Next Week, Coming Days and Long Term (XAU/USD)


Gold ended last week at $4,165.2 and found support at the March low again. First the price fell below the March low at $4,098.7, then it closed back above; the range almost matches the reversal week before. This week gold has fallen below the support zone around $4,070 and is holding for now in the $4,000 area. The weekly low is at $3,986.9.
Gold forecast in 30 seconds
Last week
Gold found support at the March low again and closed at $4,165.2, with almost the same range as the reversal week before.
Coming days
Gold fell below the support zone around $4,070 and is holding for now in the $4,000 area. The weekly low is $3,986.9.
The levels
Below, the 4,000 mark and the 2026 low at $3,942.7. Above, the resistance zone around $4,220.
Long term
Sideways with falling highs; the yearly chart still shows an uptrend.
On this page
- Gold forecast in 30 seconds
- Gold price forecast for the coming days: will gold rise again?
- Gold price forecast on the daily chart: support zone broken
- Gold price forecast for this week: March low broken, the 4,000 mark in focus
- What can move gold next: two US dates
- Three scenarios: which level decides
- Gold price forecast long term: sideways with falling highs
- Gold price forecast long term: the yearly chart
- Gold price forecast 2026: what the banks expect
- Gold price forecast 2027 and 2028: what the chart and the banks say
- Gold price forecast 2030: what the In Gold We Trust Report expects
- Gold price forecast 2040 and 2050: why there is no serious number
- How this forecast is made
- Conclusion: the 4,000 mark and the resistance zone decide
- Frequently asked questions
- Please note
Gold price forecast for the coming days: will gold rise again?
For Friday, 23 October 2026
- Possible range today, Friday 23 October$3,960 – $4,050
 Click to enlarge
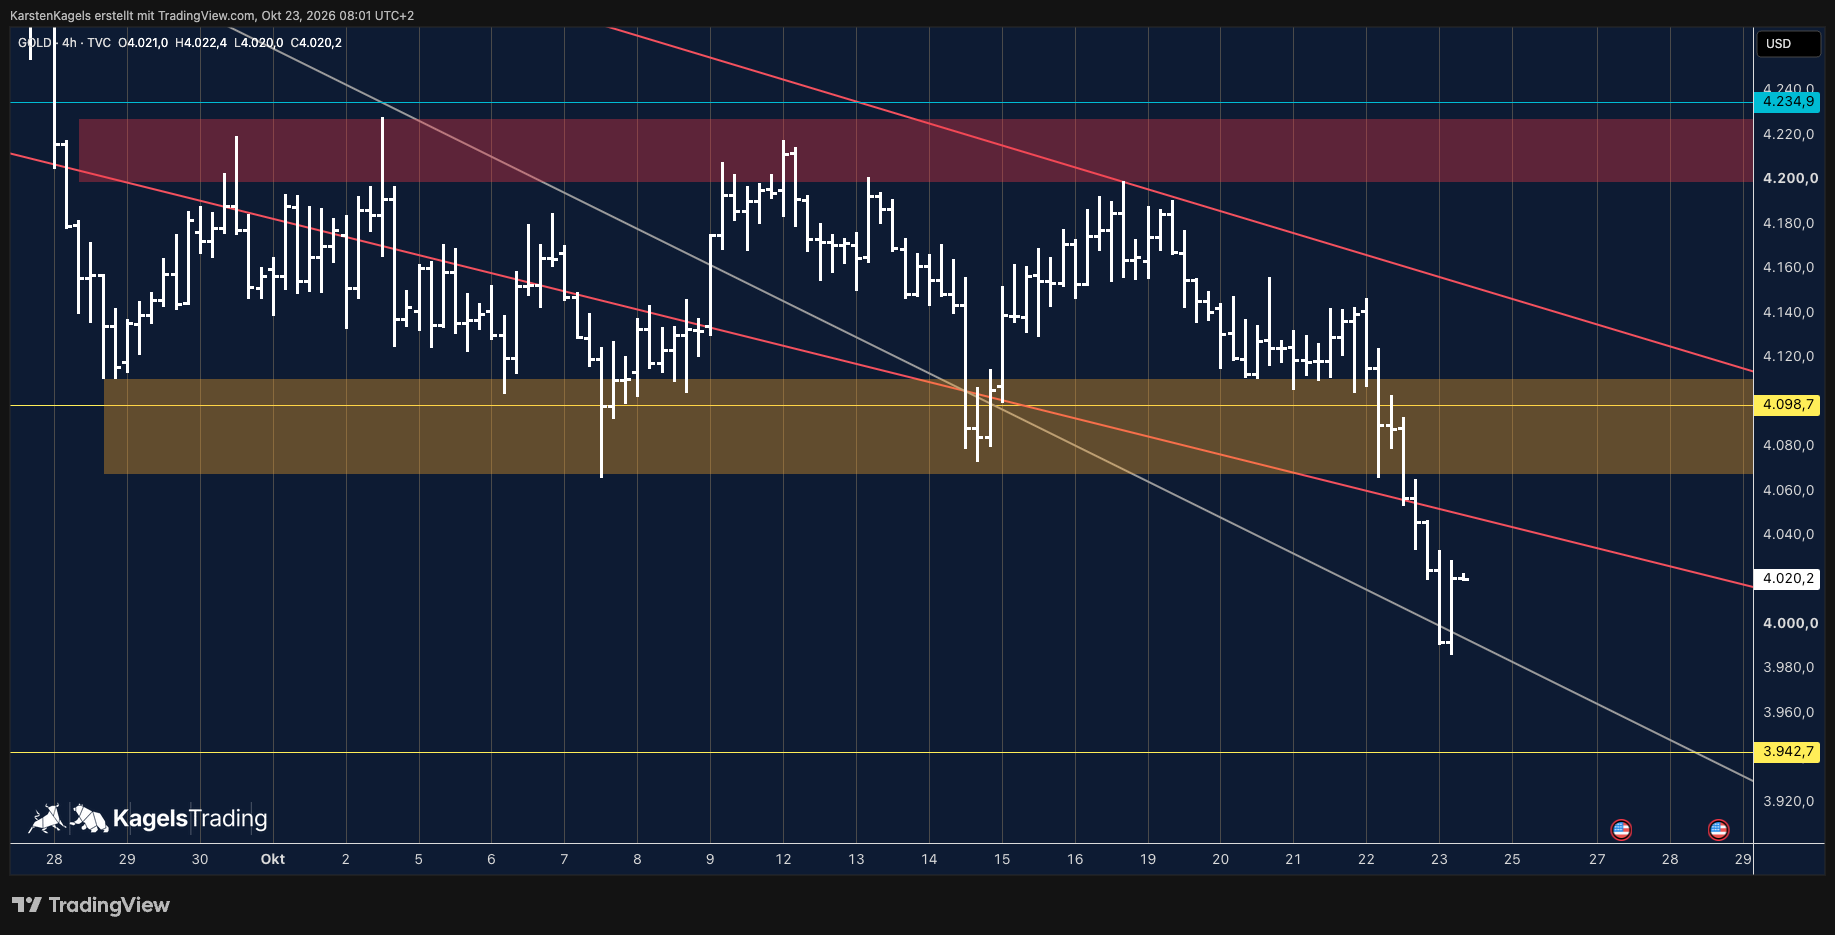
The support zone around $4,070 has given way. The downward impulse is holding for now in the $4,000 area, and the weekly low is at $3,986.9. From there the price recovers a little. The focus is on the 4,000 mark: as long as it holds, stabilization remains possible.
The 4-hour chart shows the downward impulse in detail. The support zone around $4,070 has given way, and in the $4,000 area the grey trend line has held. From the weekly low at $3,986.9 the price recovers a little.
Resistance
- $4,220
Price at analysis$4,020.20
Support
- $4,000
- $3,942.70
Gold price forecast on the daily chart: support zone broken
 Click to enlarge
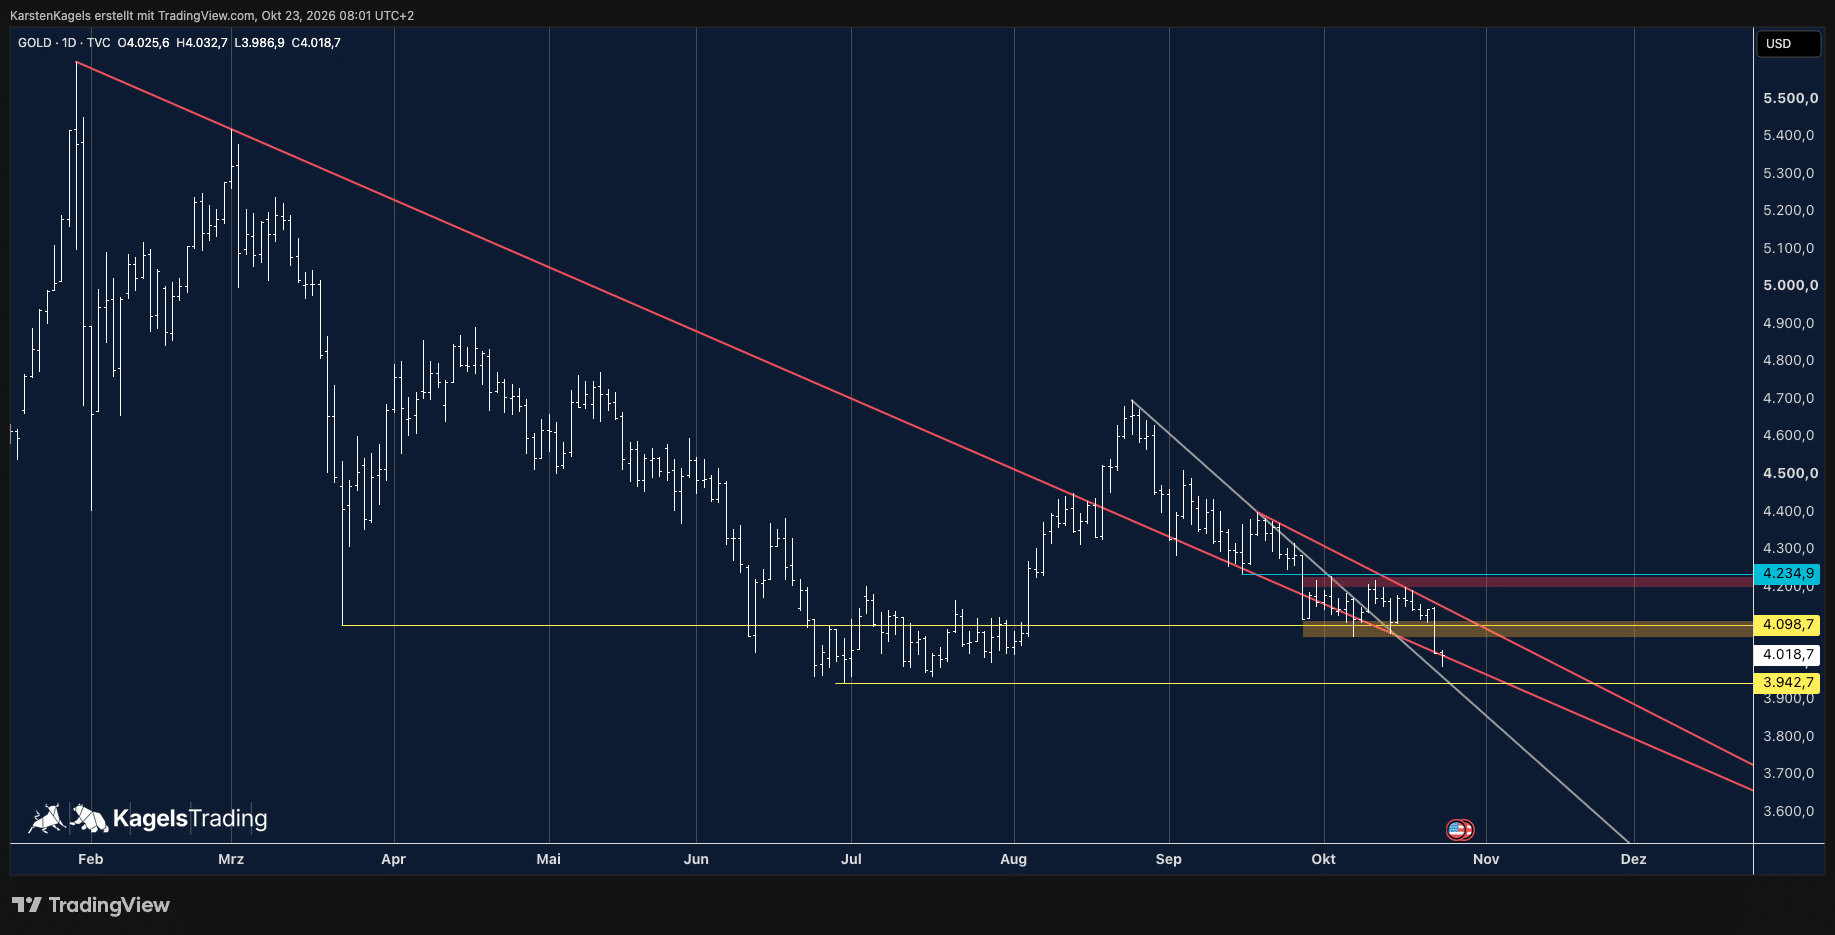
On the daily chart the support zone has given way. On 9 October gold opened at $4,134.4, rose to $4,207.5 and closed at $4,194.1. In doing so it broke the short-term grey downtrend line from the August high and the longer-term downtrend line from the record high in late January. On Friday, 16 October, gold opened at $4,170.8, rose to $4,198.9, fell to $4,147.4 and closed at $4,165.2. On Friday, 23 October, it opened at $4,025.6, rose to $4,032.7, fell to $3,986.9 and stood at $4,018.7 at 08:01, below the March low and below the support zone.
The red resistance line remains a significant cap. Only a break above it would point to follow-through. Below it lies the resistance zone around $4,220.
The focus is now on the 4,000 mark. As long as it holds, stabilization remains possible. A quote below it, including a new yearly low below $3,942.7, would likely bring more weakness. The daily chart shows no new uptrend; above the resistance zone the next level would be the 2025 high at $4,550.5.
Resistance
- $4,550.50
- $4,220
Support
- $4,000
- $3,942.70
Gold price forecast for this week: March low broken, the 4,000 mark in focus
Week of 19 October 2026
 Click to enlarge
All charts on this page show the spot price (TradingView: GOLD). The monthly and yearly charts show Friday's close on 16 October 2026, exported on 17 October at 09:41 and 09:40 CEST. The weekly, daily and 4-hour charts show the state of 23 October 2026, each at 08:01 CEST. Every caption names its own state. Gold futures trade at slightly different prices than XAU/USD spot.
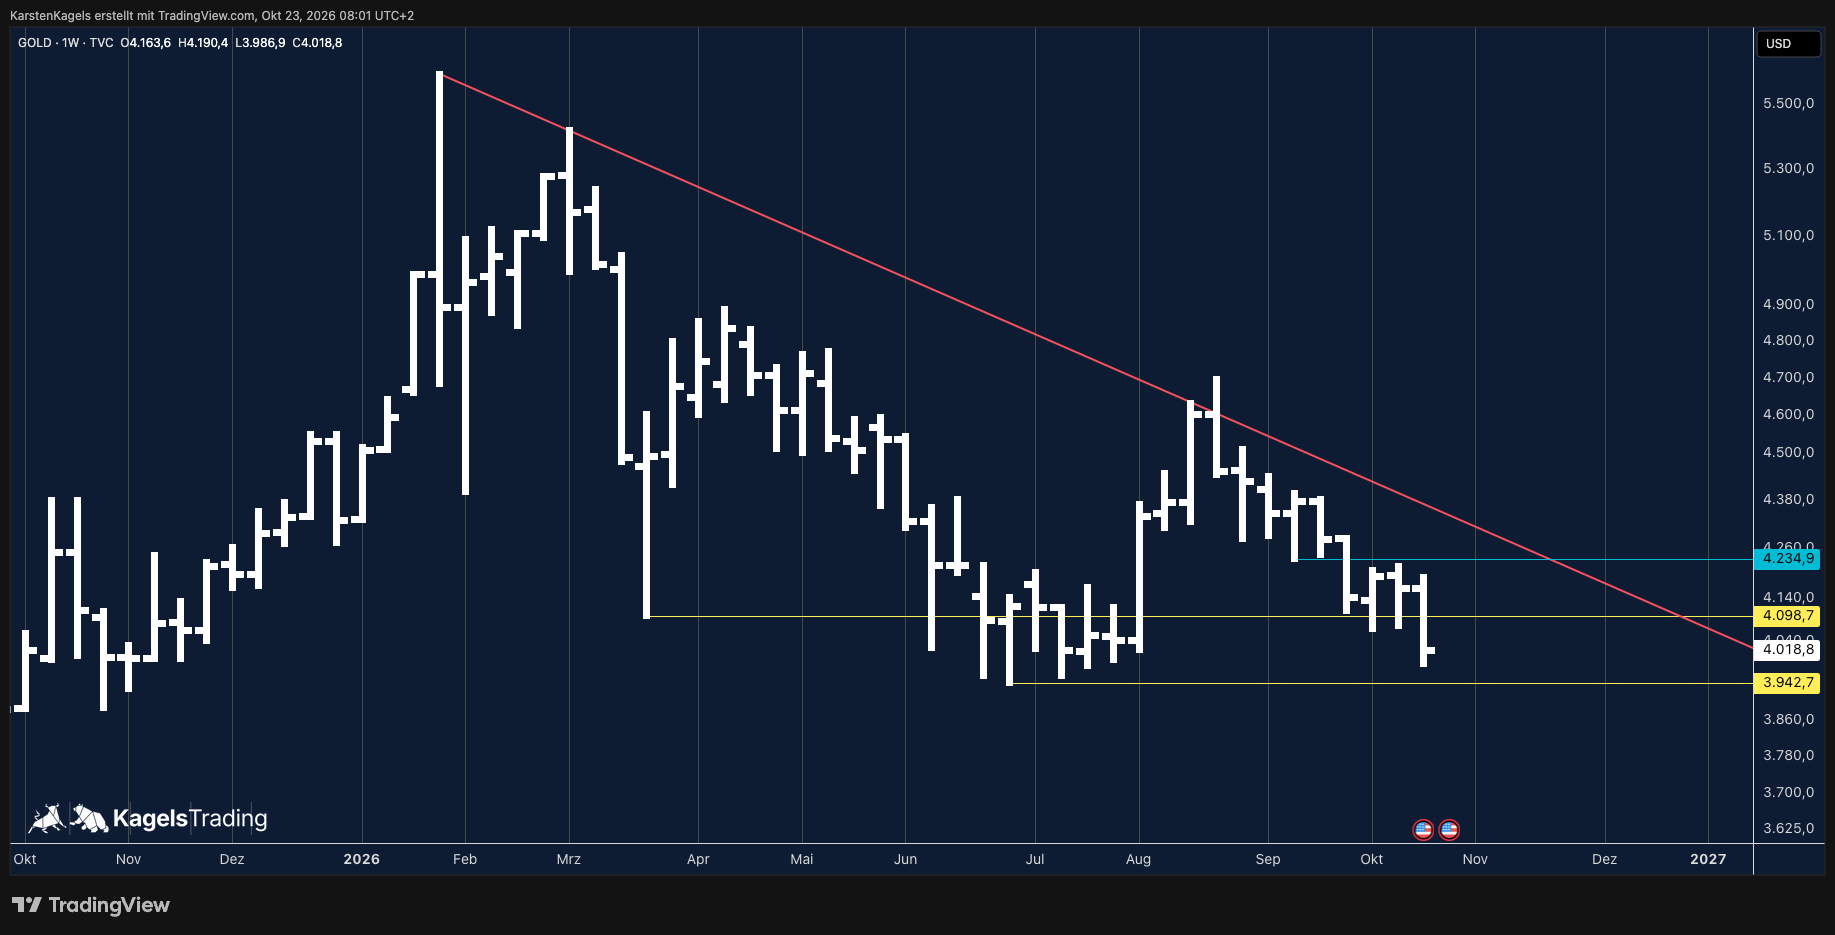
On the weekly chart the big picture has hardly changed. In August the recovery from the 2026 low turned down near the red downtrend line from the record high, just above the 2025 high at $4,550.5. Six weeks of correction followed.
Last week also found support at the March low. Gold opened at $4,194.8, fell to $4,073.5, below the March low, rose to $4,217.2 and closed on Friday at $4,165.2, back above the level. The range of about $144 is almost the same as the week before (reversal week of 9 October: low $4,066.6, high $4,207.5, about $141). So the situation resembled the possible reversal scenario.
The current week has fallen below the support zone. Gold opened at $4,163.6, rose to $4,190.4 and fell to $3,986.9. On Friday at 08:01 the price stands at $4,018.8 and so below the March low. The weekly low is below the lows of the two previous weeks ($4,073.5 and $4,066.6) and above the 2026 low at $3,942.7. A reversal is not visible in the current week at the moment.
On the weekly chart the red downtrend line is still well above the price. It runs at about $4,340, so there is still some way to go. On the daily chart gold broke the same line on 9 October; the difference comes from the logarithmic scale of the weekly chart. A weekly close above it would be the next positive sign.
Resistance
- $5,598.80
- $4,550.50
- $4,340
Support
- $4,000
- $3,942.70
What can move gold next: two US dates
Two US dates are coming up in the next two weeks. They are reasons to read the chart again, not a forecast of a particular reaction. Times are Eastern Time, with central European time in brackets.
28 October, usually 2:00 p.m. ET (19:00 CET): Fed rate decision after the meeting of 27 and 28 October (FOMC calendar).
6 November, 8:30 a.m. ET (14:30 CET): US jobs report (non-farm payrolls) for October (BLS release schedule).
Gold is priced in dollars, so US rates and inflation matter. The Fed raised its target range to 3.75 to 4.00 percent on 16 September. The background is in our article on the Fed rate decision; the dollar side is covered in the EUR/USD forecast.
Three scenarios: which level decides
The 4,000 mark below and the resistance zone around $4,220 above decide. The price levels come from Karsten's charts; the closing conditions are an editorial guideline. They are reference levels, not order rules.
Bullish: the reversal week carries on
Applies if gold rises above the red resistance line and the resistance zone on a daily close. The zone is at about $4,220; only a break above it would point to follow-through. A weekly close above the red downtrend line on the weekly chart, at about $4,340, would confirm the reversal week. The next level above is the 2025 high at $4,550.5. A fall back below the 4,000 mark cancels this path.
Wait: between the 4,000 mark and the resistance zone
As long as gold swings between the 4,000 mark and the resistance zone, neither side has won. The range runs from about $4,000 to about $4,220. Until then the recovery technically remains a correction within the downtrend since the August high. No setup is a valid result in this situation too.
Bearish: the reversal week fails
Applies if gold falls below the 4,000 mark on a daily close. Then the reversal week would have failed and the downtrend since the August high would be in charge again. A quote below it, including a new yearly low below the 2026 low at $3,942.7, would likely bring more weakness. A weekly close above about $4,340 cancels this path.
Resistance
- $4,550.50
- $4,340
- $4,220
Support
- $4,000
- $3,942.70
Gold price forecast long term: sideways with falling highs
 Click to enlarge
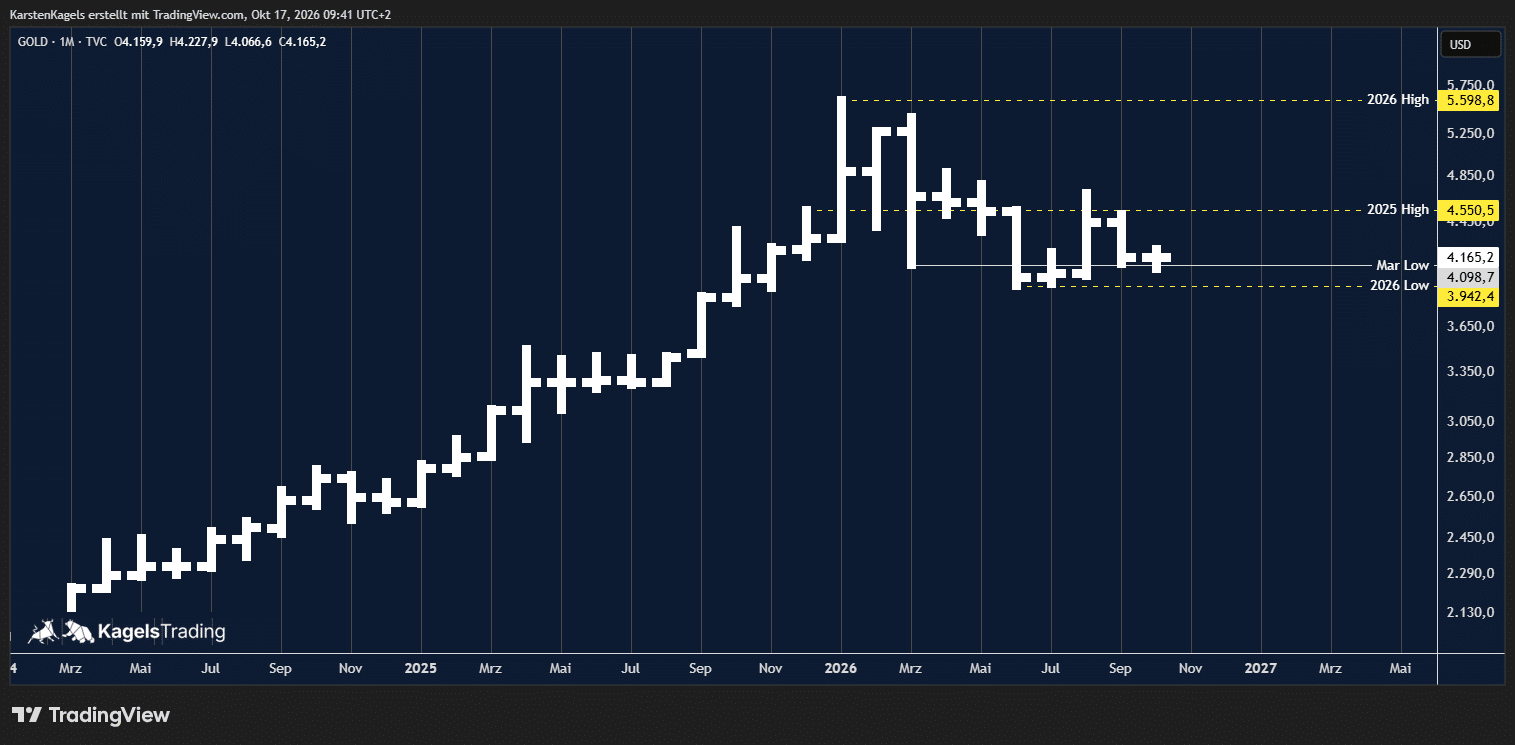
The monthly chart shows how gold briefly fell below the September low in October. The September low is at $4,110.9; October has reached $4,066.6 so far. Since then the price has been moving up again, which is positive in principle.
In the bigger picture the monthly chart looks like a sideways move with falling highs. The record high of $5,598.8 in January was followed by a lower high in March and an even lower one in August. For the longer term that looks somewhat negative at the moment. October opened at $4,159.9 and stands at $4,165.2. On the monthly chart the price holds the March low and so continues the sideways phase.
Gold and silver often move in the same direction over the long term, but not at the same pace. The levels for the second precious metal are in the silver price forecast. The other industrial and precious metals are covered in the platinum, palladium and copper forecasts.
Resistance
- $5,598.80
- $4,550.50
Support
- $4,110.90
- $4,098.70
- $3,942.70
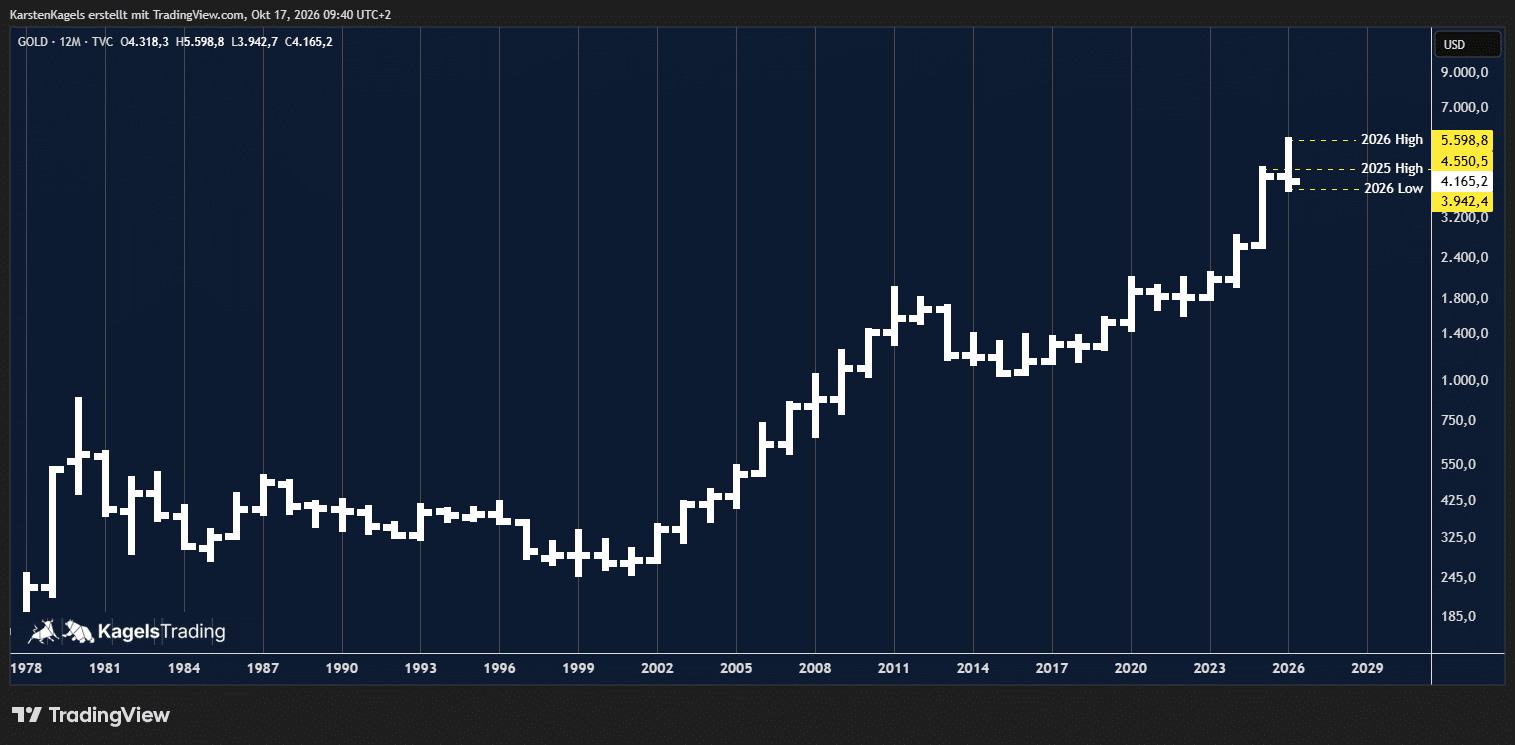
Gold price forecast long term: the yearly chart
 Click to enlarge
The yearly chart still shows the long-term uptrend in gold. Each bar is one calendar year. Gold opened 2026 at $4,318.3, reached the record high at $5,598.8 and fell to $3,942.7. At $4,165.2 the price is below the year's open, so 2026 remains a possible reversal year.
Resistance
- $5,598.80
- $4,550.50
- $4,318.30
Support
- $3,942.70
Gold price forecast 2026: what the banks expect
Selected published gold outlooks for 2026 range from year-end targets to scenarios. They come from different months and measure different things: a year-end target, a target range, possible highs or hypothetical scenarios. They are a framework, not trading signals, so each figure carries its date.
| Institution | Expectation | As of |
|---|---|---|
| Goldman Sachs (via investingLive) | $4,650 at year-end | 23 Sep 2026 |
| J.P. Morgan | target range $6,000 to $6,300 | 9 Feb 2026 |
| LBMA survey | possible highs up to $7,000 | 20 Jan 2026 |
| World Gold Council | scenarios from minus 20% to plus 30% | 4 Dec 2025 |
The figures in detail: According to investingLive, Goldman Sachs has named $4,650 per ounce for the end of 2026 since September, after $4,900 in August; J.P. Morgan Private Bank names a range of $6,000 to $6,300. In the LBMA survey of 31 analysts, $6,000 and $7,000 are named as possible highs. The World Gold Council explicitly gives no price forecast but hypothetical scenarios from a drop of 5 to 20 percent to a gain of 15 to 30 percent, measured against the average LBMA gold price in November 2025.
The common driver is central bank demand. In August, Goldman Sachs Research expected purchases of 50 tonnes a month on average in 2026, against about 17 tonnes before 2022. The J.P. Morgan forecast dates from February, before the decline from the August high. Goldman Sachs cut its year-end target in September, after the Fed’s rate hike.
Gold price forecast 2027 and 2028: what the chart and the banks say
The yearly chart gives no target level for 2027 or 2028. It shows that the uptrend is intact in the long term and that 2026 is a possible reversal year. The level from which 2027 starts depends on the year’s close in 2026: will it be above or below the open at $4,318.3?
Goldman Sachs has a target for the end of 2027: $5,400 per ounce. The news service Newsquawk reported this on 18 September 2026, a few days after the Fed’s rate hike. From the weekly close at $4,165.2 that would be about 30 percent higher. According to investingLive, the bank sees central bank purchases as the main driver.
Gold price forecast 2030: what the In Gold We Trust Report expects
The best-known long-term forecast for 2030 comes from the In Gold We Trust Report by Incrementum AG in Liechtenstein. Its base scenario from 2020 saw about $4,800 by the end of 2030. According to the presentation of 20 May 2026 (in German), gold already reached that level in 2026. The inflationary scenario names $8,926 for December 2030.
This figure is a scenario with assumptions about inflation, not a chart level. The yearly chart gives no reliable point forecast for 2030; it only describes the direction. A possible reversal year in 2026 leaves the long-term uptrend untouched for now.
Gold price forecast 2040 and 2050: why there is no serious number
There is no reliable point forecast for 2040. Nobody knows the monetary policy and the inflation of the 2030s. Anyone who names an exact number for that year is only extending assumptions.
The yearly chart itself shows how long gold can run without new highs. After the 1980 high at about $850, it took until early 2008 before gold rose above that level again. Anyone planning to 2040 should therefore allow for both: a continuation of the uptrend and long phases without new highs.
For 2050, too, only the direction of the yearly chart remains. Anyone planning that far ahead invests in gold as a store of value, not by price levels; numbers for 2050 would be guesses.
How this forecast is made
The charts are my own, with spot prices, from the daily to the yearly chart. I start on the weekly and daily chart, place the move on the monthly chart and check on the yearly chart whether the long-term trend still holds. How such levels work is explained in our guide to support and resistance. The charts were made with TradingView, and this page follows our editorial policy.
Conclusion: the 4,000 mark and the resistance zone decide
As an active trader since 1980, I see that the support zone around the March low has given way. Gold ended the week of 9 October as a reversal week and broke both downtrend lines on the daily chart. That was positive in principle. Whether the current week follows on remains to be seen; a reversal is not visible at the moment.
My assessment for the coming days: the focus is on the 4,000 mark. As long as it holds, stabilization remains possible; a quote below it would likely bring more weakness. The resistance zone around $4,220 remains a cap. In the long term the yearly chart still shows an uptrend, while the monthly chart shows falling highs.
Frequently asked questions
Will the gold price rise again?
In the short term gold is finding support in the $4,000 area, and the daily chart does not show a new uptrend. On 9 October 2026 gold closed the week as a reversal week at $4,194.1 and broke two downtrend lines on the daily chart. Above lies the resistance zone around $4,220 and then the 2025 high at $4,550.5.
Will the gold price keep falling?
That becomes more likely if gold falls below the 4,000 mark. A daily close below it would make the reversal week fail; a quote below it, including a new yearly low below $3,942.7, would likely bring more weakness. As long as gold stays above $4,000, stabilization is possible.
How is the gold price developing in 2026?
On the yearly chart, 2026 so far looks like a possible reversal year. Gold opened at $4,318.3, reached the record high at $5,598.8 and fell to the 2026 low at $3,942.7. Since September Goldman Sachs names $4,650 for the year-end; J.P. Morgan named a range of $6,000 to $6,300 per ounce in February.
How high will the gold price be in 2027?
The yearly chart gives no point forecast for 2027. According to Newsquawk, Goldman Sachs named $5,400 for the end of 2027 in September. The yearly chart shows the long-term uptrend but describes a direction, not a target price. What matters for the start of 2027 is whether 2026 closes below or above the year’s open at $4,318.3.
What is the gold price forecast for 2030?
There is no reliable point forecast for 2030. The In Gold We Trust Report names $8,926 for the end of 2030 in its inflationary scenario; its base scenario of about $4,800 was already reached in 2026. The yearly chart only shows the direction: the long-term uptrend is intact.
Can you trade gold at the weekend?
That depends on the product and the broker. Regular spot and CFD trading usually pauses at the weekend, but some exchange products and brokers offer weekend trading, often with wider spreads. Check your broker’s trading hours; on Monday gold can open with a gap to Friday’s price.
Please note
The scenarios are a personal assessment based on experience. They summarize possible price developments for each time frame and are not a certainty. This is market analysis, not investment advice. Keep your position sizes in line with your own risk management.
This forecast is translated from the German edition on kagels-trading.de.
How our forecasts are made and reviewed: How we work.