
Order Blocks: How to Spot, Draw and Trade the Zone


Contents
- Order blocks in 30 seconds
- What is an order block?
- Bullish and bearish order block
- How to identify an order block: the three conditions
- How to draw an order block
- How to trade an order block: entry, stop and exit
- Two real SPY examples: one held, one failed
- What a fixed order block rule did on 25 years of SPY
- Mitigated order block and breaker block
- Order block, fair value gap or supply and demand zone?
- Common order block mistakes
- Order blocks on different timeframes
- What an order block cannot do
- Conclusion: order blocks organize the chart, they do not replace a strategy
- Frequently asked questions about order blocks
- About the author
Most traders look for an entry where the move is already running. The Smart Money Concepts turn this around. Their assumption: large players need counterparties for their orders and find them where many small traders have their stops, below obvious lows, above obvious highs and at round numbers. The order block is the candle where this reading pins the event to the chart.
This guide shows what separates an order block from any other candle. You learn how to draw it, where entry and stop go and why many zones fail. It covers the difference to a fair value gap, a supply and demand zone and a breaker block. And it adds two real SPY examples plus a count with a fixed rule over 25 years, so you can judge the concept by data, not by stories.
Order blocks in 30 seconds
- Definition: an order block is the last opposite candle before an impulsive change of direction. Its range from low to high is the zone.
- Three conditions: first a liquidity sweep, then an impulsive move, often with a fair value gap, then a break of market structure. Without all three it is not a tradable zone.
- Two directions: the bullish order block is the last red candle before the rally, the bearish one the last green candle before the drop.
- Entry: you trade the pullback into the zone, not the impulse. The 50% line separates an intact zone from a broken one.
- Limit: an order block is a context tool, not a signal. In our SPY count one fixed order block rule lost money over 59 trades.
What is an order block?
An order block is the last opposite candle before an impulsive change of direction on the chart. The range of that candle from low to high marks the price area where the Smart Money Concepts assume large traders placed their orders.
The term comes from the Smart Money Concepts (SMC), a trading approach that tries to read the market from the view of large players. Its basic assumption: banks, funds and other institutions cannot put a large position into the market in one go. They need counterparties, and these appear where many small orders are triggered at the same time.
The size of the market behind this idea is measured, not claimed. According to the BIS Triennial Central Bank Survey, trading in the over-the-counter foreign exchange market reached $9.6 trillion per day in April 2025, up 28% from $7.5 trillion three years earlier. A single player who wants to move even a small fraction of that volume will push the price against itself if it simply buys at market. According to the BIS, large clients in FX increasingly use execution algorithms that spread big orders over time and across trading venues, with hedge funds among the early adopters. No particular chart pattern follows from that.
Why order blocks form, according to SMC
Imagine a fund that wants to build a large long position. If it simply buys at the market price, it drives the price up against itself. It gets better fills if the market first drops below an obvious low. That is where the stop-loss orders of the longs sit, and every triggered stop is a sell order that can serve as the other side of the fund’s buying.
In this story, price dips below the low, the large buy orders get filled, and price turns up fast. What is left on the chart is the last red candle before the rise. In the SMC reading this candle marks the area where the orders were. If price comes back later, new orders may meet the same area and the zone may react again.
What you can see on a chart is the sequence, not the sender. Even the most detailed data feed of the CME futures exchange, Market by Order, shows each individual order, but according to the CME it contains no customer identifiable information and no firm IDs. Whether a fund, a market maker or many small traders stood on the other side is not written in any chart. The fund story above is a model of the mechanism, not proof for a single case.
The pattern itself is not new. Supply and demand at key price areas has been described in technical analysis for decades as support and resistance. What the Smart Money Concepts add is precision: not a rough area, but a single candle, and not any candle, but the last one before the break.
Order block and block trade are not the same
Two terms are often mixed up, and the mix-up is misleading. One describes a real transaction, the other a chart zone.
A block trade is a large, privately negotiated trade. An order block is a price area on the chart that is derived from the price history.
The block trade is a real event with real volume. The CME defines it as a privately negotiated futures, options or combination transaction that may be executed apart from the public auction market. In stocks, large share packages also change hands this way. The order block, by contrast, is an interpretation of the chart.
You do not see the orders behind an order block on the chart. You only see the candle and infer what might have happened. That matters if you want to judge the concept realistically. If you want to see where volume actually traded, you need volume analysis and order flow data. The order block is a hypothesis about liquidity, not proof.
Bullish and bearish order block
Both types follow the same sequence, only the direction changes. One gives you the long setup, the other the short setup.
A bullish order block is the last red candle before an impulsive move up. The zone then acts as support.
A bearish order block is the last green candle before an impulsive move down. The zone then acts as resistance.
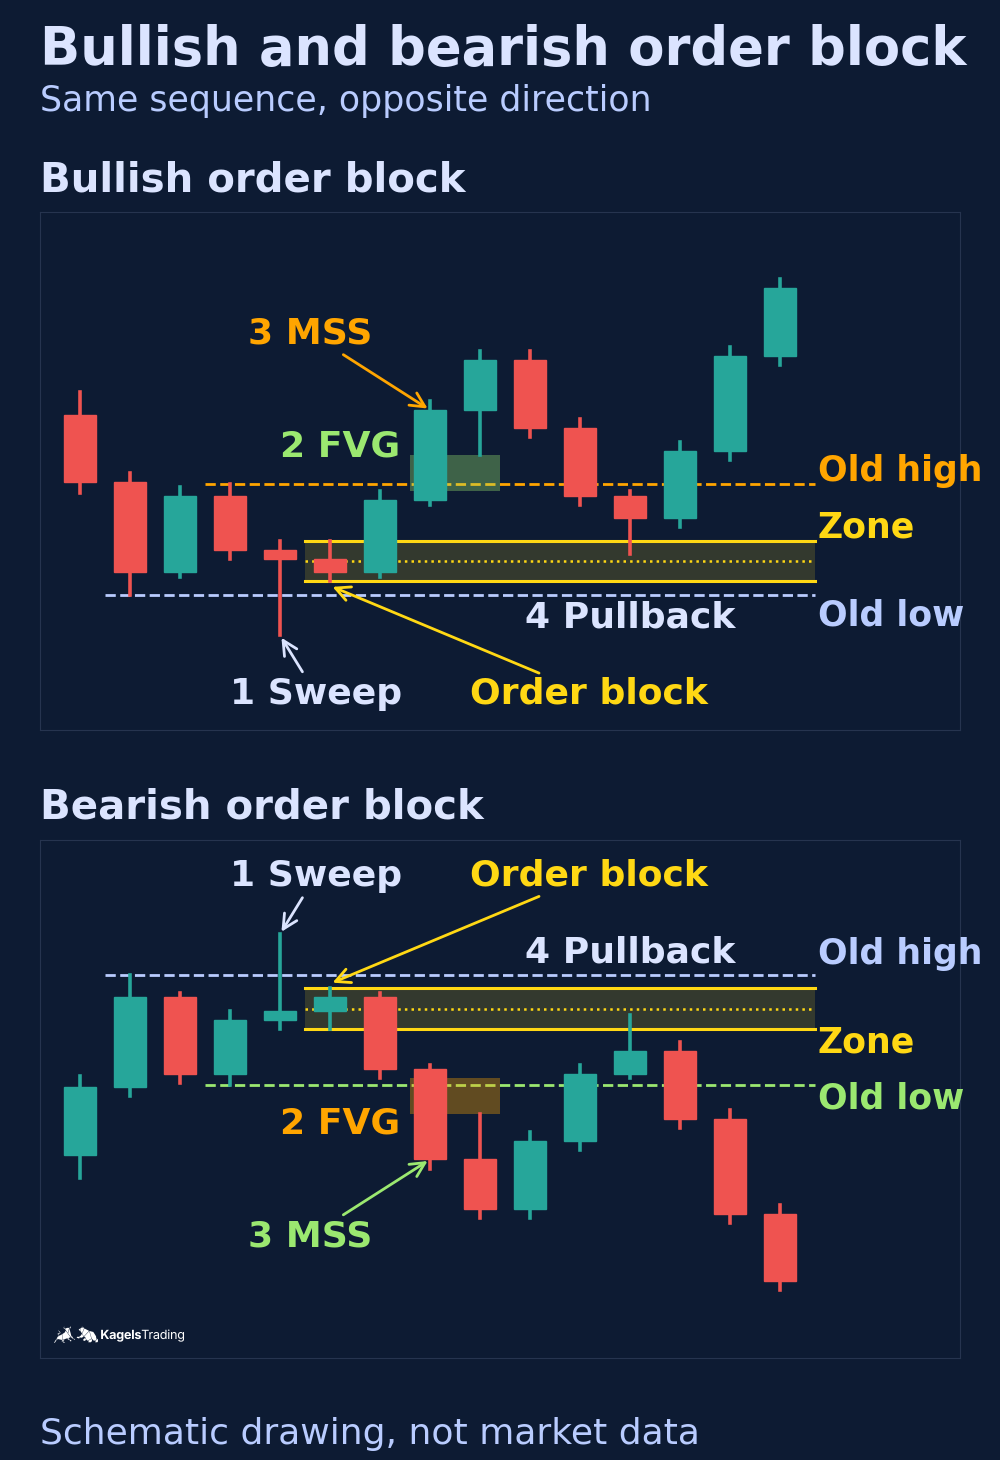
The graphic below shows both sequences one above the other: sweep, impulse with a fair value gap, structure break and pullback, once upward and once downward.
 Click to enlarge
Source: Kagels Trading, own drawing.
Bullish order block (long setup)
Price falls, runs below an obvious low and triggers the stops there. Right after that it turns with a strong move up and breaks the last relevant high. The last red candle before this impulse is the bullish order block.
The zone reaches from the low to the high of this candle. When price comes back later, the upper edge is the first point of contact. Some traders use only the candle body without the wick. Both versions are common. What matters is that you choose one and stick to it.
Bearish order block (short setup)
The bearish version is the mirror image. Price rises, runs above an obvious high, takes out the stops of the shorts there and then falls impulsively below the last relevant low. The last green candle before the drop forms the zone.
On the pullback, the lower edge is the first point of contact here. A bearish order block in an uptrend works against the larger pressure. That is not an argument against the concept, but one for defining the higher-timeframe trend first.
How to identify an order block: the three conditions
Not every opposite candle before a move is an order block. Three conditions have to come together: sweep, impulse and structure break. Otherwise you mark random pullback candles.
The first three steps decide whether the zone is valid at all. Only the fourth step, the pullback, is about the entry.
- Liquidity is taken: price runs above an obvious high or below an obvious low and triggers the stops there.
- Impulsive move: a strong move follows in the other direction, often with a gap between the candles as a sign of imbalance.
- Break of market structure: price breaks the last relevant high or low. Only then has the balance of power turned.
- Pullback into the zone: when price returns to the last opposite candle before the impulse, traders look for their entry there.
Condition 1: the liquidity sweep
A liquidity sweep is a brief move beyond an obvious price level that triggers the stops resting there before price turns the other way.
In practice you recognize it by a wick beyond a previous extreme. Price was there briefly but did not close there. Without this sweep, nothing explains why large orders should suddenly sit at this spot. The sweep is the first filter.
Condition 2: the impulsive move, often with a fair value gap
The sweep is followed by a move with visible speed. Large candle bodies, little resistance and often a price gap between the candles.
A fair value gap is a price area the market crossed so fast that a gap remains between the high of one candle and the low of the candle after next.
This gap is the visible sign of a short-term imbalance between supply and demand. It is not a must, but many SMC traders treat it as additional confirmation. A plain breakout with large candles and no gap can still meet the condition.
Condition 3: the break of market structure
A market structure shift is the break of the last relevant high or low that shows the previous trend has ended.
Without this break there is no evidence that the balance of power has turned. Price may have twitched up and then continued its downtrend. Only the structure break turns a twitch into a usable reversal.
SMC traders split this break into finer terms. A break of structure confirms a running trend, a change of character marks the first crack in it. The idea behind both is the same higher high and higher low logic that classic price action uses.
How to draw an order block
Drawing is craft, not interpretation. Five steps, always in the same order:
- Higher timeframe first: define the direction on the daily or four-hour chart. Without this decision you look for zones in both directions and always find one.
- Mark the obvious extremes: draw the last relevant highs and lows. These are the places where liquidity sits.
- Find the sweep: look for the candle whose wick runs beyond one of these extremes without closing there.
- Mark the last opposite candle: draw a rectangle from the low to the high of this candle and extend it to the right. That is your zone.
- Wait for the structure break: only when price has broken the last relevant high or low is the zone tradable. Before that it is just a marking.
In TradingView the rectangle tool is all you need. Some indicators draw order blocks automatically, but they usually mark every opposite candle before an impulse, regardless of sweep and structure. They work as a pre-filter, not as a decision. If you want to practice the five steps on past charts, the bar replay lets you do it bar by bar without seeing the future.
How to trade an order block: entry, stop and exit
You do not trade the impulse. It is over by the time you see it. You trade the pullback into the zone after the structure has broken.
Where to place the order
There are two common ways to enter. A limit order at the edge of the zone fills early: at the high of the candle for a bullish order block, at its low for a bearish one. The advantage is the tight stop, the drawback are false signals when price only touches the zone and keeps going.
The second way is to enter after a visible reaction. You wait until price reaches the zone and shows a turn there, for example a structure break on a lower timeframe. The entry price is worse, but you only trade zones that have shown a reaction. Whether that improves the results is something you have to test for your market.
The 50% line as a dividing line
The middle of the zone, measured from low to high, serves as a technical reference. It separates an intact zone from a broken one.
As long as price does not close below this line in a bullish order block, many traders still treat the zone as intact. For a bearish order block it works the other way round. This is no law of nature, but an SMC convention with a practical use: a clear, predefined limit instead of a gut decision in a running trade. Our count below shows how rarely a close below the line came before the stop.
Wicks count differently from closes
A wick below the 50% line is usually treated as harmless. Wicks come from short spikes and say little about the balance of power.
What counts is the closing price. If a candle closes clearly below the middle of the zone, the zone counts as weakened or broken under this convention. In SMC language, the buy orders assumed there are then no longer believed in. The chart cannot show whether any orders are left. Decide in advance which timeframe you use for this check, not during the trade.
Stop and position size
The stop belongs behind the structure, not at a convenient number. For a bullish order block that means below the low of the order block candle, with a small buffer. If this low breaks, the idea was wrong and you want to be out.
This is where many traders get the order wrong. They fix the position size first and then squeeze the stop so tight that the reward-to-risk ratio looks nice on paper. The right way is the reverse: derive the stop from the structure, measure the distance and calculate the size from that.
A large order block then simply means a smaller position. That feels wrong because the profit in a winning trade is smaller. But it is the only way to keep the risk per trade constant. The details are in our guides to position sizing and risk management.
Two real SPY examples: one held, one failed
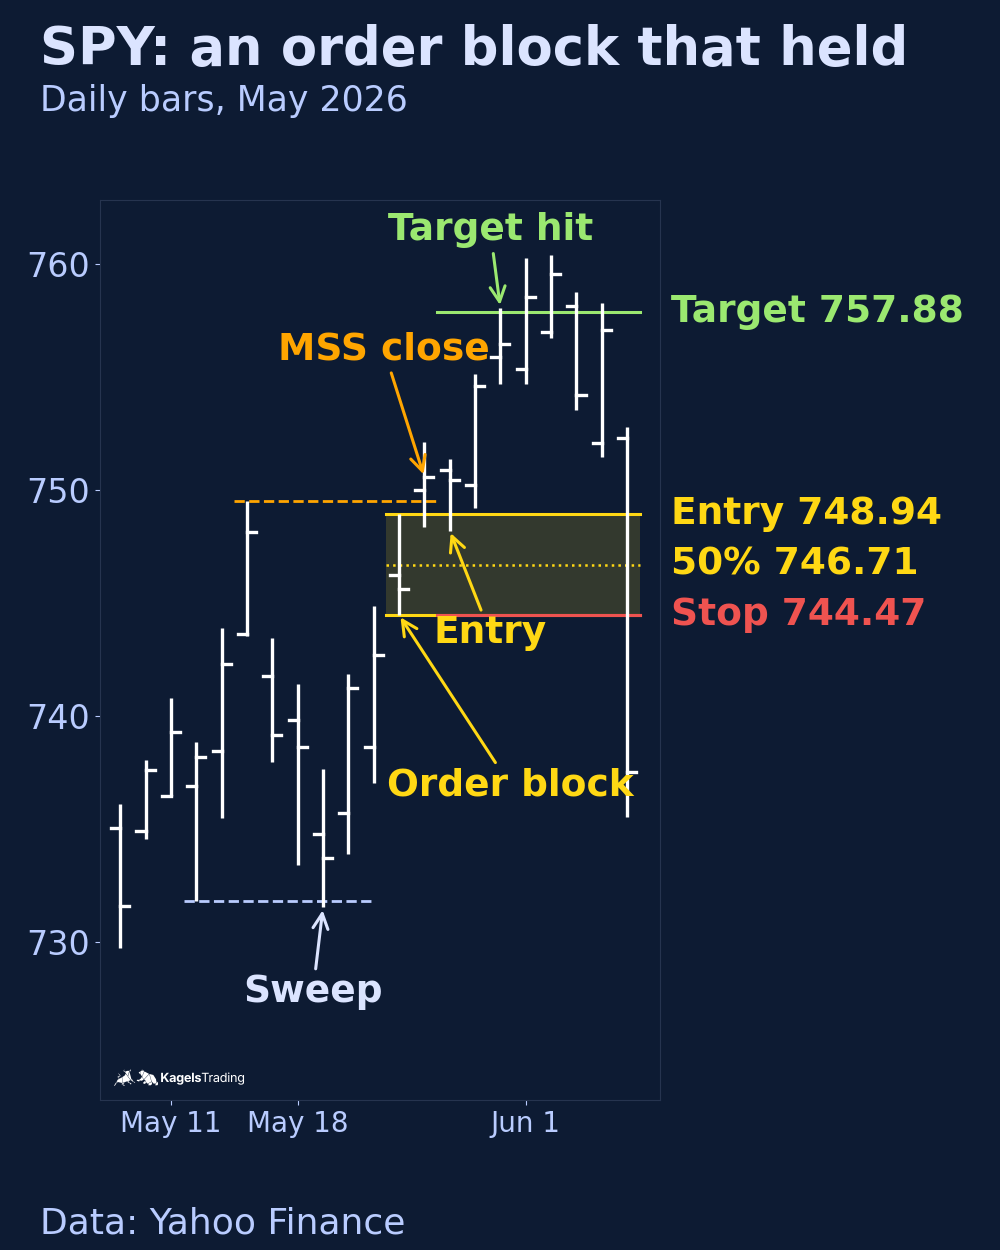
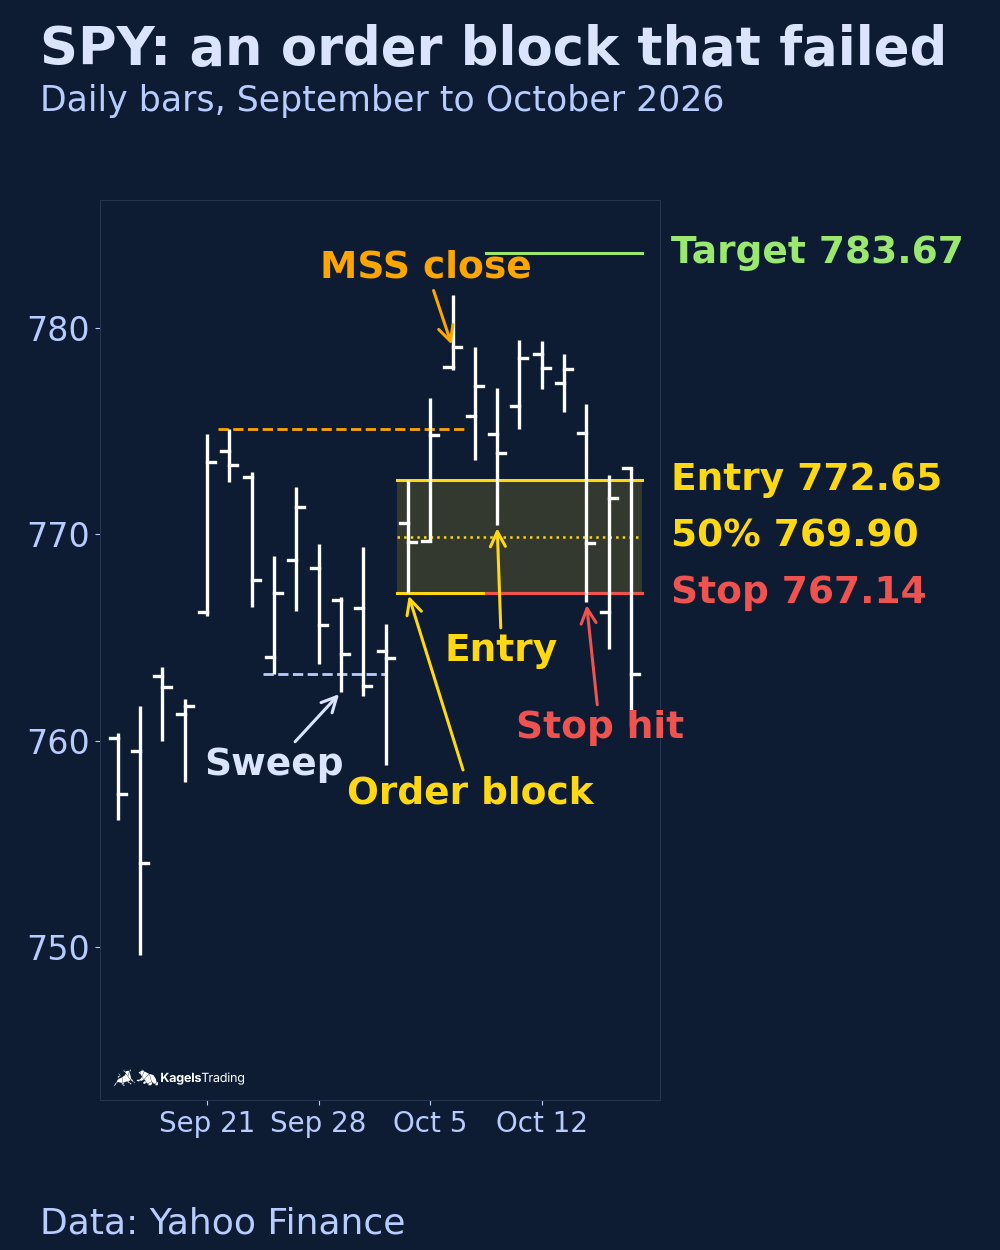
Both examples follow exactly the same rule, and both come from 2026. In short: a sweep below the last swing low with a close back above it, a close above the last swing high within ten bars, the last red bar before that close as the zone, a limit buy at the zone high, the stop one cent below the zone low and a target at twice the risk (2R). The full rule is in the next section.
In May 2026 the order block held. On May 19 SPY traded down to 731.53, below the May 12 low of 731.83, and closed at 733.73. On May 26 it closed at 750.59, above the May 14 high of 749.53. The last red bar before that close was May 22, with a zone from 744.48 to 748.94. On May 27 price came back into the zone and filled the buy at 748.94 with a stop at 744.47. Two days later the target at 757.88 was reached.
 Click to enlarge
In October 2026 the same rule failed. On September 29 SPY dipped to 762.35, below the September 24 low of 763.25, and closed at 764.20. Note what came next: on October 1 price fell even lower, to 758.79. The rule did not care, because the structure break followed anyway with a close of 779.09 on October 6, above the September 22 high of 775.14. The zone was the October 2 bar from 767.15 to 772.65. The buy filled on October 8 at 772.65. On October 14 SPY closed at 769.60, below the 50% line at 769.90, and the low of 766.71 took out the stop at 767.14.
 Click to enlarge
Both cases met every condition of the rule at the moment of entry. Sweep, break and pullback were all there, even if the October case had the extra lower low. Only afterward did one zone hold and the other not. That is the core lesson: an order block tells you where to look, not whether the trade will work.
What a fixed order block rule did on 25 years of SPY
I wanted to know how such a rule performs when nobody picks the nice charts. So we applied one fixed long rule to all SPY daily bars from January 2, 2001, to October 16, 2026. Prices come from Yahoo Finance. The prices in the May and October 2026 examples were cross-checked against Interactive Brokers, with differences of at most one cent. There are no commissions in the count.
These are the exact rules, so you can repeat the test. The trade list with all 59 trades is available as a CSV file, with entry, stop, target and exit for each one.
- Swings: a swing low is a bar with a lower low than the two bars on each side, a swing high the same with the high. A swing is known two bars later. We look back 60 bars.
- Sweep: a bar trades below the latest known swing low and closes back above it. The latest swing high must be above that low and at most 30 bars older than it. After a sweep, new sweeps within five bars are ignored.
- Structure break: within ten bars after the sweep, a close above the latest swing high. We used no separate filter for the strength of the impulse.
- Zone: the last red bar from the sweep up to the bar before the break. The 50% line is its midpoint.
- Entry: a buy limit at the zone high on the first bar that trades into the zone, at most 30 bars after the break. If that bar opens below the zone high, the fill is at the open.
- Exit: stop one cent below the zone low, target at 2R. If neither is hit, the trade closes at the close of the 40th bar, counting the entry bar. If a bar opens beyond the stop or the target, the exit is at that open. If stop and target are touched in the same bar, we count the stop. On a bar that fills intraday, a touched target does not count, because we do not know if the high came after the fill.
| Result | Count |
|---|---|
| Setups found (sweep, break, last red bar) | 86 |
| No pullback into the zone within 30 bars | 27 |
| Trades | 59 |
| Target reached | 16 (27.1%) |
| Stop hit, 4 of them through an opening gap | 43 (72.9%) |
| Total result | −9.4R, average −0.16R per trade |
This particular rule had a negative result in this SPY sample. The winners made +35.0R in total, the losers lost −44.4R. A target at 2R needs a hit rate of about one in three to break even, and this rule hit only a little more than one in four. Four stops were filled worse than planned because SPY opened below them, the worst at −1.8R in January 2026.
The 50% line did not give an early warning in most losing trades. Only in 13 of the 43 losers did SPY close below the middle of the zone on a day before the stop was hit. In most losers the stop came first, often on the same day as the close below the line. Among the 16 winners, 4 also closed below the line on an earlier day and still reached the target. On daily bars, the line alone was not a reliable filter.
What this test does not say. It covers one market, one timeframe, long trades only and one way of defining sweep, break and zone. A sample of 59 trades also leaves a wide margin of error around any hit rate. Order blocks on futures intraday charts, with a higher-timeframe filter or a different exit, can behave differently. If you trade order blocks, write your exact rules down and test them first, for example with our guide to backtesting. Testing many variants on the same data invites curve fitting, so decide the rules before you look at the results.
Mitigated order block and breaker block
Two terms come up all the time and are rarely explained well. Both describe a zone after its first test, one with a used-up effect, the other with a reversed one.
A mitigated order block is a zone that price has already returned to, so the orders assumed there count as filled.
In the SMC reading, the first pullback is the interesting one. After that, the zone counts as used up, because the orders assumed there are treated as filled. Whether later tests really react more weakly, the chart does not tell you; only a test with a fixed rule could show it. If you trade old zones again and again, you trade a convention that the concept itself has already retired.
A breaker block is an order block that was broken in the opposite direction and then acts as a zone with the reversed role.
A bullish order block that breaks clearly to the downside can act as resistance when price returns from below. At its core this is the classic role reversal of support and resistance, just in Smart Money vocabulary. If you know the principle from classic chart analysis, there is little new to learn here.
Order block, fair value gap or supply and demand zone?
Three concepts overlap and still describe different things. They differ mainly in zone size and therefore in the stop distance:
| Concept | What is marked | Typical zone size |
|---|---|---|
| Order block | Last opposite candle before the impulse | Narrow, one candle |
| Fair value gap | Gap between two candles inside the impulse | Very narrow |
| Supply and demand zone | Consolidation area before the impulse | Wide, several candles |
In practice the three often sit right on top of each other. The order block is the most precise and therefore the riskiest marking: narrow zone, tight stop, more false signals. The supply and demand zone is the widest approach, with more buffer and a worse reward-to-risk ratio. Which one you choose is a question of style, not of truth.
Extra overlaps are often read as confirmation. If an order block sits inside a Fibonacci retracement zone, many traders count that as a plus. A measured effect of such overlaps has not been shown. Next to these discretionary zones, many day traders also use calculated levels like daily pivot points as an objective reference.
Common order block mistakes
Most failed attempts do not fail because of the concept, but because of the execution. Five patterns come up again and again, and all five can be fixed with clear rules.
Trading a zone without a structure break
This is the most common mistake. An opposite candle before an impulse quickly looks like an order block, but without a break of market structure the basis is missing. The previous trend is still intact, and the zone sits against the dominant direction. Wait for the break, even if it makes your entry worse.
Marking random candles
Without sweep, impulse and structure break, every pullback candle becomes an order block. In the end the chart is full of rectangles, and one of them always reacts. That feels like confirmation, but it is pattern hunting with hindsight. The three conditions are not a ritual, they are the filter.
Trading mitigated zones again
Once a zone has been tested deeply, the idea behind it is used up. Still, old rectangles often stay on the chart for weeks and keep being traded. Markings need an expiry date. Remove zones as soon as they are mitigated.
Reading the pullback as an automatic signal
Price reaches the zone, so you buy. It does not work that way. An order block is an area of increased attention, not an entry instruction. Without a visible reaction in price there is no confirmation. Our two SPY examples show how similar a winning and a losing setup can look at the moment of entry.
Placing the stop too close to the zone
An order block can span many ticks, and price is allowed to move inside the zone. If you put the stop right at the zone edge to improve the reward-to-risk ratio, you get stopped out regularly and then watch the move run without you. The stop belongs behind the structure, and the position size follows from it.
Order blocks on different timeframes
Markets are fractal. The same sequences repeat on all timeframes, only in a different size. A sweep followed by a structure break forms on the one-minute chart just like on the daily chart.
The context is not the same, though. A zone on a one-minute chart covers a few minutes of trading, a zone on the daily chart a whole session. Short-term zones are often hit by news spikes and suit fast trades.
Many SMC traders consider zones on higher timeframes more reliable. That is a common assumption, not a measured result, and our count on daily bars did not show an edge either. Who created a zone in a single case, the daily chart does not show.
A common compromise: define the zone on the higher chart and fine-tune the entry on the lower one. This gives you the context of the larger trend and a tighter stop. It does not mean you are trading alongside large players.
What an order block cannot do
I do not trade with the vocabulary of the Smart Money Concepts myself. My method comes from classic price action in the tradition of Joe Ross, and there things have other names. But the principle behind it has been familiar to me for decades: the market takes liquidity before it turns. That was known long before the ICT terminology.
This leads to a sober assessment. An order block is a context tool. It tells you where to look, not what to do. It delivers no hit rate, no price targets and no confirmation, and in our SPY count one fixed version of the three conditions did not produce an edge.
One part of the concept can be tested, the other cannot. The chart pattern can be defined and tested, as we did above. The claim that institutional orders sat in a particular zone cannot be verified from the price chart. You only see that price reacted or did not. If you turn that into certainty, you confuse a plausible story with evidence.
Be careful with the environment, too. A large scene of coaches and channels has grown around ICT and the Smart Money Concepts, and not all of them earn their money from trading. The SEC warns in its investor alert on social media and investment fraud that investment information found on social media may be inaccurate, incomplete or misleading, and that influencers are sometimes paid to tout an investment. Test every concept on your own charts before you pay for it.
This guide is education, not investment advice. Trading with leverage, futures or options can lose more money than you expect, and past examples do not predict future results. Decide your risk per trade before you enter.
Conclusion: order blocks organize the chart, they do not replace a strategy
The order block is one of the more useful concepts from the Smart Money world, because it describes a sequence you can check. Liquidity is taken, an impulse follows, the structure breaks. You can follow these three steps on any chart without having to believe a story about banks.
What sets it apart from classic support and resistance zones is the precision of the marking. A single candle instead of a rough area. That is an advantage for the stop and a drawback for the hit rate, because narrow zones get run over more often. Our count on SPY makes that visible: almost three out of four trades with one fixed rule hit the stop. A smaller position size limits the loss in money, but it does not make a zone more reliable.
My recommendation after many years at the chart: use the order block to prioritize, not as a signal. It helps you decide which of the five zones on your chart is the relevant one. Whether you trade is still decided by the higher context. And how big you trade is decided by your risk management.
Frequently asked questions about order blocks
What is an order block in trading?
An order block is the last opposite candle before an impulsive change of direction. Its range from low to high marks the area where the Smart Money Concepts assume large traders placed their orders. Usually a liquidity sweep comes first, followed by a break of market structure.
How do I know whether an order block is valid?
Three conditions have to come together. The market first takes liquidity, then starts a clear impulse, and then breaks the existing structure. If one of them is missing, it is not a tradable zone, just a candle before a move.
What is the difference between a bullish and a bearish order block?
The bullish order block is the last red candle before a move up and then acts as support. The bearish one is the last green candle before a move down and acts as resistance. The sequence is identical, only the direction changes.
How do you enter after an order block?
You trade the pullback into the zone, not the impulse. Either with a limit order at the edge of the zone or after a visible reaction in price. The 50% line of the zone serves as the limit: closes beyond it count as a break.
Do order blocks work?
One fixed rule had a negative result on SPY daily bars. In our count from 2001 to October 2026, 16 of 59 trades reached the 2R target and 43 hit the stop, a loss of 9.4R in total. That covers one market, one timeframe and one rule, so it is no verdict on every order block approach. Test your own rules before you risk money.
What is a breaker block?
A breaker block is an order block that was broken in the opposite direction. A broken bullish order block can act as resistance when price returns from below. That matches the classic role reversal of support and resistance.
Do order blocks work on all timeframes?
Order blocks form on every timeframe, from the one-minute chart to the daily chart. Many traders consider zones on higher timeframes more stable, but that is an assumption, not a measured result. Who created a zone is not visible on any timeframe.
Is an order block the same as a block trade?
No, a block trade is a real, privately negotiated trade of a large position. An order block is a price area on the chart that is derived from the price history. One is a transaction, the other an interpretation.
This English edition is based on our German edition on kagels-trading.de and has been adapted for international readers.
More Chart Techniques guides
- Draw key levels
Support and Resistance: How to Draw and Use Key Levels
Where useful levels come from, how to draw zones with a stated rule and how to turn a level into a trade plan.
- Read price action
Price Action Trading: How to Read Charts Without Indicators
Market structure, key zones and three bar patterns, with a core setup and a real SPY example where the signal failed.
- Trade breakouts
Breakout Trading Strategy: Entries and False Breakouts
How often breakouts fell back into the range in our count of 1,472, and how to plan entry, stop and position size.
- Draw and trade trendlines
Trendline Trading: How to Draw Trendlines and Trade Them
How to draw trendlines with a fixed rule, four strategies for bounces, breaks and retests, and a real SPY line break without a lasting reversal.
- Use Fibonacci levels
Fibonacci Retracement Levels: How to Draw and Trade Them
How to calculate and draw retracement levels, trade pullbacks with confluence and a stop at the structure, and what a ten-year test says about the levels.
- Set Fibonacci targets
Fibonacci Extension: Levels, How to Draw It and Calculator
Three-point extension targets from the end of a pullback, why they differ from levels beyond 100%, a free calculator and three SPY swings, one without a single target reached.
- Trade gaps
Gap Trading Strategy: How to Trade Gaps and When Gaps Fill
Opening and full gaps, the four classic gap types, how often SPY gaps filled in our count since 2001, and plans for gap fill and gap and go.
- Calculate pivot points
Pivot Points: Formulas, Types and How to Trade Them
Formulas for standard, Fibonacci, Woodie, Camarilla and DeMark pivots, a free calculator, which session counts and a real SPY day.
- Swing trade
Swing Trading: 4 Strategies, Risk and Real Examples
Four swing trading strategies on the daily chart, position size, gap risk and US rules, with two hypothetical SPY pullbacks: one hit its target, one was stopped out.
- Identify market stages
Stage Analysis: Stan Weinstein's Four Market Stages
Stan Weinstein's four stages on the weekly chart, a Stage 2 checklist and two TSMC breakouts: one ran for a year, one gapped through its stop.
- Read Wyckoff ranges
Wyckoff Method: Accumulation, Distribution and Springs
Accumulation and distribution with phases A to E, springs and upthrusts as optional tests, and two real TSMC ranges read with and without hindsight.
- Trade Darvas boxes
Darvas Box Strategy: Rules, Entries and Stop Losses
The box rules step by step, when the edges become known, where the stop goes, and a mechanical test on TSMC in 2024 with two honest results.
- Count Elliott waves
Elliott Wave Theory: Rules, Patterns and Fibonacci
The five-wave pattern, three hard rules, zigzags, flats and triangles, Fibonacci ratios and a real DAX count, from the first German translator of the standard work.
- Interpret volume
Volume Analysis in Trading: How to Read Volume Honestly
What volume counts in stocks, futures, forex and crypto, how to read it against its own average, and our SPY test of high-volume days since 2001.