
Risk-Reward Ratio: Formula, Calculator, Break-Even Win Rate


Contents
- Risk-reward ratio in 30 seconds
- What is the risk-reward ratio?
- Example: the risk-reward ratio of a GBP/JPY trade
- Why the ratio alone does not work
- Risk-reward ratio and win rate together
- Advantages and limits of a high ratio
- Risk-reward ratio vs R-multiple
- How to measure the ratio in TradingView
- The ratio in stocks, options and crypto
- My conclusion on ratio, win rate and R-multiple
- Frequently asked questions about the risk-reward ratio
- About the author
The risk-reward ratio is one of the most quoted numbers in trading, and one of the most misunderstood. Many beginners think a higher ratio is always better. Others copy the rule “only take trades at 2:1 or 3:1” and apply it blindly. Both roads lead you astray, because the ratio is only half the calculation.
The ratio tells you how much you can win when a trade works, but not how often it works. Only together with the win rate does it become a number you can trade with. In this guide I show you the formula, a worked GBP/JPY example, the break-even table for each ratio, a free calculator and the TradingView tool that reads the ratio off the chart. This article follows our editorial policy.
Risk-reward ratio in 30 seconds
- Definition: the ratio compares the possible gain of a trade with its possible loss. Written reward first, 2:1 means the gain would be twice the loss.
- Formula: reward-to-risk = (target minus entry) ÷ (entry minus stop-loss). For a short trade, you turn both differences around.
- Two ways to write it: risk first, the same trade is 1:2. Both describe the same numbers, so always check which order a source uses.
- Break-even win rate: 1 ÷ (1 + reward-to-risk). At 2:1 that is 33.3%, at 3:1 only 25%, before costs.
- No good or bad ratio: 1.5:1 can make more money than 5:1 if the win rate fits. The ratio alone says nothing.
What is the risk-reward ratio?
The risk-reward ratio compares the planned profit of a trade with its planned loss; a reward-to-risk ratio of 2:1 means the target lies twice as far from the entry as the stop-loss.
The ratio is part of risk and money management, the question of how much you put on each trade and where you get out. You find the basics in the guide to risk management. The hedge fund manager Larry Hite described this mindset in his interview in Jack Schwager’s Market Wizards: he looks at risks, rewards and money, not at markets. That is exactly what the ratio forces you to do.
You read both parts straight from your trade plan. The risk is the distance between the entry and the stop-loss order, the order meant to close a losing trade at a set price. The reward is the distance between the entry and your target, often placed as a take-profit order. Both distances are measured in price, pips or points.
Divide the reward by the risk and you get the ratio. If the possible gain is 20 pips and the stop is 10 pips away, the reward-to-risk ratio is 2:1. For every dollar you risk, two dollars of profit are in view. A pip is the smallest usual price step in forex, for most pairs the fourth decimal place.
Risk-reward or reward-to-risk: why the order confuses traders
The same number goes by two names in English, and the order of the two parts flips the notation. Reward-to-risk puts the gain first: a trade that can win twice its risk reads 2:1. Risk-to-reward puts the risk first: the same trade reads 1:2.
In everyday use, “risk-reward ratio” is the name for both ways of writing it. One source writes 1:3, another writes 3:1, and both can mean the same trade. Even TradingView labels its tool “Risk/reward ratio” but, according to its guide to the long and short position tools, calculates (target minus entry) divided by (entry minus stop). A value of 2.16 there means a reward 2.16 times the risk.
So check the order before you compare anyone’s statistics. Neither the name nor a single decimal tells you the convention: 0.33 can be risk divided by reward, or a trade whose reward is only a third of its risk. Look for the formula or for which number is named first. Otherwise you may read a ratio the wrong way round. In this guide I write reward first (2:1), so a higher number means more planned reward per unit of risk.
The ratio is one of three pillars of risk management, next to the win rate and the position size. Without the ratio, even the best position sizing formula is worth little. Only the interplay of ratio and win rate decides whether a strategy stays profitable over many trades. The ratio also improves when you enter closer to the stop, which is the main argument for pullback trading.
Example: the risk-reward ratio of a GBP/JPY trade
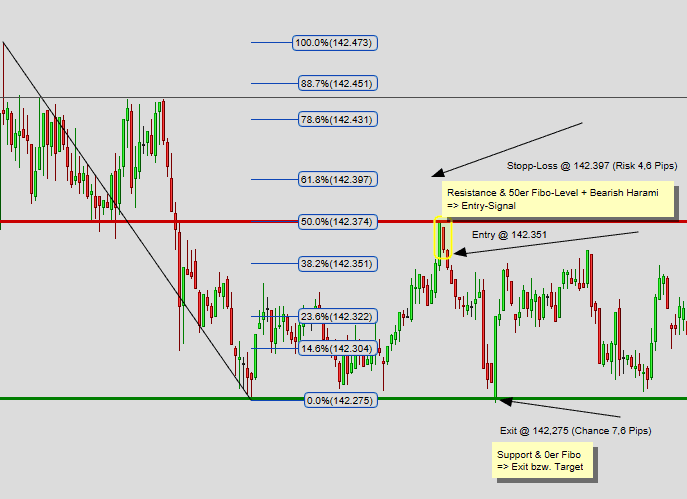
Let us work through a real trade in GBP/JPY; the same steps apply to stocks, indices and commodities. We go short, so we bet on falling prices. The entry signal is a bearish harami, a two-candle reversal pattern explained in the guide to candlestick patterns. It forms at the 50% level of a Fibonacci retracement, a typical place for countermoves to end.
The entry comes after the harami closes, at the 38.2% level. We place the stop at the 61.8% level, above the resistance around the 50% level. The target is the next support, here the 0% level of the Fibonacci grid.
 Click to enlarge
Source: Kagels Trading.
- Reward: entry (142.351) minus target (142.275) gives 7.6 pips.
- Risk: stop-loss (142.397) minus entry (142.351) gives 4.6 pips.
- Ratio: 7.6 divided by 4.6 gives about 1.65:1, or 1:1.65 written risk first.
The trade offers a reward-to-risk ratio of 1.65:1, and that is the point: it looks ordinary. In my own trading, most planned ratios lie between 1.5:1 and 3:1; that is a personal observation, not a market statistic. A distant 10:1 target is reached far less often than a near one.
Risk-reward calculator: try your own numbers
Enter entry, stop-loss and target, and the calculator shows the ratio and the win rate you need to break even. It works for long and short trades: a stop below the entry means long, a stop above means short. It also shows the same trade written risk first. The preset values are a simple long trade at $100.
Reward-to-risk ratio
2.00:1
You win 2.00 units for every unit you risk. Break-even needs 33.3% winning trades.
| Direction | Long (stop below entry) |
|---|---|
| Reward (entry to target) | 10.00 |
| Risk (entry to stop) | 5.00 |
| Same trade, written risk-first | 1:2.00 |
| Break-even win rate | 33.3% |
The ratio is only half the picture: compare the break-even win rate with the win rate your journal or backtest shows, after costs.
Enter prices in any unit: dollars, points or a currency rate. Use a dot as the decimal point (142.351) and commas only to group thousands (4,250.50). The break-even win rate is before commissions and spreads. Not investment advice. Nothing you enter is stored or sent.
Why the ratio alone does not work
Many trading books advise you never to take a trade below 2:1 or 3:1, and that rule leaves out the win rate. It sounds sensible, but a ratio of 3:1 does nothing for you if only one trade in ten works. Which trading books treat the topic properly is covered in a separate guide.
A flat 10:1 ratio is just as unrealistic. In theory the gain is ten times the risk. The practical question is different: how often does the price reach that distant target before it hits the nearby stop? Under real market conditions, the win rate drops with every step you push the target further away.
There are no good or bad ratios
It is a myth that some ratios are good and others bad; only the win rate settles it. A ratio of 1.2:1 with a 60% win rate clearly beats a ratio of 4:1 with a 15% win rate. The first earns about +0.32 times the risk per trade, the second loses about 0.25 times the risk.
A common mistake sits in the trade plan itself. Traders push the target further out or pull the stop closer to get a better ratio on paper. The arithmetic works. In practice the distant target is reached less often and the tight stop is hit more often. You move the problem instead of solving it. More of these errors are collected in the guide to trading mistakes.
You also cannot make up for a losing trade by simply raising the target on the next one. Trading is not plain arithmetic but a game of probabilities. If you do not know the probabilities of your own trading system, you calculate with placeholders.
Risk-reward ratio and win rate together
The win rate is the share of all trades that close with a profit. With 40 winners out of 100 trades, your win rate is 40%. Once you know your strategy, you soon get a feel for a realistic ratio, and from that you can calculate the win rate you need.
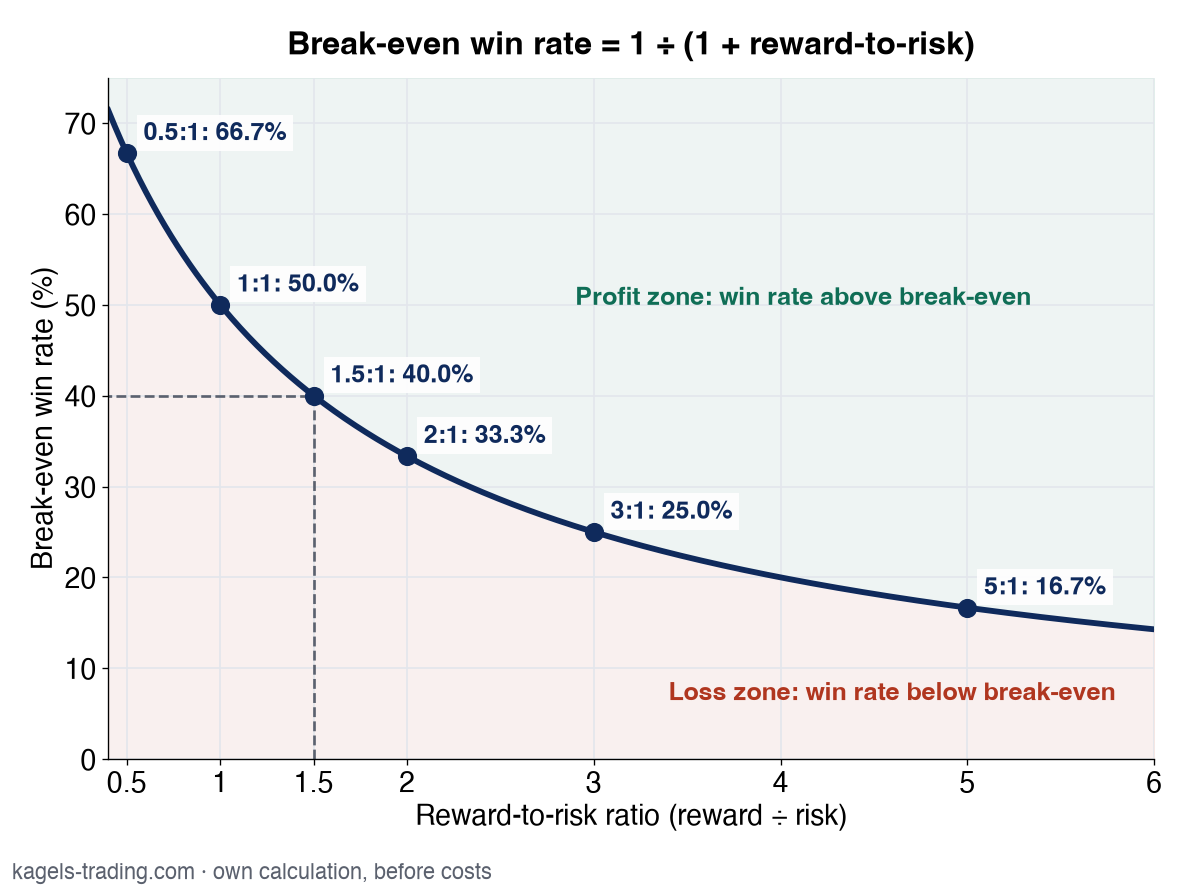
The break-even point, where gains and losses cancel out, follows from one formula, if every winner reaches the target and every loser exits at the stop. Break-even win rate = 1 ÷ (1 + reward-to-risk). Partial or early exits, gaps and costs change the real numbers; then you use your average realized win and loss instead of the planned ratio. If you know your win rate instead, turn it around: required reward-to-risk = (1 ÷ win rate) − 1. Both formulas describe the same relationship from two sides, before costs.
 Click to enlarge
Source: Kagels Trading, own calculation.
The table shows the minimum win rate for the common ratios. Below it, your system loses money before costs. Above it, every extra winner is profit. The values on the right are the break-even points, not targets.
| Reward-to-risk | What it means for you | Break-even win rate |
|---|---|---|
| 0.5:1 | You must win two trades out of three | 66.7% |
| 1:1 | Winners and losers cancel each other out | 50.0% |
| 1.5:1 | A common planning value in day trading | 40.0% |
| 2:1 | Only every third trade must be a winner | 33.3% |
| 3:1 | Three losers per winner are still break-even | 25.0% |
| 5:1 | High tolerance for losses, but few setups qualify | 16.7% |
The simplest case is 1:1, where you need more than 50% winners to make money. At exactly 50% you break even. Add commissions and spreads, and 50% is already a slow loss.
Now the same idea in dollars, as a hypothetical example before costs. Say your system produces 100 trades a month, the ratio is 1:1, the win rate is 50%, and you risk $500 per trade. At the end of the month nothing is left: (100 × 0.5 × $500 × 1) − (100 × 0.5 × $500 × 1) = $0.
Keep the win rate at 50% but raise the ratio to 1.5:1, and the result changes completely. With the same risk and the same number of trades, you end the month $12,500 up: (100 × 0.5 × $500 × 1.5) − (100 × 0.5 × $500 × 1) = $12,500. The whole difference comes from a ratio 0.5 higher. That is why it pays to look closely at where your target lies, for example at clear support and resistance levels or at Fibonacci extension targets once the price runs past all old highs.
Expectancy is the average profit or loss per trade of a trading system. It equals the win rate times the average win, minus the loss rate times the average loss. This is the number that counts in the end, and ratio and win rate are its two building blocks. How to turn it into a statistical advantage you can test is shown in the guide to the trading edge.
A high win rate alone is no protection either. Many winners can be wiped out by a few large losers if the losers are much bigger than the winners. The profit factor shows this balance in one number: the sum of all wins divided by the sum of all losses.
Advantages and limits of a high ratio
A high reward-to-risk ratio has real advantages, but it also has a price. The points below sum up what you gain and what you accept in return. Both sides belong to the decision which ratio fits your trading style.
Advantages of a high ratio
- A lower win rate is enough: at 3:1, 25% winners break even. You can be wrong more often without losing money.
- Less pressure in losing streaks: if you know that one winner covers three losers, you trade more calmly and break your rules less often.
- One trade can save the month: with a high ratio, big winners carry enough weight to balance a weak period.
- It forces clean planning: without a defined target and stop there is no ratio to calculate. The number disciplines your preparation.
Limits of a high ratio
- The win rate drops with it: the further away the target, the less often it is reached. The advantage on paper eats itself up in practice.
- Long losing streaks become normal: at a 25% win rate, and with independent trades, the chance of eight losses in a row from any given trade is about 10%. Over a few hundred trades you should expect such a streak, and few traders handle that without preparation.
- Fewer setups qualify: if you only take trades at 3:1 or better, you trade much less. With some strategies hardly any opportunities remain.
- It tempts you to fudge the numbers: pushing the target out or pulling the stop in improves the ratio at once, but not the result.
Risk-reward ratio vs R-multiple
Both numbers are closely related, but they look at different moments of a trade. The distance between entry and stop-loss is usually called 1R, your initial planned risk. A stop order does not guarantee its price: gaps, slippage and costs can make a real loss larger than 1R.
An R-multiple states how many times the initial risk a closed trade has made; a trade with 2R earned twice the amount that was at risk.
In the dollar example above, 1R was $500. If a trade makes $1,000, it has made 2R: $1,000 divided by $500. The same works with pips or points: if your initial risk was 10 pips and the trade brought 18 pips, that is 1.8R. R-multiples always refer to the initial risk.
The difference is the point in time. The ratio is a planned figure and exists before the entry. The R-multiple describes the actual result and exists after the exit. Both serve the same goal, which is why you can also work with R-multiples alone. The idea goes back to the trading coach Van K. Tharp.
I work only with R-multiples for that reason. What matters more is that you plan every trade in advance and know how much you risk and how you define it. One of the key rules in trading is to know your exit when you open the position, whether the trade runs for you or against you. Play through every scenario beforehand, including the right order types.
How to measure the ratio in TradingView
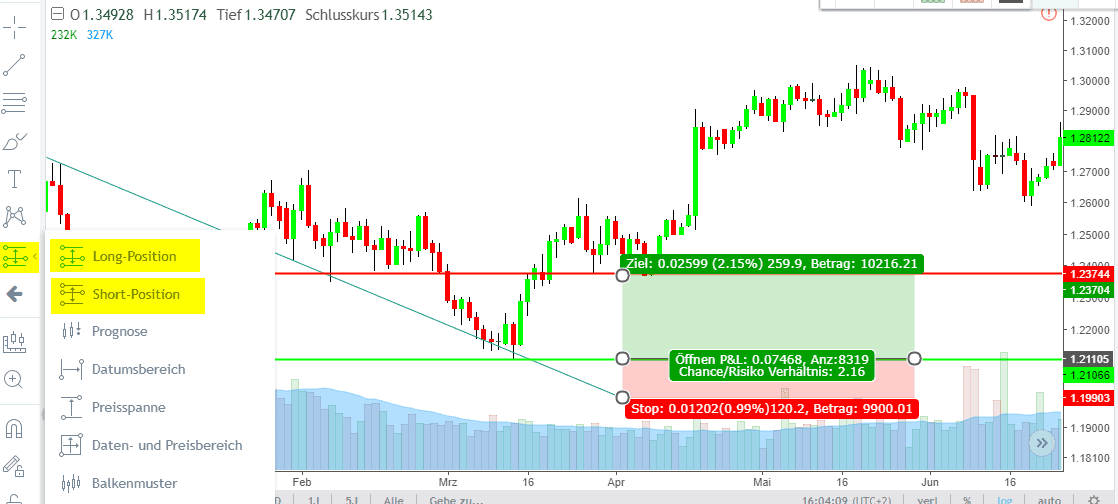
To avoid calculating the ratio by hand for every trade, I use the Long Position and Short Position tools in TradingView. They draw entry, stop and target as colored zones on the chart and show the ratio as you drag the levels. You find both in the left toolbar, in the group of forecasting and measurement tools. How the platform works in general is covered in the guide to using TradingView.
In the tool’s settings you also enter your account size and the risk per trade. You can give the risk as an amount or as a percentage of the account. The tool then calculates the position size at the same time, so it covers the planning steps from ratio to quantity.
 Click to enlarge
The example shows a daily chart with a long trade. The entry comes at 1.21105, after the price returns to retest the broken trendline from above. Before that, a doji forms with a green confirmation candle. The stop sits at the last swing low at 1.19903, and the target is the next daily resistance at 1.23704.
The account size is 10,000 and the risk is 1% per trade, so 100 is at stake. The tool works in your account currency and does not show its symbol. At the stop, TradingView shows 9,900, the account value after a loss. If the target is reached, 10,216 are in the account.
The tool calculates the ratio by itself and arrives at 2.16. The reward is 0.02599, the risk 0.01202, and 0.02599 divided by 0.01202 gives 2.16. The profit would be about 216: 100 of risk times 2.16.
A word on its limits: the tool only calculates what you give it. It does not tell you whether your target is realistic. That judgment stays with you, and it is the harder part.
The ratio in stocks, options and crypto
The formula is the same in every market, but realistic sizes differ a lot. If you carry the expectations from forex over to stocks one to one, you plan against reality.
In stock swing trading, with holding times of days to weeks, I often plan with ratios of 2:1 to 3:1; take that as an example, not a rule. Daily and weekly swings leave room for targets further away than in a single session. In day trading liquid index futures, the moves are shorter, and a planned 1.5:1 can be enough if the win rate supports it.
With options the calculation gets more complicated. When you buy an option, your possible loss is clearly limited to the premium you paid. But the gain depends not only on the price, it also depends on the time left and on volatility. A fixed ratio shows that only roughly and regularly underestimates how much time decay eats into the result. The basics are in options trading for beginners.
Leverage limits also shape where a stop can sit. They decide how large your position may be, and so, indirectly, how far away your stop can be placed. The current caps of the ESMA for European CFD clients and of the CFTC for retail forex in the US are listed in the guide to risk management linked above.
In crypto, the large daily swings make the ratios look attractive. The catch is the stop: if you set it tight, normal volatility stops you out before the move even starts. A neat 5:1 breaks even at 16.7% winners before costs; if the stop fires 85 times out of 100, the result is 0.15 × 5 − 0.85 = −0.10R per trade. Adjust the position size to the wider stop instead, as shown in the position sizing guide linked above.
My conclusion on ratio, win rate and R-multiple
Even though the ratio means little on its own, it is one of the basic parts of trading. You should plan every trade before you take it, and the reward-to-risk ratio belongs to that plan. The only thing you can control in trading over the long run is the risk.
After more than four decades in the markets, my experience is clear. If you know your ratio but not your win rate, you have half the information. If you know both but do not limit your risk per trade, you still lose. The three figures work together; none of them alone is enough for a decision.
Together with a solid win rate and clean money management, you have a good chance to trade profitably over the long run. That is why there is no way around the ratio. George Soros is often credited with the core of it: being right or wrong matters less than how much you make when you are right and how much you lose when you are wrong.
Frequently asked questions about the risk-reward ratio
What is the risk-reward ratio?
The risk-reward ratio compares the possible gain of a trade with its possible loss. You divide the distance from entry to target by the distance from entry to stop-loss. A reward-to-risk ratio of 2:1 means the possible gain is twice the possible loss.
How do you calculate the risk-reward ratio?
For a long trade: reward-to-risk = (target minus entry) ÷ (entry minus stop-loss). For a short trade, you turn both differences around. An example: entry at $100, stop-loss at $95, target at $110 gives 10 divided by 5, so a ratio of 2:1.
What is a good risk-reward ratio?
There is no ratio that is good for everyone, because it always depends on the win rate of your strategy. A ratio of 1.5:1 is profitable once your win rate is above 40%, before costs. A ratio of 3:1 does nothing if only one trade in ten works. What counts is the expectancy from both numbers together.
Is 1:2 the same as 2:1?
Usually yes: both describe a trade that can win twice what it risks. 1:2 is written risk first, 2:1 reward first. Check the order in each source, because a few authors write the ratio the other way round or give a single number such as 0.5.
What win rate do I need at a 2:1 ratio?
At a reward-to-risk ratio of 2:1, you need a win rate of 33.3% to break even, before costs. The formula is 1 ÷ (1 + 2) = 0.333. So only every third trade must be a winner. The exact threshold is 33⅓%; your win rate must lie far enough above it to cover costs, which can eat a small edge completely.
Can I make up for a losing trade with a higher ratio on the next one?
No, that is a common thinking error. If you raise the target of the next trade after a loss, you only move it on paper. The market does not reach it more often. The opposite is true: the win rate drops with every step the target moves further away.
How does the ratio help with risk management?
The ratio forces a complete trade plan before the entry. Where is the stop-loss, where is the target, and does the possible gain justify the risk? This discipline prevents impulsive trades without a defined loss limit. Together with a fixed risk of at most 1 to 2% of the account per trade, it forms the base of your risk management.
This US edition is based on our German edition on kagels-trading.de and has been adapted for US readers.
More Risk Management guides
- Manage your trading risk
Risk Management in Trading: Rules, Math, Psychology
The 1% rule, stops, risk/reward, daily loss limits, leverage caps and the psychology of losing streaks, with the math behind each rule.
- Understand a stock market crash
Stock Market Crash: Causes, Patterns and Lessons
What caused 1929, 1987, 2000, 2008 and 2020, how deep the S&P 500 fell, how long recovery took, and the lessons for your own risk.
- Calculate your position size
Position Sizing in Trading: Formula, Calculator, Examples
The formula, a free calculator, the 1% rule explained correctly, and examples for stocks, forex and futures.
- Set a stop from volatility
Volatility Stop Loss: ATR Trailing Stops and 8 Methods
Measure, multiple and anchor, eight methods from the Chandelier Exit to the Parabolic SAR, and an SPY test of intraday against closing triggers.
- Read your account equity
Account Equity vs Balance: Margin and Free Margin Explained
Equity against balance, margin, free margin and margin level, with a worked example and the close-out rules for cash, US margin and CFD accounts.
- Avoid a margin call
Margin Call: What It Is, How It Happens and How to Avoid It
When a margin call comes, what your broker does next, whether you can owe money, and four rules that keep your account away from it.
- Size your risk per trade
Kelly Criterion for Traders: Formula, Calculator, Risks
The Kelly formula for traders with a calculator, and a simulation of why full Kelly is far too much.
- Check a profit factor
Profit Factor in Trading: Formula, Calculator, Good Values
The formula, a free calculator, what a good value is, and why 61 trades showed 2.22 while 356 trades showed 1.37.
- Check if you have an edge
Trading Edge: How to Calculate, Test and Keep One
The expectancy formula, the win rate each reward-to-risk ratio needs, and the tests that separate a real edge from luck.
- Avoid costly mistakes
Trading Mistakes: 13 Costly Errors and How to Avoid Them
The 13 mistakes that cost accounts the most, the biases behind them, overtrading and revenge trading, and a checklist for your next trade.
- Build a trading mindset
Trading Mindset: How to Think Like a Disciplined Trader
Why traders sell winners too early and hold losers too long, what overtrading costs, and five habits that help you follow your plan.
- Keep a trading journal
Trading Journal: How to Record and Review Your Trades
What to write before and after each trade, a completed example with a win and a loss, a weekly review and a template to copy.
- Choose a journal
Best Trading Journal Software 2026: 6 Tools Compared
Six journals compared on price, free plans, refunds, automatic broker sync, costs and export, with a decision guide.
- Check TradeZella
TradeZella Review 2026: Pricing, Features and Limitations
The three plans since July 2026, what Essential leaves out, the no-refund terms, imports, export and what users report.
- Check TraderSync
TraderSync Review 2026: Pricing, Broker Sync and Limits
Plans and dated prices, broker imports and autosync, Market Replay, Cypher and the no-refund policy.
- Check Tradervue
Tradervue Review 2026: Imports, Reports and Costs
Silver or Gold, why net P&L needs Gold, few automatic imports, US-only stocks, the no-refund sign-up terms and how to cancel.
- Check Edgewonk
Edgewonk Review 2026: Features, Costs and Limitations
One feature set billed monthly or yearly, the refund period, MetaTrader auto sync, the psychology tools and our own test journal.
- Check TradesViz
TradesViz Review 2026: Pricing, Broker Sync, Terms
The free stock plan, Pro and Platinum prices checked November 10, 2026, which US brokers sync automatically, the no-refund terms and user reviews.