
Trading Journal: How to Record and Review Your Trades


Contents
- Trading journal in 30 seconds
- What is a trading journal?
- Before the trade: record the plan
- After the trade: record what happened
- A completed example: plan, execution and review
- Weekly review: choose one change to practise
- Useful metrics: what the numbers show and what they do not
- Spreadsheet or software: choose by workload
- Where the journal fits: practice, backtests and live trades
- Common mistakes with a trading journal
- Conclusion: write first, judge later
- Frequently asked questions about trading journals
- About the author
A trading journal turns your trades into something you can learn from. Your broker statement shows what you bought, sold and paid. It does not show why you took the trade, what you expected or whether you followed your own plan. That is the job of the journal.
I have kept records of my trades for more than four decades. I started with index cards and a pen and later moved to spreadsheets and software. The tool changed; the purpose did not: write down the decision before the result is known, then review it honestly. This guide shows how to do that, with a completed example you can copy. It follows our editorial policy.
Trading journal in 30 seconds
- What it records: your plan before each trade, what actually happened after it, and a short review.
- When to fill it in: the plan before the entry, the result right after the exit, the review once a week.
- Why it matters: memory rewrites trades after the fact. A written plan shows whether a decision was good, separate from whether the trade made money.
- What it cannot do: a journal does not create profits and does not prove an edge on its own. It shows you what to practise next.
- Tool: a spreadsheet is enough to start. Software helps once you trade often and want imports.
What is a trading journal?
A trading journal is a record of each trade that keeps the plan, the execution and your review side by side. It holds the hard facts, such as entry, exit, size and costs, and the reasons and conditions behind the decision. The combination is what makes it useful.
The difference to a broker statement is the “why”. The statement tells you the profit or loss. The journal tells you whether you traded your setup, whether you kept to your risk and what you were thinking. The statement documents results; the journal documents the process.
Before the trade: record the plan
The most valuable part of a journal is written before you know the outcome. Psychologists call the tendency to believe afterwards that you “knew it all along” hindsight bias. A plan written in advance protects you from it, because it cannot be adjusted to the result later.
Write these points down before the order goes in:
- Instrument and time: the symbol, the date and the time with its time zone, for example 10:05 New York time (ET). If you trade several markets, keep all times in one zone.
- Setup: the name of your setup and the evidence you can see now, such as a level, a trend or a pattern. Save a screenshot.
- Entry and invalidation: your intended entry and the price where the idea is proven wrong. That is where the planned stop goes.
- Size and risk: the position size (how to calculate it) and the amount you lose if the stop is filled at its price. This amount is 1R, the unit for all later results.
- Target or exit rule: a target price or the rule that ends the trade, for example “close at the end of day five”.
Mark whether a decision is inside your plan or breaks it. Discretion is not the same as breaking rules. Choosing between two valid entries, or skipping a signal because news is due, can be part of a written plan. Moving a stop further away or doubling the size is a plan violation. Record which one it was at the time you act, not after the result.
After the trade: record what happened
After the exit, add what really happened, and leave the original plan untouched. Note the actual fills, including partial entries and exits, every fee and commission, and the net result. Then save a second screenshot.
- Fills and costs: actual entry and exit prices, the number of shares or contracts, commissions, exchange fees and any financing costs for positions held overnight on margin.
- Partial exits: if you sold half at one price and half at another, record both and count them as one trade.
- Net result: the result after costs in your account currency, and in R.
- Plan followed? yes or no, and if no, what exactly was different.
- One sentence of review: what you would repeat and what you would change. Keep this separate from the plan you wrote earlier.
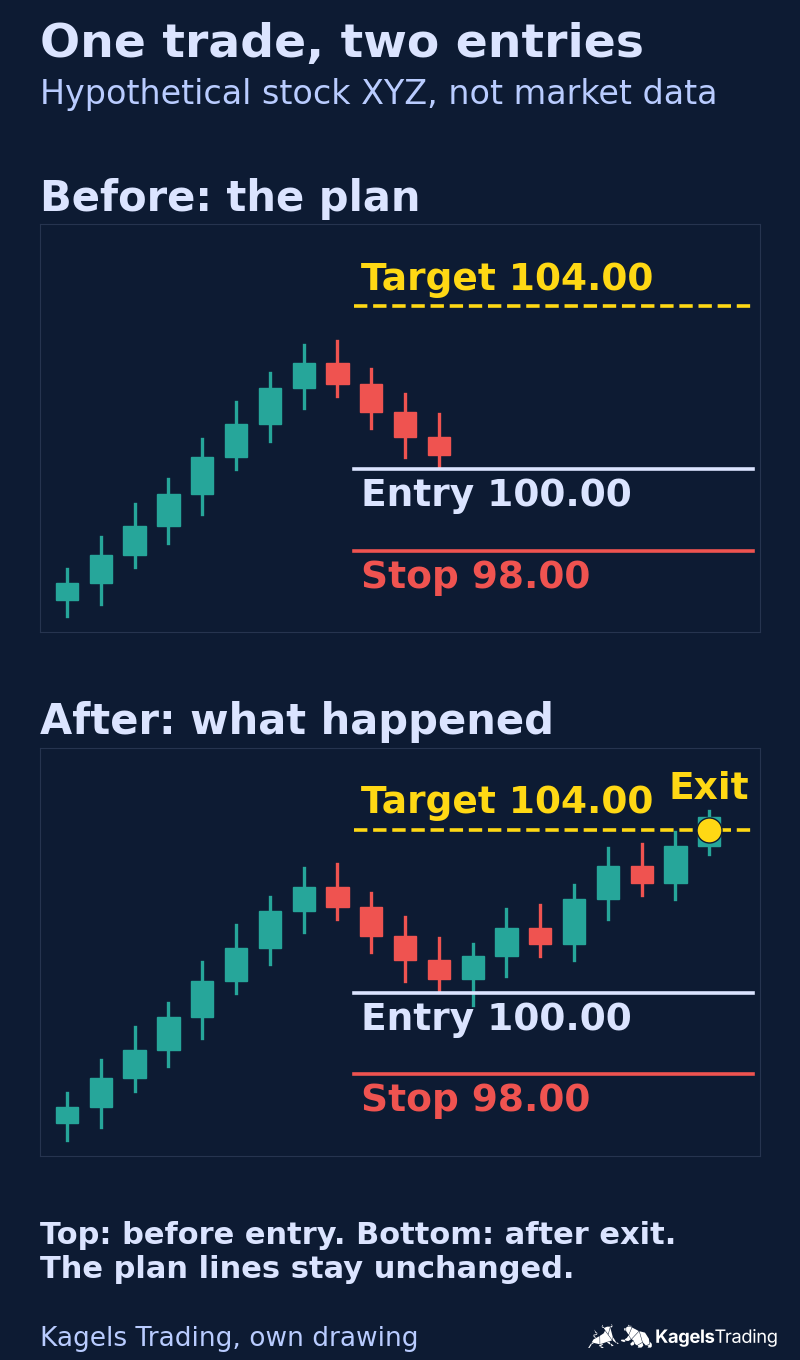 Click to enlarge
Source: Kagels Trading, own drawing.
A completed example: plan, execution and review
Here are two complete journal entries, one winner and one loser. Both are hypothetical: the symbols XYZ and ABC, the prices and the trades are invented for teaching. The fees assume $1 per order, so $2 for each round trip. All amounts are in US dollars.
| Field | Trade 1: XYZ | Trade 2: ABC |
|---|---|---|
| Setup | Pullback in an uptrend | Breakout from a range |
| Plan written | before entry, 10:05 ET | before entry, 11:40 ET |
| Direction and size | Long, 10 shares | Long, 20 shares |
| Planned entry | $100.00 | $50.00 |
| Stop hit | $98.00 | $49.00 |
| Initial risk (1R) | $20.00 | $20.00 |
| Target | $104.00 | $52.00 |
| Actual entry | $100.00 | $50.00 |
| Actual exit | $104.00, target | $48.50, stop after moving it |
| Gross result | +$40.00 | -$30.00 |
| Fees | $2.00 | $2.00 |
| Net result | +$38.00 | -$32.00 |
| Net result in R | +1.90R | -1.60R |
| Plan followed? | Yes | No: stop moved from $49.00 to $48.50 |
| Review | Repeat: entry and exit as planned. | Change: never move a stop further away. Planned loss with costs was -1.10R. |
Trade 1 shows how R is calculated. The initial risk is the distance from entry to planned stop times the size: ($100.00 minus $98.00) times 10 = $20. The trade made $40 gross and $38 net after $2 of fees. Net result divided by initial risk gives +1.90R. In this guide the R denominator excludes costs; whichever rule you choose, keep it the same for every trade.
Trade 2 lost more than planned because the plan was broken, not because the setup failed. With the stop at $49.00, the loss would have been $22 net, or -1.10R. Moving the stop to $48.50 cost another 0.50R. A good decision can lose money, and a bad one can win; the journal lets you tell them apart.
A planned stop is not a guaranteed loss limit. If the market gaps past your stop, a stop order can fill at a worse price. That is why the journal records the actual fill, not the planned one.
Do not copy this stock formula to futures or forex unchanged. For futures, multiply the price distance by the contract multiplier. For forex, convert the result into your account currency at the rate your broker used.
Weekly review: choose one change to practise
A journal that is never reviewed is only a list. A weekly review is a good routine to start with; some traders prefer every two weeks or every 20 trades. Choose a fixed time, for example the weekend when your markets are closed.
- Each tradeBefore the tradeWrite the plan: setup, entry, stop, size, target. Save a screenshot.
- Each tradeAfter the exitAdd fills, fees, net result in R, plan followed yes or no.
- Once a weekWeekly reviewGroup similar trades, check the exceptions, choose one change.
- PractiseNext weekTrade the same plan with that one change and record it.
A suggested routine, not a rule. What matters is that the plan is written before the result is known.
This is a complete hypothetical week of six trades, the two above plus four more. Every trade risked $20 (1R) and paid $2 in fees, so 1R equals $20 in every row.
| Trade | Plan kept? | Net R | Note |
|---|---|---|---|
| 1 Pullback | Yes | +1.90R | Target hit |
| 2 Breakout | No | -1.60R | Stop moved |
| 3 Pullback | Yes | -1.10R | Stop hit |
| 4 Pullback | Yes | +1.15R | Time exit |
| 5 Breakout | Yes | -1.10R | Stop hit |
| 6 Breakout | No | +0.30R | Early exit |
| Week | -0.45R |
The week ended at -0.45R, or -$9.00 after $12.00 of fees. That number alone says little. The review below says more.
Review the week in four steps.
- Separate decisions from results: the four trades that followed the plan made +0.85R; the two that broke it lost -1.30R.
- Check the exceptions: both plan violations were exits. One stop was moved away, one winner was cut without a rule.
- Group comparable setups, carefully: pullbacks made +1.95R and breakouts lost -2.40R this week. But both violations were breakout trades, and three trades per setup say nothing reliable about either setup.
- Choose one change: “Place the stop order at entry and do not move it further away; exit early only by a written rule.” Practise it next week and record whether you kept it.
Look at costs too. In this week the fees of $12 were 0.60R. Small accounts with many small trades often lose more to costs than they expect.
Useful metrics: what the numbers show and what they do not
Each metric is only as good as its definition, so write the definition down once. Keep the same costs, the same trade grouping and the same time window for every comparison.
- Net P&L: the result after all commissions, fees and financing costs, in your account currency. Week above: -$9.00.
- Result in R: net result divided by the initial risk. It makes trades of different sizes comparable. Week above: -0.45R.
- Win rate: winning trades divided by all closed trades. Decide once how you count a break-even trade. Week above: 3 of 6, 50%.
- Average win and average loss: in R, so you can see whether losses are larger than planned. Week above: +1.12R and -1.27R. An average loss above 1R points to costs, gaps or moved stops.
- Expectancy: the average net result per closed trade, here in R. Week above: -0.45R divided by 6 trades = -0.08R, or -$1.50 per trade. The same number follows from win rate × average win − loss rate × average loss: 0.5 × 1.12R − 0.5 × 1.27R.
- Profit factor: the sum of all winning trades divided by the sum of all losing trades, both after costs. Week above: 3.35R divided by 3.80R = 0.88. Below 1.0 the losses outweigh the gains; above 1.0 they do not, but that alone says nothing about how reliable the figure is.
- Drawdown: the largest fall from a peak in your running total of closed results. Week above: from +1.90R after trade 1 to -0.80R after trade 3, so 2.70R. How 61 journal trades fare against prop firm rules is shown in our prop firm drawdown test with real trades.
Three definitions cause most confusion. Trade grouping: a position built or closed in several parts is one trade, not several. Open trades: leave them out until they are closed, or list them separately. Sample window: say which period the numbers cover, so you compare like with like. Deposits and withdrawals are not results. Measure performance from the closed trades in the journal, not from the change in your account balance, and keep closed results apart from the open profit or loss in your account equity.
A short winning sample proves nothing. Even 30 trades are a starting point for spotting obvious errors, not proof of an edge. Results swing a lot by chance over small samples, and market conditions change. How to compare performance over years rather than weeks is shown in our guide to the best traders in the world by documented returns.
Spreadsheet or software: choose by workload
Start with the simplest tool you will actually use every day. A spreadsheet in Excel, Google Sheets or LibreOffice Calc costs nothing and lets you choose every column. The price is manual entry: every fill and fee has to be typed or pasted from your broker’s report.
A basic template only needs these columns, each in its own column of the sheet. The first group is filled in before the entry, the second after the exit:
- Plan: Date, Time (with zone), Symbol, Setup, Direction, Size, Planned entry, Planned stop, Initial risk (1R), Target or exit rule, Inside plan or violation, Screenshot before.
- Result: Actual entry, Actual exit, Fees, Net result, Net R, Plan followed (yes/no), Screenshot after, Review.
Dedicated journal software makes sense once manual logging takes too long. Tools such as Edgewonk, Tradervue, TraderSync or TradeZella can import trades from many brokers, by file upload or a direct connection, and build reports from them. Our reviews check what each one supports, what it costs and where its limits are, and our trading journal software comparison puts six tools side by side.
Whatever you use, check four things before you trust it:
- Imports: does it support your broker and your instruments, and does it import fees and partial fills correctly?
- Reconciliation: can you match its totals against your broker statement for the same period?
- Export: can you take your complete data with you in a common format if you leave?
- Time zones and currency: are times and amounts shown the way your account records them?
Where the journal fits: practice, backtests and live trades
Keep backtests, simulated trades and real trades apart in your journal. A backtest checks rules on past data (see our backtesting guide), a simulation checks your decisions in real time without money, and only live trades show how you act with money at risk. Mixing them makes every statistic meaningless.
You can start before your first real trade. Use the same journal fields for paper trading on TradingView, and record manual tests with Bar Replay in TradingView the same way. Clear setup definitions help too: the guides to support and resistance and price action trading show how to describe a level or a signal in words you can check later.
Common mistakes with a trading journal
- Missing costs: leaving out fees and financing makes results look better than your account. Record them for every trade.
- Editing the original plan: once the result is known, the plan stays as written. Insights go into a separate review field.
- Inconsistent trade grouping: counting partial exits as separate trades inflates the win rate.
- Only logging winners: the losing trades usually teach the most. Every trade belongs in the journal.
- Collecting without reviewing: data that nobody looks at changes nothing. Put the weekly review in your calendar.
- Treating a short winning streak as proof: a few good weeks say little. Judge a setup on many trades, after costs.
Conclusion: write first, judge later
The core of a journal is simple: plan before, facts after, review once a week. The tool matters much less than the habit. Start with the template above, record the plan before each trade, add the net result in R after the exit and pick one change each week.
A journal will not make you profitable on its own. What it can do is show you, in your own handwriting, which decisions you make well and which mistakes you repeat. In my experience, that is the information most traders are missing.
Frequently asked questions about trading journals
What should a trading journal include?
At minimum: the plan before the trade and the facts after it. The plan covers setup, entry, stop, size and target; the facts cover fills, fees, the net result in R and whether you followed the plan. A screenshot before and after and one sentence of review complete the entry.
How do I make my own trading journal?
Open a spreadsheet and use the column list in this guide as the first row. Fill in the plan columns before each trade and the result columns after it. Add a weekly tab where you sum the net R by setup and by “plan followed”.
Is there a free trading journal?
Yes, a spreadsheet costs nothing and is enough for most traders who start. Some journal software also offers free plans with limits. Check the current terms on the provider’s own pricing page, because plans change often.
How often should I review my trading journal?
Once a week is a practical starting routine. Fill in each trade on the same day, then review in a fixed slot when your markets are closed. Very active traders may prefer a short daily check plus the weekly review.
How many trades do I need before I can judge a setup?
There is no fixed number. Around 30 trades can be enough to spot obvious execution errors, but not to prove that a setup has an edge. The fewer trades, the larger the role of chance.
What is the difference between a trading journal and a broker statement?
The statement records results, the journal records decisions. Your broker statement is the official record of fills and costs, and you should reconcile your journal against it. The journal adds what the statement cannot: the plan, the reasons and whether you kept to them.
This article was written by Karsten Kagels, a discretionary price action trader. The German edition was reviewed by Christian Möhrer; the examples are new to this English edition. All trades, symbols and prices in the examples are hypothetical and were invented to explain the method; they are not trades I executed and not a statistic. This is educational content, not investment advice. Trading involves the risk of loss.
This English edition is based on our German edition on kagels-trading.de and has been adapted for international readers.
More Risk Management guides
- Manage your trading risk
Risk Management in Trading: Rules, Math, Psychology
The 1% rule, stops, risk/reward, daily loss limits, leverage caps and the psychology of losing streaks, with the math behind each rule.
- Calculate your position size
Position Sizing in Trading: Formula, Calculator, Examples
The formula, a free calculator, the 1% rule explained correctly, and examples for stocks, forex and futures.
- Size your risk per trade
Kelly Criterion for Traders: Formula, Calculator, Risks
The Kelly formula for traders with a calculator, and a simulation of why full Kelly is far too much.
- Choose a journal
Best Trading Journal Software 2026: 6 Tools Compared
Six journals compared on price, free plans, refunds, automatic broker sync, costs and export, with a decision guide.
- Check TradeZella
TradeZella Review 2026: Pricing, Features and Limitations
The three plans since July 2026, what Essential leaves out, the no-refund terms, imports, export and what users report.
- Check TraderSync
TraderSync Review 2026: Pricing, Broker Sync and Limits
Prices and the yearly sale, which of 502 brokers really sync automatically, Market Replay, Cypher and the no-refund policy.
- Check Tradervue
Tradervue Review 2026: Imports, Reports and Costs
Silver or Gold, why net P&L needs Gold, automatic import for 5 of 82 brokers, US-only stocks and how cancelling works.
- Check Edgewonk
Edgewonk Review 2026: Features, Costs and Limitations
One plan at $197 a year with a 14-day refund, MetaTrader auto sync, the psychology tools, and screenshots from our own test journal.