
Bull Trap vs Bear Trap: How to Spot a Trapped Market


Contents
- Bull trap vs bear trap in 30 seconds
- What is a bull trap?
- What is a bear trap?
- Bull trap vs bear trap: the differences at a glance
- Why trapped traders move the market
- How to spot trapped traders: two signs
- Real example: bull trap in SPY, February 2025
- Real example: bear trap in SPY, November 2025
- A trap that failed: SPY, November 2025
- How to trade a bull trap or a bear trap
- A simple trap rule on SPY: what it did since 2024
- How to avoid getting caught in a trap
- Conclusion: think like the trapped trader
- Frequently asked questions about bull traps and bear traps
- About the author
A breakout, everybody jumps in, and price turns straight back: that is a bull trap. The bear trap is its mirror image. Both tend to appear at levels that many traders watch, where many of them can end up on the wrong side at the same moment, with their stop-loss orders close by.
I have traded at support and resistance since 1980, and trapped traders are one of the most useful things a chart can show you. In this guide I explain what a bull trap and a bear trap are, the two signs that traders are trapped, how to trade the move that follows, and how to protect yourself. Real SPY examples show both traps on a daily chart, including one that failed, and a simple count shows how a plain trap rule did on SPY since 2024.
Bull trap vs bear trap in 30 seconds
- A bull trap is a breakout above resistance that fails. Buyers who bought the break are suddenly in a losing position and have to sell.
- A bear trap is a breakdown below support that fails. Short sellers who sold the break have to buy back, and their buying lifts the price.
- The difference is only the direction. A bull trap catches buyers above a high, a bear trap catches sellers below a low.
- Two signs point to trapped traders. First a move that gives traders hope at a level, then a quick rejection at that same level.
- The trade comes when the trapped traders give up. Their exits can push price in your direction. A stop beyond the failed break defines your risk.
What is a bull trap?
A bull trap is a move above a resistance level that looks like a breakout and then falls back below the level, leaving the buyers of the break with losses.
The trap needs a level that many traders watch. That can be an old high, the top of a range or a round number. When price closes above it, breakout traders buy and short sellers cover. Then the buying dries up, price closes back below the level, and the new buyers sit on a loss. You can read more about how such levels form in our guide to support and resistance.
Is a bull trap bullish or bearish? It starts bullish and ends bearish. The first move up is what lures buyers in. The trap is complete only when price is back below the level. From that point the trapped buyers become sellers, because every one of them needs to sell to get out.
What is a bear trap?
A bear trap is a move below a support level that looks like a breakdown and then rises back above the level, leaving the sellers of the break with losses.
It works the same way, only upside down. Below an obvious low sit the stops of buyers and the sell orders of traders who want to short the break. When these orders are filled and no new selling follows, price climbs back above the low. The short sellers now have to buy to close their positions, and that buying adds fuel to the rally. If you want to see what happens on the short side in more detail, read our guide to short selling.
Bull trap vs bear trap: the differences at a glance
| Bull trap | Bear trap | |
|---|---|---|
| Level | Resistance, old high | Support, old low |
| False move | Close above the level | Close below the level |
| Who is trapped | Buyers of the breakout | Sellers of the breakdown |
| What they must do | Sell | Buy back |
| Move that follows | Down | Up |
| Your trade | Short or exit a long | Long or cover a short |
Both traps are special cases of one pattern: a breakout that does not hold. Traders also call it a false breakout or fakeout. In our count of 1,472 breakouts in three stock indexes, 68.4 % closed back inside the range within ten trading days, as shown in our guide to breakout trading. Not every one of them turned into a strong move the other way. That is why the signs below matter.
Why trapped traders move the market
The idea is to enter when trapped traders start to realize they are wrong. They close their positions, and many of them turn around. A trapped buyer sells, and some sell short as well. These orders can push price in the direction you want, so the trap gives you timing, not just a direction. Price data cannot show you who is actually exiting. The trapped trader is an interpretation of the chart, not something you can see in the order book.
The pressure comes from stops and from pain. Some trapped traders have stop orders just beyond the failed break. When price reaches them, the stops turn into market orders and can speed up the move. Others hold on and hope, then sell later on the next weak bounce. Both groups can add to the same move. Our guide to the liquidity sweep shows how traders read these stop clusters at obvious levels.
A trap and a liquidity sweep overlap, but they describe different things. A liquidity sweep looks at the orders: price trades through a level where stops are likely to cluster, often within one bar. A trap looks at the positions: traders entered on the break and now sit on a loss. A trap can include several closes beyond the level, as in the February 2025 example below, while a sweep usually closes back inside on the break bar itself.
The idea of looking for the trapped side comes from Galen Woods. Galen is the price action trader behind Trading Setups Review, and his article How to find and profit from trapped traders is the source of the two signs in the next section. His point: do not ask when you want to enter, ask when the other side gets into trouble. I use the same question in my own trading, and the wording and examples here are mine.
How to spot trapped traders: two signs
There is no single pattern that defines a trap, but two signs come back again and again. You need both, in this order. The first sign gives traders a reason to act. The second one takes it away.
Sign 1: a move that gives traders hope at a level
Before a trap, price has to make traders confident. They must believe that the level will break. Look for:
- Several strong bars in a row toward the level, closing near their highs (or lows for a bear trap).
- Gaps toward or through the level.
- Outside bars (a bar whose high and low are both beyond the previous bar) that break through the level.
- Closes beyond the level, ideally more than one, so the break looks confirmed.
Sign 2: the level rejects price at once
Then the market has to take that hope away quickly. The faster and the more often price is pushed back, the more traders are stuck. Look for:
- Pin bars with a long wick through the level and a close back inside.
- A failed close: price trades beyond the level during the day but closes back on the other side.
- A close back inside after one or two closes beyond the level.
- Rising volume on the bar that returns. It can mean that many traders are leaving, but volume does not show whether a trade closes a position or opens a new one. Our guide to volume analysis explains how to read volume against its own average.
Many traders also check the momentum. If price makes a new high but the RSI does not, the move up has less force behind it. That is a hint, not a signal on its own. Our guide to the RSI indicator shows how to read such a divergence.
Real example: bull trap in SPY, February 2025
 Click to enlarge
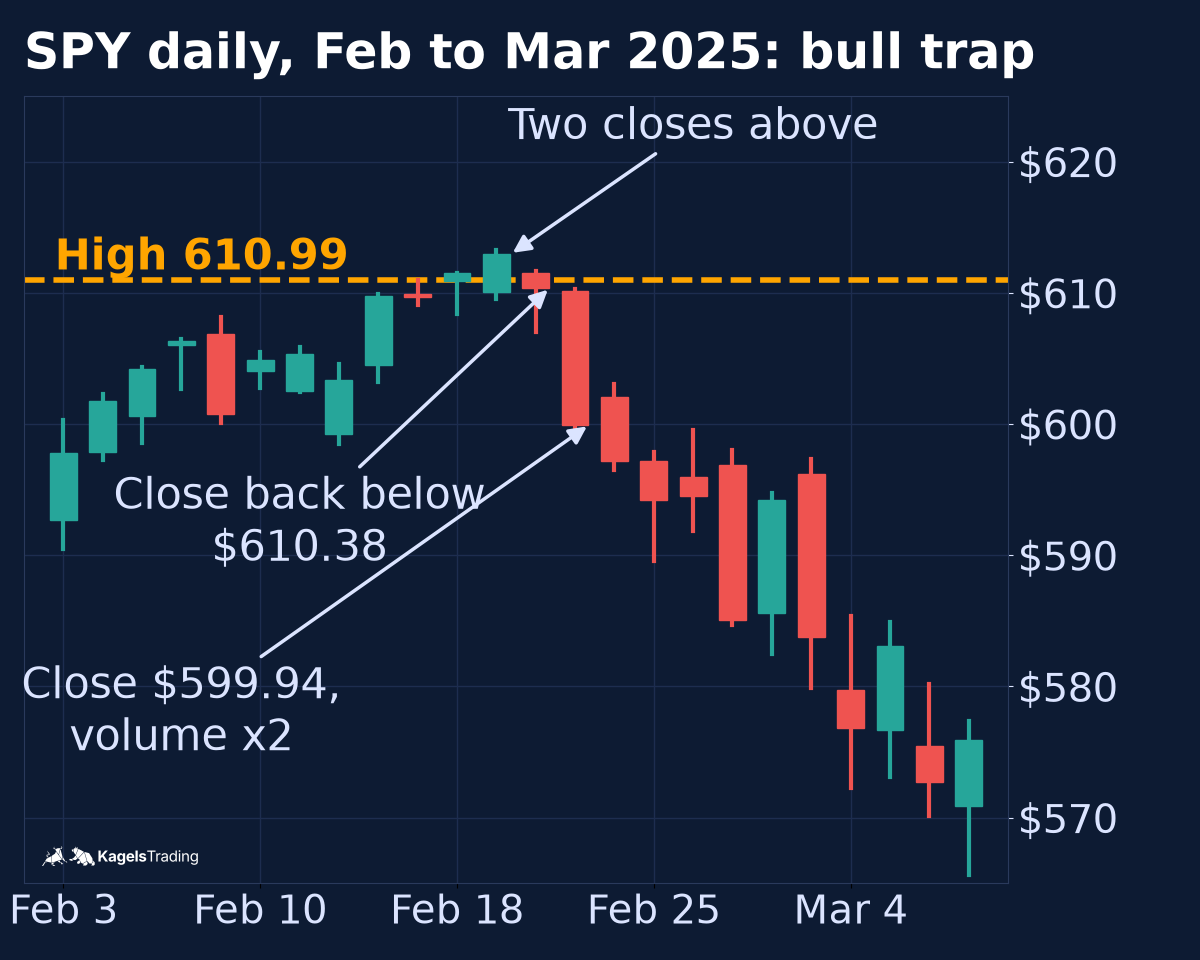
In February 2025 SPY gave buyers two closes above resistance, then took them away. The level was the February 14 high at $610.99. SPY closed above it on February 18 at $611.49 and on February 19 at $612.93. That was sign 1: two closes above an obvious high, and breakout buyers felt confirmed.
Sign 2 followed the next day. On February 20 SPY closed back below the level at $610.38. On February 21 it fell to $599.94 on 76.5 million shares, about twice the volume of the day before. The buyers from the breakout were now below their entry, and price kept falling. Their exits may have added to the selling, but daily price and volume data cannot identify their orders.
The move that followed was large. SPY reached a low of $572.25 on March 4, about 6.3 % below the old high, and $549.68 on March 13, about 10 % below it. A trader who sold after the close back below the level, with a stop above the February 19 high of $613.23, had a small and clearly defined risk. These are distances to later lows, seen after the fact, not the result of a trade plan. The plan and its result follow below.
We chose this example and the next one on purpose. We searched SPY for closes beyond a 20-day high or low that returned within three days, and then picked cases that were followed by a reversal of at least 3 %. They show what the pattern looks like. They do not tell you how often it works. For that, see the count further down, which uses every signal and no such filter.
Real example: bear trap in SPY, November 2025
 Click to enlarge
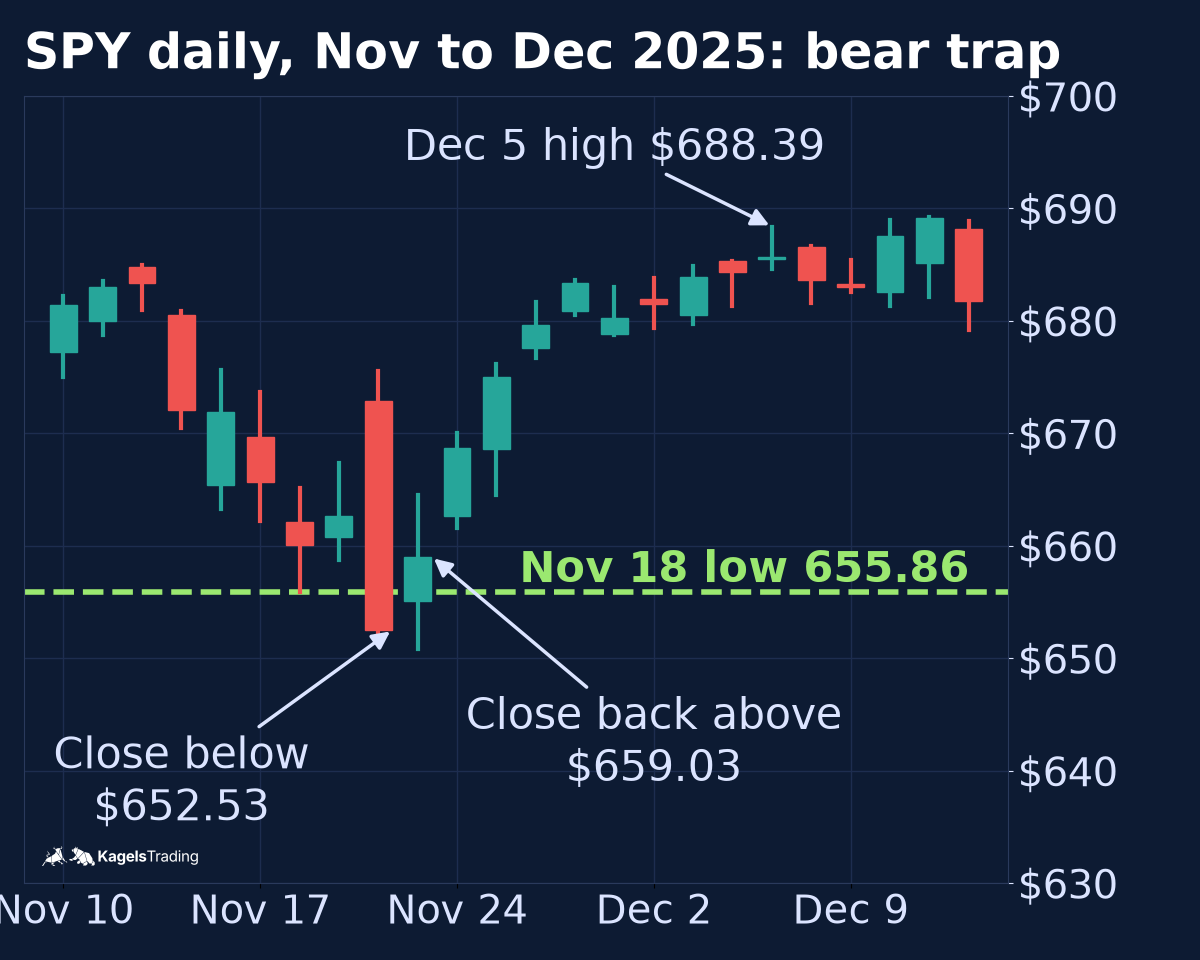
In November 2025 SPY trapped the sellers below support. The level was the November 18 low at $655.86. On November 20 SPY opened higher at $672.91, then fell all day and closed below support at $652.53. Volume was 165.3 million shares, about twice its 20-day average. For sellers this was sign 1: a strong bar down that closed below an obvious low.
The rejection came one day later. On November 21 SPY closed back above the level at $659.03. Sellers who had shorted the break were now above their entry. Over the next days SPY rose and traded at $688.39 by December 5, about 5 % above the support level. Short covering may have helped, but the daily data cannot prove it.
A long trade after the close back above support had a clear stop. It went below the November 21 low of $650.85, the lowest point of the failed break. Here too, this is one example from the past. A different week could have shown a second break lower, and that is what the stop is there for.
A trap that failed: SPY, November 2025
Two days earlier, the same chart shows a bear trap signal that did not work. On November 18 SPY closed at $660.08, below the November 7 low of $661.21. On November 19 it closed back above, at $662.63. By the rules in the next section, that was a long signal: entry at the next open on November 20 at $672.91, stop one cent below the November 18 low at $655.85.
The stop was hit on the same day. SPY fell from its open and traded down to $651.89 on November 20, so the trade lost one full risk unit. The large gap up at the open had also made the risk wide, almost $17 per share. Only the next close back above support, on November 21, produced the winning signal shown above. Traps often look like this in real time: the first attempt fails and costs you a planned loss.
How to trade a bull trap or a bear trap
You trade the trap only after it is complete, never in advance. A level that holds for now can still break tomorrow. These steps keep the decision simple:
- Mark the level before the break: the old high, old low or range edge that everybody can see.
- Wait for sign 1: a break that looks convincing, ideally with a close beyond the level.
- Wait for sign 2: a close back inside, a pin bar or a quick failure. No close back inside, no trade.
- Enter in the direction of the trapped traders’ exits: short after a bull trap, long after a bear trap. The two common entries, the next open or a break of the rejection bar, give different prices and different trades. Pick one and keep it.
- Place the stop beyond the extreme of the failed break. If price goes there again, the trap idea is wrong.
- Size the position from the stop, not from your hopes. Our guide to position sizing shows how.
- Decide the exit before you enter: a profit target, a time limit, or both.
Expect losing trades. Some failed breaks turn around again and run in the original direction. A gap can also take price past your stop, so the loss can be larger than planned. Our guide to the stop-loss order explains why a stop does not guarantee its price.
A simple trap rule on SPY: what it did since 2024
To show what a plain rule does, we applied one fixed plan to every signal on SPY. It is a small historical count, not a strategy I recommend. The rules were written before we looked at the results, and we did not change them afterwards:
- Signal: a daily close above the highest high of the previous 20 sessions (bull trap) or below the lowest low (bear trap), followed by a close back inside within three sessions. Signals in the same direction that lead to the same entry day count as one trade.
- Entry: the next open, short after a bull trap, long after a bear trap.
- Stop: one cent beyond the extreme of the failed break.
- Exit: a target at twice the risk (2R), or the close of the tenth session, whichever comes first. If stop and target fall on the same day, the stop counts. A gap beyond the stop or target is filled at the open.
| Trade (SPY daily) | Trades, winners | Average |
|---|---|---|
| Short after bull trap | 34, 9 | -0.20R |
| Long after bear trap | 18, 9 | +0.26R |
| All | 52, 18 | -0.04R |
The plain rule did not show a positive edge on SPY in this period. The count runs from February 2024 to November 11, 2026. Across 52 closed trades the average was -0.04R, before costs. Shorts after bull traps lost on average in a rising market, and longs after bear traps did better. The simple standard error is about 0.19R over all trades and 0.33R for the 18 longs, so even the +0.26R is not a reliable sign. Some trades overlapped in time, so these errors are only a rough guide. R is the planned risk per trade. Both examples above were winners under this plan: the February short reached its target on February 21, the November long on December 5. The failed November signal lost 1R.
What this count does not say. It covers one market, one timeframe and less than three years, with no trend filter and no costs or slippage. Data: Yahoo Finance, split-adjusted closes without dividends; one trade opened on November 10, 2026 was still open and is left out. If you want to trade traps, write your own rules down and test them, for example with our guide to backtesting. The two signs above are a way to read the chart, not a signal you can trade blindly.
How to avoid getting caught in a trap
The simplest protection is to wait for confirmation before you buy a breakout. A close beyond the level is better than an intraday spike. A retest of the broken level that holds is better still. You will miss some moves, and you will avoid many traps.
Ask where the other traders stand. Before you enter a breakout, think about who bought or sold the same level and where their stops are. If the obvious entry is crowded, the obvious stop is crowded too. That makes it a likely target for a trap.
Keep a stop and a size you can live with. A trap costs little when the loss is small and planned. It costs a lot when you hold a losing breakout and hope. Read our guide to risk management for the full routine.
Conclusion: think like the trapped trader
Do not ask when you want to enter, ask when the other traders get nervous. Put yourself in their place: where did they buy, where are their stops, and what will they do if price turns against them?
A trap is complete when hope and rejection meet at the same level. You see a convincing break, then a fast return. That is the moment the trapped side starts to leave, and it is the moment you can act, with a stop beyond the failed break.
This is market analysis, not investment advice. Every trade can lose money, and past examples do not show what will happen next time.
Frequently asked questions about bull traps and bear traps
What is a bull trap in simple terms?
A bull trap is a breakout above resistance that fails. Buyers who bought the breakout end up with a loss when price falls back below the level, and their selling often pushes price lower.
What is a bear trap in trading?
A bear trap is a breakdown below support that fails. Traders who sold or shorted the break are caught when price climbs back above the level, and their buying often lifts price higher.
Is a bull trap bullish or bearish?
It looks bullish at first and turns bearish. The first move above resistance attracts buyers. Once price is back below the level, those buyers must sell, which makes the outcome bearish.
What is the difference between a bull trap and a bear trap?
Only the direction is different. A bull trap catches buyers above an old high and leads to a move down. A bear trap catches sellers below an old low and leads to a move up.
How can I tell a bull trap from a real breakout?
You can only tell for sure afterwards. Warning signs are a quick close back below the level, a pin bar at the level, rising volume on the way back and a momentum indicator that does not confirm the new high.
Can bull traps and bear traps be predicted?
Not reliably, but you can prepare for them. You know in advance which levels are obvious and where stops are likely. You decide only after the rejection has happened.
Do bull traps and bear traps happen in all markets?
Yes, they appear wherever traders watch the same levels. That includes stocks, indexes, futures, forex and crypto, on intraday charts as well as on daily and weekly charts.
Are traps only relevant for day traders?
No, they matter on every timeframe. Day traders see them on 5-minute charts, while swing traders and investors meet them on daily and weekly charts, for example at a yearly high.
This US edition is based on our German edition on kagels-trading.de and has been adapted for US readers.
More Chart Techniques guides
- Draw key levels
Support and Resistance: How to Draw and Use Key Levels
Where useful levels come from, how to draw zones with a stated rule and how to turn a level into a trade plan.
- Read price action
Price Action Trading: How to Read Charts Without Indicators
Market structure, key zones and three bar patterns, with a core setup and a real SPY example where the signal failed.
- Read candlestick charts
How to Read Candlestick Charts: Body, Wicks and Context
Open, high, low and close in one candle, body and wicks, two real Gold candles read step by step and how often patterns really occur.
- Know candlestick patterns
Candlestick Patterns: 10 to Know, Tested on Real Data
Ten patterns with rules and a cheat sheet, counted on DAX, S&P 500, EUR/USD and Gold since 2014: most are rare, none is a signal on its own.
- Combine timeframes
Multi-Timeframe Analysis: A Weekly and Daily Workflow
How to combine the weekly chart for context and the daily chart for entry under one stated rule, with a documented SPY case from June 2025.
- Trade pullbacks
Pullback Trading: Entries, Stops and Failed Setups
Pullback or reversal, limit against confirmation entry, and one fixed rule set on three real QQQ cases: a target, a stop and a cancelled setup.
- Trade sideways ranges
Range Trading: Boundaries, Orders and Two Documented Fades
A 14-session rule to draw horizontal boundaries, three order-type variants and two Alpaca-verified SPY fades, one that reached the target and one that was stopped out.
- Read chart formations
Chart Patterns: Reversals, Continuations and Failures
Reversal, continuation and bilateral formations with the measured-move convention per pattern and two documented SPY rectangle cases.
- Trade breakouts
Breakout Trading Strategy: Entries and False Breakouts
How often breakouts fell back into the range in our count of 1,472, and how to plan entry, stop and position size.
- Draw and trade trendlines
Trendline Trading: How to Draw Trendlines and Trade Them
How to draw trendlines with a fixed rule, four strategies for bounces, breaks and retests, and a real SPY line break without a lasting reversal.
- Use Fibonacci levels
Fibonacci Retracement Levels: How to Draw and Trade Them
How to calculate and draw retracement levels, trade pullbacks with confluence and a stop at the structure, and what a ten-year test says about the levels.
- Set Fibonacci targets
Fibonacci Extension: Levels, How to Draw It and Calculator
Three-point extension targets from the end of a pullback, why they differ from levels beyond 100%, a free calculator and three SPY swings, one without a single target reached.
- Trade gaps
Gap Trading Strategy: How to Trade Gaps and When Gaps Fill
Opening and full gaps, the four classic gap types, how often SPY gaps filled in our count since 2001, and plans for gap fill and gap and go.
- Calculate pivot points
Pivot Points: Formulas, Types and How to Trade Them
Formulas for standard, Fibonacci, Woodie, Camarilla and DeMark pivots, a free calculator, which session counts and a real SPY day.
- Swing trade
Swing Trading: 4 Strategies, Risk and Real Examples
Four swing trading strategies on the daily chart, position size, gap risk and US rules, with two hypothetical SPY pullbacks: one hit its target, one was stopped out.
- Identify market stages
Stage Analysis: Stan Weinstein's Four Market Stages
Stan Weinstein's four stages on the weekly chart, a Stage 2 checklist and two TSMC breakouts: one ran for a year, one gapped through its stop.
- Screen for growth leaders
CAN SLIM: William O’Neil’s Seven Rules for Growth Stocks
William O'Neil's seven CAN SLIM criteria with thresholds, his selling rules, a free screen with real counts and what the tests really show.
- Read Wyckoff ranges
Wyckoff Method: Accumulation, Distribution and Springs
Accumulation and distribution with phases A to E, springs and upthrusts as optional tests, and two real TSMC ranges read with and without hindsight.
- Trade Darvas boxes
Darvas Box Strategy: Rules, Entries and Stop Losses
The box rules step by step, when the edges become known, where the stop goes, and a mechanical test on TSMC in 2024 with two honest results.
- Count Elliott waves
Elliott Wave Theory: Rules, Patterns and Fibonacci
The five-wave pattern, three hard rules, zigzags, flats and triangles, Fibonacci ratios and a real DAX count, from the first German translator of the standard work.
- Understand Smart Money Concepts
Smart Money Concepts (SMC): What They Are and What Holds Up
The seven SMC building blocks, BOS vs CHoCH vs MSS, one labeled SPY sequence that held, one that failed, and what a chart can and cannot show.
- Understand ICT trading
ICT Trading: Silver Bullet, Killzones and What Holds Up
Michael Huddleston's Inner Circle Trader method: Silver Bullet, Judas Swing, the 2022 model and killzones in New York time, with one SPY setup that worked and one that failed.
- Trade order blocks
Order Blocks: How to Spot, Draw and Trade the Zone
The three conditions behind a valid order block, entry and stop at the zone, two SPY cases from 2026 and a 25-year count where a fixed rule lost money.
- Trade fair value gaps
Fair Value Gap (FVG): How to Spot, Trade and Test It
The three-candle rule, bullish, bearish and inverse FVG, two SPY cases from 2026 and a 25-year count of how often gaps were revisited and traded.
- Trade inverse fair value gaps
Inverse Fair Value Gap (IFVG): Rules, Examples and a Test
When a broken gap counts as inverted, three entry styles, one SPY retest that held, one that failed, and a 25-year test with trend and sweep filters.
- Trade failed breakouts with Turtle Soup
Turtle Soup Trading: Raschke Rules, ICT Version and a Test
Linda Raschke's original rules, Turtle Soup Plus One and the ICT version side by side, two SPY examples and a 25-year test on SPY and QQQ.
- Read a break of structure
Break of Structure (BOS): Rules, CHoCH vs MSS and a Test
Which swing counts, BOS vs CHoCH vs MSS under one stated convention, two SPY breaks that won and lost, and a 25-year test against ordinary days.
- Read a change of character
Change of Character (CHoCH): Rules, BOS vs MSS and Data
The first close against the trend, close versus wick, CHoCH vs BOS vs MSS, two SPY cases and what the trend did next after 287 CHoCHs on SPY and QQQ.
- Read a market structure shift
Market Structure Shift (MSS): Rules, BOS vs CHoCH and Data
MSS as a CHoCH with a sweep and a fair value gap, the comparison with BOS and CHoCH, two 2021 cases and what 14 daily MSS on SPY and QQQ did next.
- Draw supply and demand zones
Supply and Demand Trading: Zones, Rules and Real Data
Base and departure rules, the four base patterns, how zones differ from order blocks and SMC, two SPY cases and a fixed test of 86 zone trades on SPY and QQQ.
- Read liquidity sweeps
Liquidity Sweep: How to Spot It and Trade the Reversal
Sweep or run, buy-side and sell-side liquidity, internal and external targets, SPY reversal, continuation and failed-reversal examples and a 25-year count of a fixed sweep rule.
- Interpret volume
Volume Analysis in Trading: How to Read Volume Honestly
What volume counts in stocks, futures, forex and crypto, how to read it against its own average, and our SPY test of high-volume days since 2001.