
Range Trading: Boundaries, Orders and Two Documented Fades


Contents
- Range trading in 30 seconds
- What range trading is
- How to identify a range: the 14-session rule
- Order types for range entries
- Where the stop goes
- Range width versus costs
- Optional indicators, as filters
- One SPY fade that reached its target (2023-12 to 2024-01)
- One SPY fade that was stopped out (2021-06)
- Range trading and other setups
- Checklist and limits
- Frequently asked questions about range trading
- About the author
Range trading is fading a boundary that holds, until the day it does not. This guide uses a stated 14-session rule to draw the boundaries, three order-type variants to enter, and two documented SPY fades, one that reached its target and one that was stopped out. This article is educational, not personal advice. This article follows our editorial policy.
Range trading in 30 seconds
- A range is a horizontal band drawn by rule: the maximum high and the minimum low of the last 14 trading sessions, both frozen at the end of the window.
- Three order types, three jobs. A resting fade limit for an untested boundary, a retest limit after an observed rejection, and a stop order for the break. They are not interchangeable.
- The protective stop and the close-based invalidation are different orders. The first is a resting broker order; the second is a decision at a bar close.
- A documented case is one window, not a win rate. The two SPY cases below are illustrations of one rule, not a backtest.
- Range width sets the room for the target. Judge the plausible net reward after spread, commissions and slippage against the planned risk; a wide range is no guarantee of a profit.
What range trading is
 Click to enlarge
Source: Kagels Trading, own drawing.
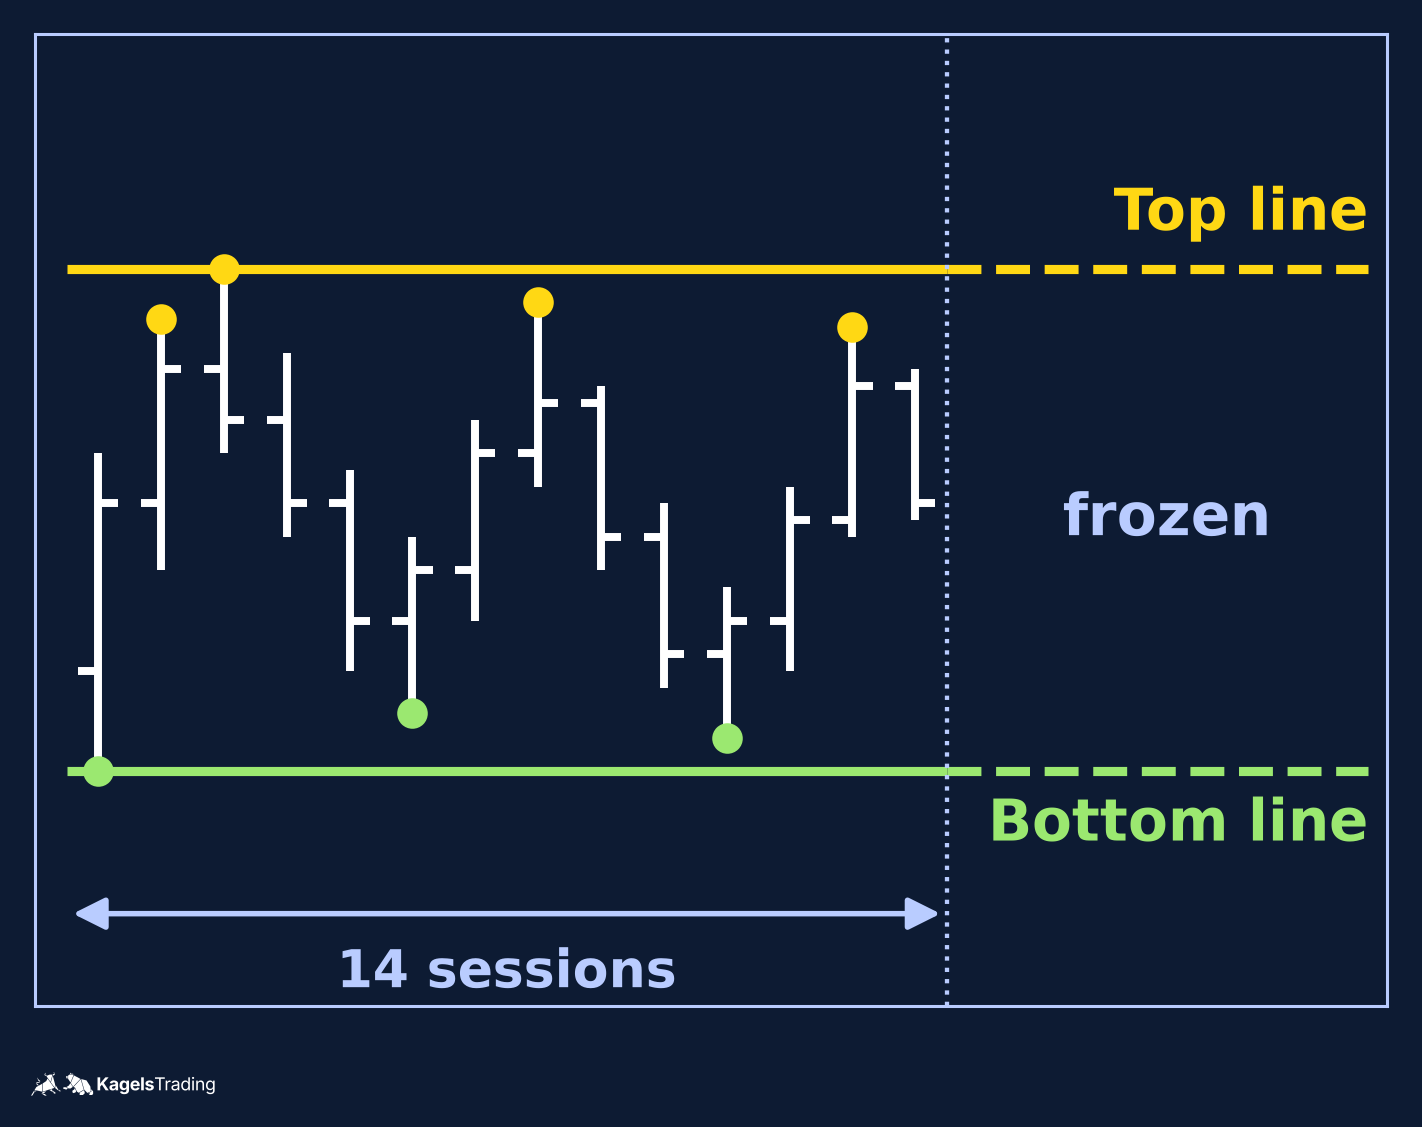
Range trading is a plan for a market moving between a horizontal top and a horizontal bottom. The idea is that price has been rejected at the upper boundary and accepted at the lower boundary, and the trader fades each rejection in the hope that the pattern continues one more time.
What range trading is not is a label for anything that looks sideways on a chart. A clear horizontal band is a special case. Many sideways-looking charts turn out to be slow trends, choppy breakouts or news-driven resets; the point of the rule below is to decide which case the trader is looking at.
How to identify a range: the 14-session rule
A horizontal range is drawn by a stated rule, applied to the last 14 trading sessions. The rule used in this guide is deliberately mechanical, so that it can be applied to a chart without judgement and so that its examples can be audited by any reader with the same data.
- Window length. The last 14 trading sessions, both inclusive.
- Top line. The maximum high in the window.
- Bottom line. The minimum low in the window.
- Touch rule. Within the window, at least two sessions have a high at or above 99.6 percent of the top line, and at least two sessions have a low at or below 100.4 percent of the bottom line.
- Trend filter. The least-squares slope of the daily closes, divided by the mid-price, is at most 0.07 percent per session in absolute value.
- Width filter. The width (top minus bottom) divided by the mid-price is between 2 and 4.5 percent.
- Freeze. The top and the bottom are frozen at the end of the 14th session. New bars do not change them.
The 14-session rule is a convention, not a universal definition. Other authors use longer or shorter windows and tighter or looser touch tests. Pick one rule, state it before the first trade, keep it for the whole range.
Order types for range entries
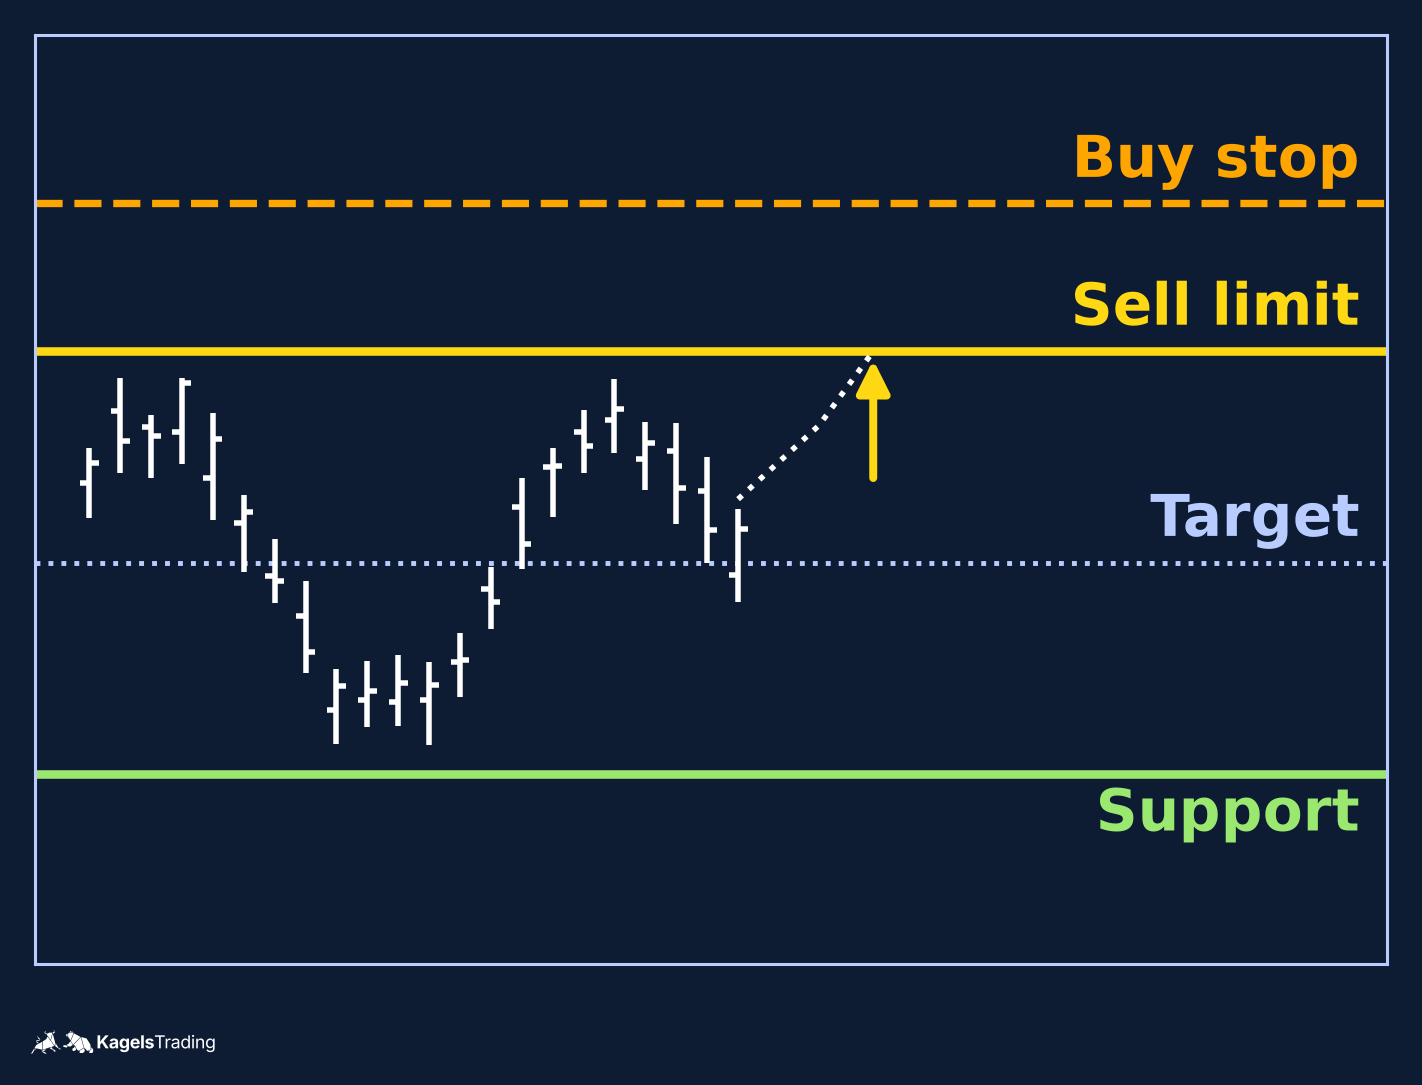
The right order type comes from what the trader is waiting for. A resting fade limit waits at an untested boundary; a retest limit waits for an observed rejection; a stop waits for the break. Mixing the three variants up turns the plan into a surprise.
Resting fade limit at an untested boundary
 Click to enlarge
Source: Kagels Trading, own drawing.
- To fade at resistance (short): a resting sell limit at the top line, which is an offer to sell at that price or higher. The order can fill before any rejection has occurred.
- To fade at support (long): a resting buy limit at the bottom line, an offer to buy at that price or lower.
- The protective buy stop (short fade) or sell stop (long fade) sits outside the range at the entry side.
- Both order types are stated separately: a close-based invalidation at a daily close back outside the range in the entry’s direction can act as a second exit rule, decided at the close and placed as a market order at the next session open.
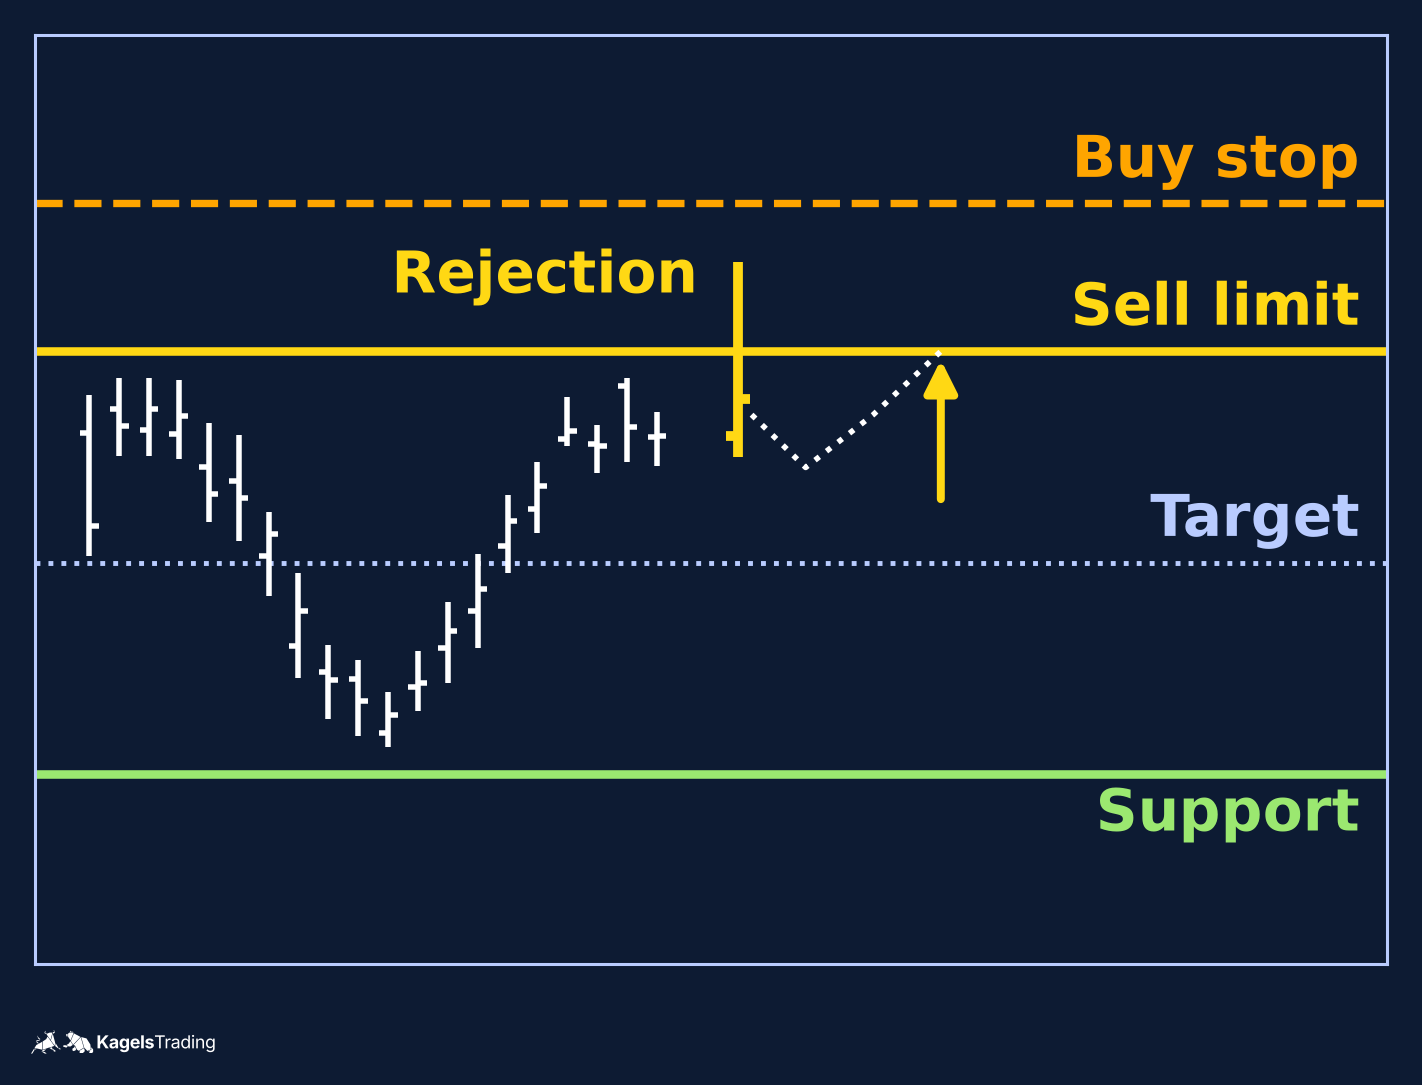
Retest limit after an observed rejection
 Click to enlarge
Source: Kagels Trading, own drawing.
- A retest fade of the top waits for a bar whose wick exceeded the top line and whose close is back inside. The retest sell limit is placed at the former top line, offering to re-sell on a return to the line.
- A protective buy stop sits outside the rejection wick’s extreme.
- A reversal confirmation on one bar is not evidence that a fill which happened before that bar was correct in hindsight.
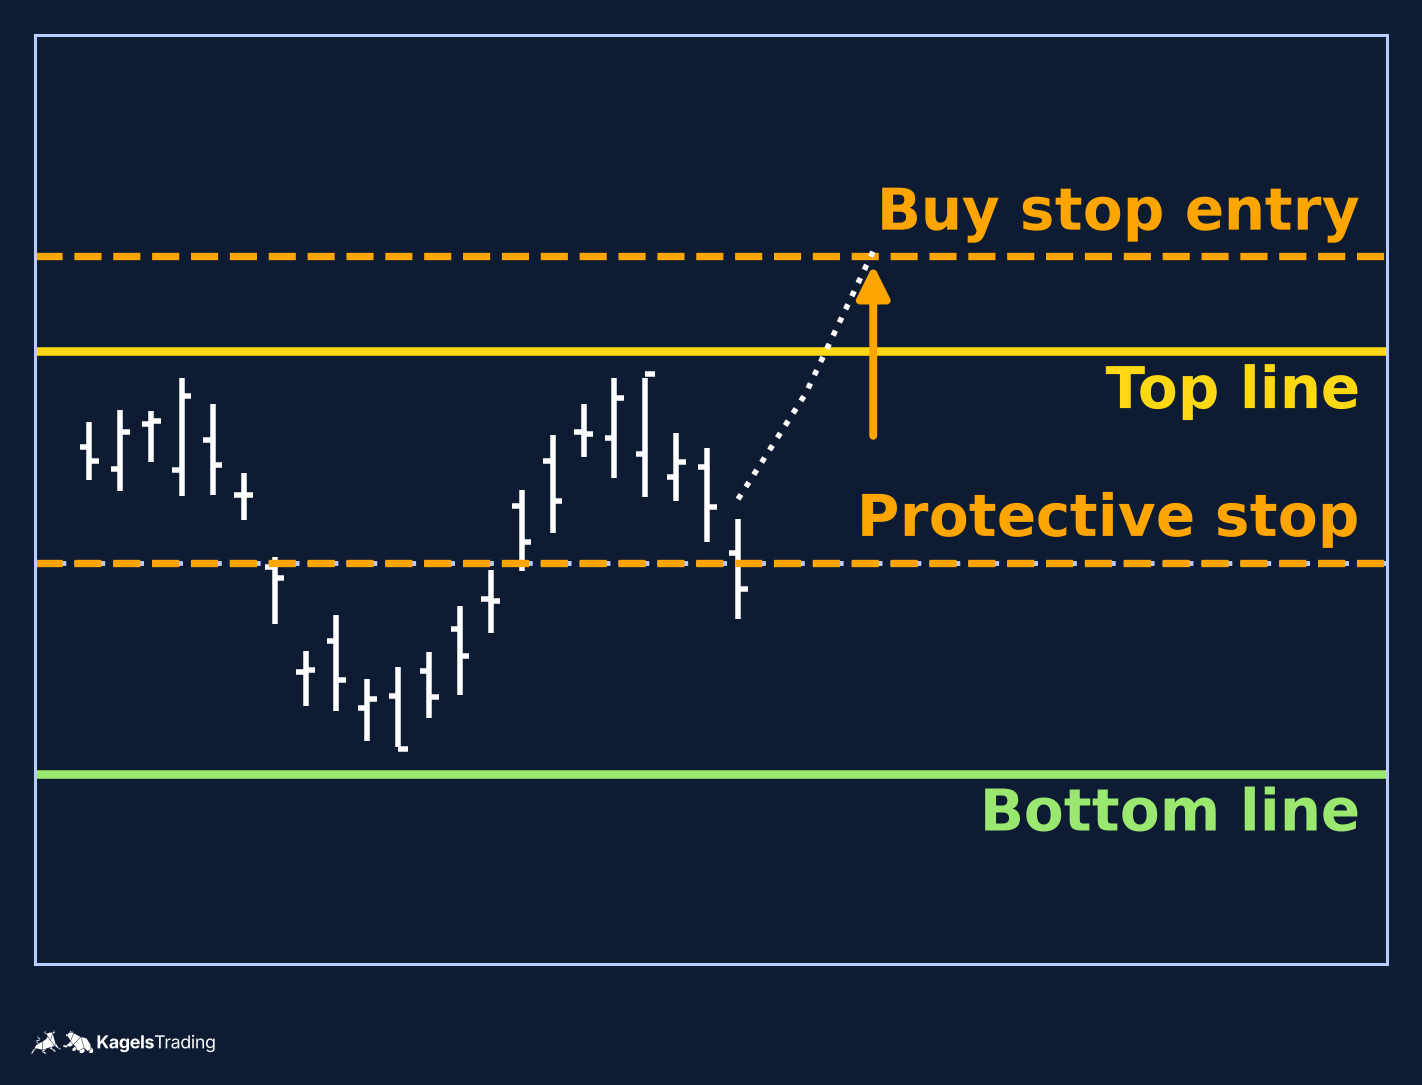
Stop order through the confirmation level
 Click to enlarge
Source: Kagels Trading, own drawing.
- A buy stop above the top line is an order that becomes a market order when price trades at or above the stop price. The fill price is not guaranteed and can be worse than the stop in a fast market or at a gap.
- A sell stop below the bottom line is the mirror case.
- These are the mechanics breakout traders use. A buy limit above the current ask is not a breakout order: it is marketable at once and fills at the best available price up to the limit, without waiting for any break.
Where the stop goes
The stop sits outside the range at the entry side, at a price written before the trade. On a short fade at the top line, the protective buy stop in this guide is placed at the top line plus 25 percent of the range width. On a long fade at the bottom line, the protective sell stop is placed at the bottom line minus 25 percent of the range width. These numbers are a convention, not a measurement.
Planned cash risk is position size multiplied by stop distance. Tightening the stop in points, without changing the position size, reduces the planned cash risk. The common mistake is a different one: traders tighten the stop and increase the position size by the same factor, so the planned risk looks the same. A gap or slip through the stop then costs more per point, because the position size is bigger. One worked example: planned risk 100 dollars; stop 2 dollars wide at size 50 shares; a one-dollar gap through the stop costs 50 dollars extra. Same planned risk at a one-dollar stop and size 100 shares; the same one-dollar gap costs 100 dollars extra.
The Average True Range (ATR) on a timeframe uses the previous bar’s close on that timeframe. True range includes the gap from the previous close to the current open, so ATR is sensitive to overnight moves. ATR is a scale, not a guarantee.
Range width versus costs
Judge the net reward after costs against the planned risk. The target distance grows with the range width, and the spread, commissions and slippage come off it. The stop distance sets the planned risk and, with it, the position size. A ten-point SPY range and a two-point SPY range are the same pattern with very different net numbers, and neither width guarantees a profit.
From the middle of the range, there is no room on either side. A mid-range fade needs the full lower half for the target and the full upper half for the stop; the reward-to-risk collapses toward one-to-one before costs.
Optional indicators, as filters
Indicators can describe a range; they do not define one. The Relative Strength Index, Bollinger Bands and the Average Directional Index are the usual choices. ADX below 25 is the usual rule of thumb for “no strong trend”; it is a convention, not a measurement that separates a range from random drift.
If an indicator is in the plan, use it to refuse trades, not to force them. “ADX is high, so skip” is a rule. “The pattern looks fine so the indicator does not matter” is not. The number of indicators is a matter of taste; keep the plan simple enough to apply the same way every time.
One SPY fade that reached its target (2023-12 to 2024-01)
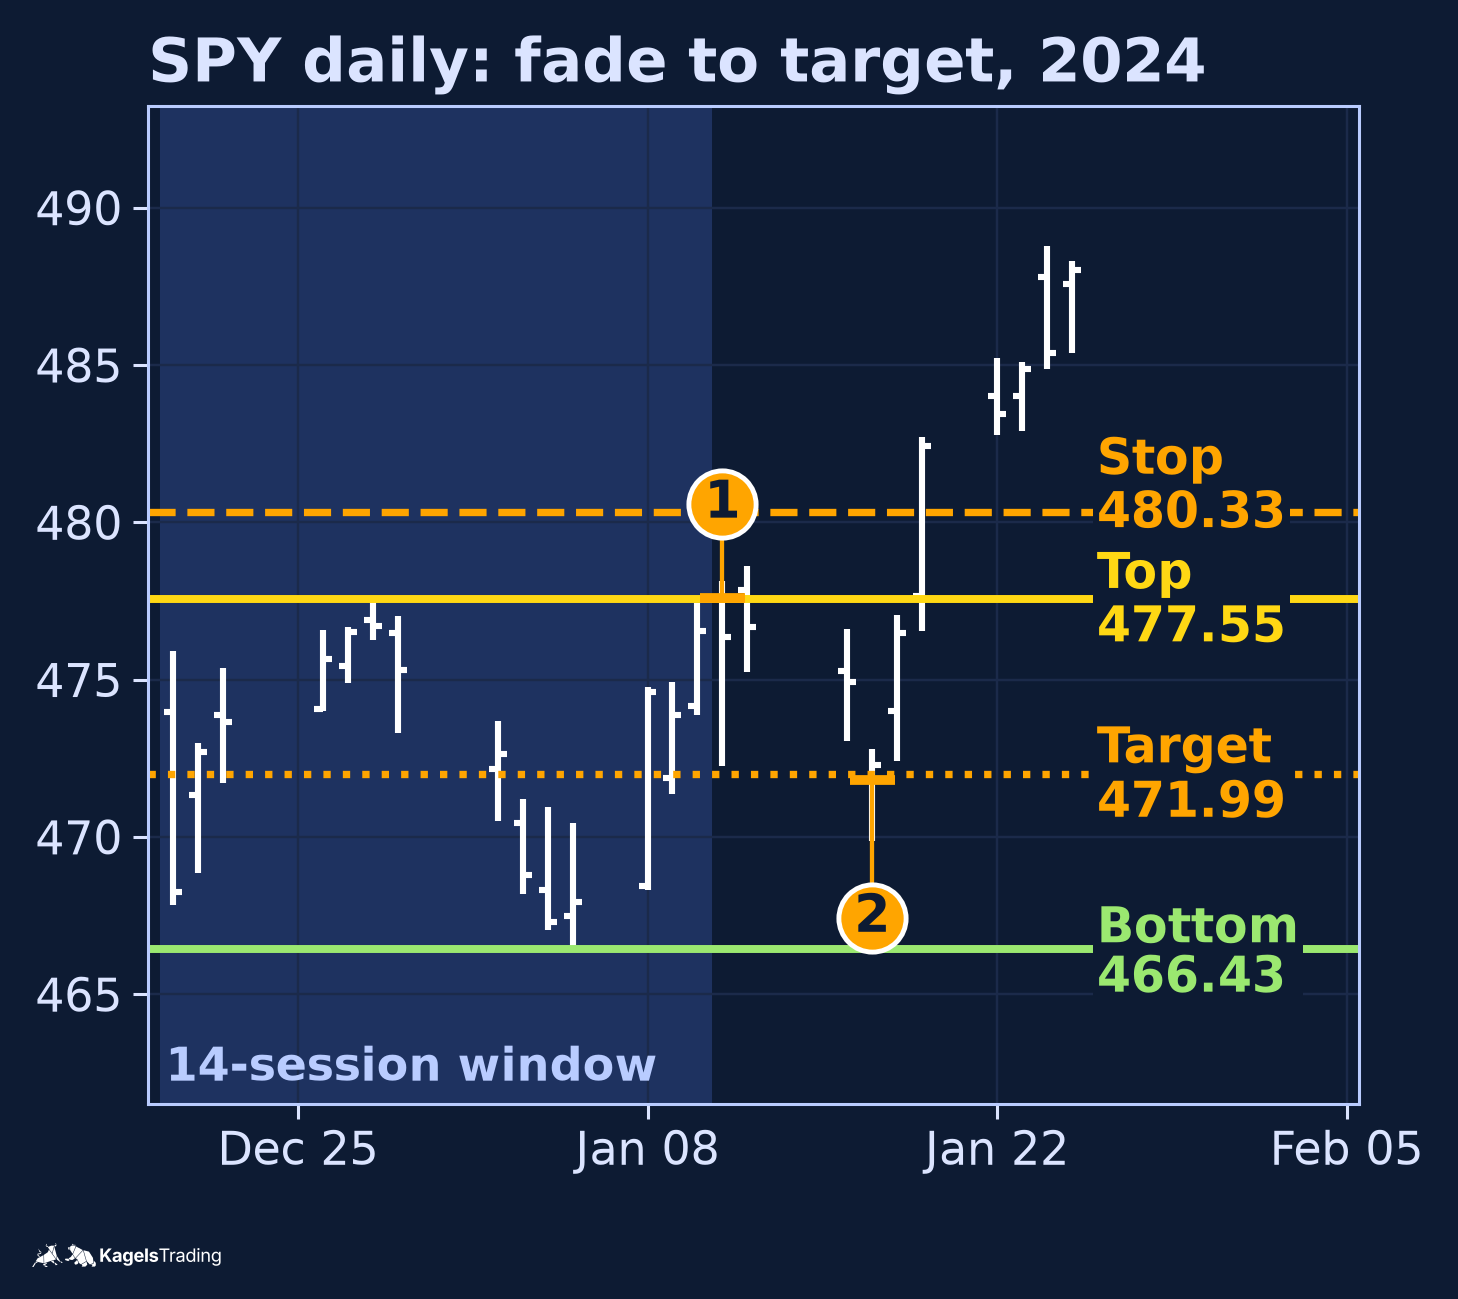 Click to enlarge
Illustrative execution rule, written before the chart
- 14-session window: 2023-12-20 to 2024-01-10 (both inclusive). Top line = window high 477.55 on 2023-12-28. Bottom line = window low 466.43 on 2024-01-05. Width 11.12 points. Boundaries frozen at the end of the window.
- Resting short sell limit at 477.55, active for the next session only. The limit participates in the next US cash opening auction and in the regular session that follows. On a qualifying open (an open at or above the limit price), the limit is assumed to fill at the opening print, so the hypothetical fill price is the open or 477.55, whichever is higher. The limit stays live until the end of that session, after which it is cancelled.
- Protective buy stop at 477.55 plus 25 percent of width equals 480.33, activated only after the sell limit is filled. A stop touch converts the stop into a market order; a gap through the stop fills at the next available price, which can be worse than 480.33.
- Open beyond both levels. The resting sell limit takes part in the opening auction, and a qualifying open is assumed to fill it. If that open is already at or above the protective stop price 480.33, the protective stop, activated after the fill, is beyond its trigger at once; what then fills, and at what price, depends on the broker’s order handling. Daily OHLC data cannot settle that sequence, and the rule cannot cancel the order on an open that nobody has seen yet. Neither case below opens beyond the stop.
- Target buy limit at the mid-range: (477.55 + 466.43) / 2 = 471.99. The target can be hit intraday on the same bar as the entry; the daily OHLC sequence does not reveal which came first on that bar.
- Same-session ambiguity. If the stop and the target are both touched inside one session, the daily bar does not resolve the order; mark the trade ambiguous and either exclude it or report conservatively (stop).
- Expiry: 10 trading sessions, counting the fill session as session 1. If neither the stop nor the target has filled by the close of session 10, the position is closed with a market order at the next US cash open.
- Educational caveat. This is a hypothetical, retrospectively selected illustration of mechanics, not a backtest and not a personal recommendation.
Course of the trade (Alpaca SIP daily bars)
- 2024-01-11 open 477.59 is at or above the sell limit 477.55 and below the buy stop 480.33 (so no open-beyond-both ambiguity): the resting limit is assumed to fill at the opening print 477.59. The protective buy stop at 480.33 is activated after this fill.
- 2024-01-11 low 472.26 is above the target 471.99, so the target does not fill on the entry bar (no same-session ambiguity).
- 2024-01-12 low 475.23 and 2024-01-16 low 473.06 are both above the target.
- 2024-01-17 open 471.82 is below the target 471.99: the target buy-limit fills at the improved open 471.82.
- Gross reward: 477.59 minus 471.82 equals 5.77 per share.
- Initial planned risk from fill to stop: 480.33 minus 477.59 equals 2.74 per share. This is the intended loss on the trade, not a cap on the possible loss: a gap or fast market through 480.33 can print the stop fill at a worse price. The stated 2.74 figure holds only when the stop fills at its trigger price.
- Illustrative round-trip cost allowance: 0.06 per share (3 cents per side). This is a hypothetical modelling allowance for commissions and small slippage on a liquid ETF, not a verified broker quote; actual all-in costs depend on the broker, the account type, borrow availability for the short leg and the fill venue. The short side also requires that shares were available to borrow, which this illustration assumes and does not verify from a broker locate record. Net result: 5.77 minus 0.06 equals 5.71 per share.
One SPY fade that was stopped out (2021-06)
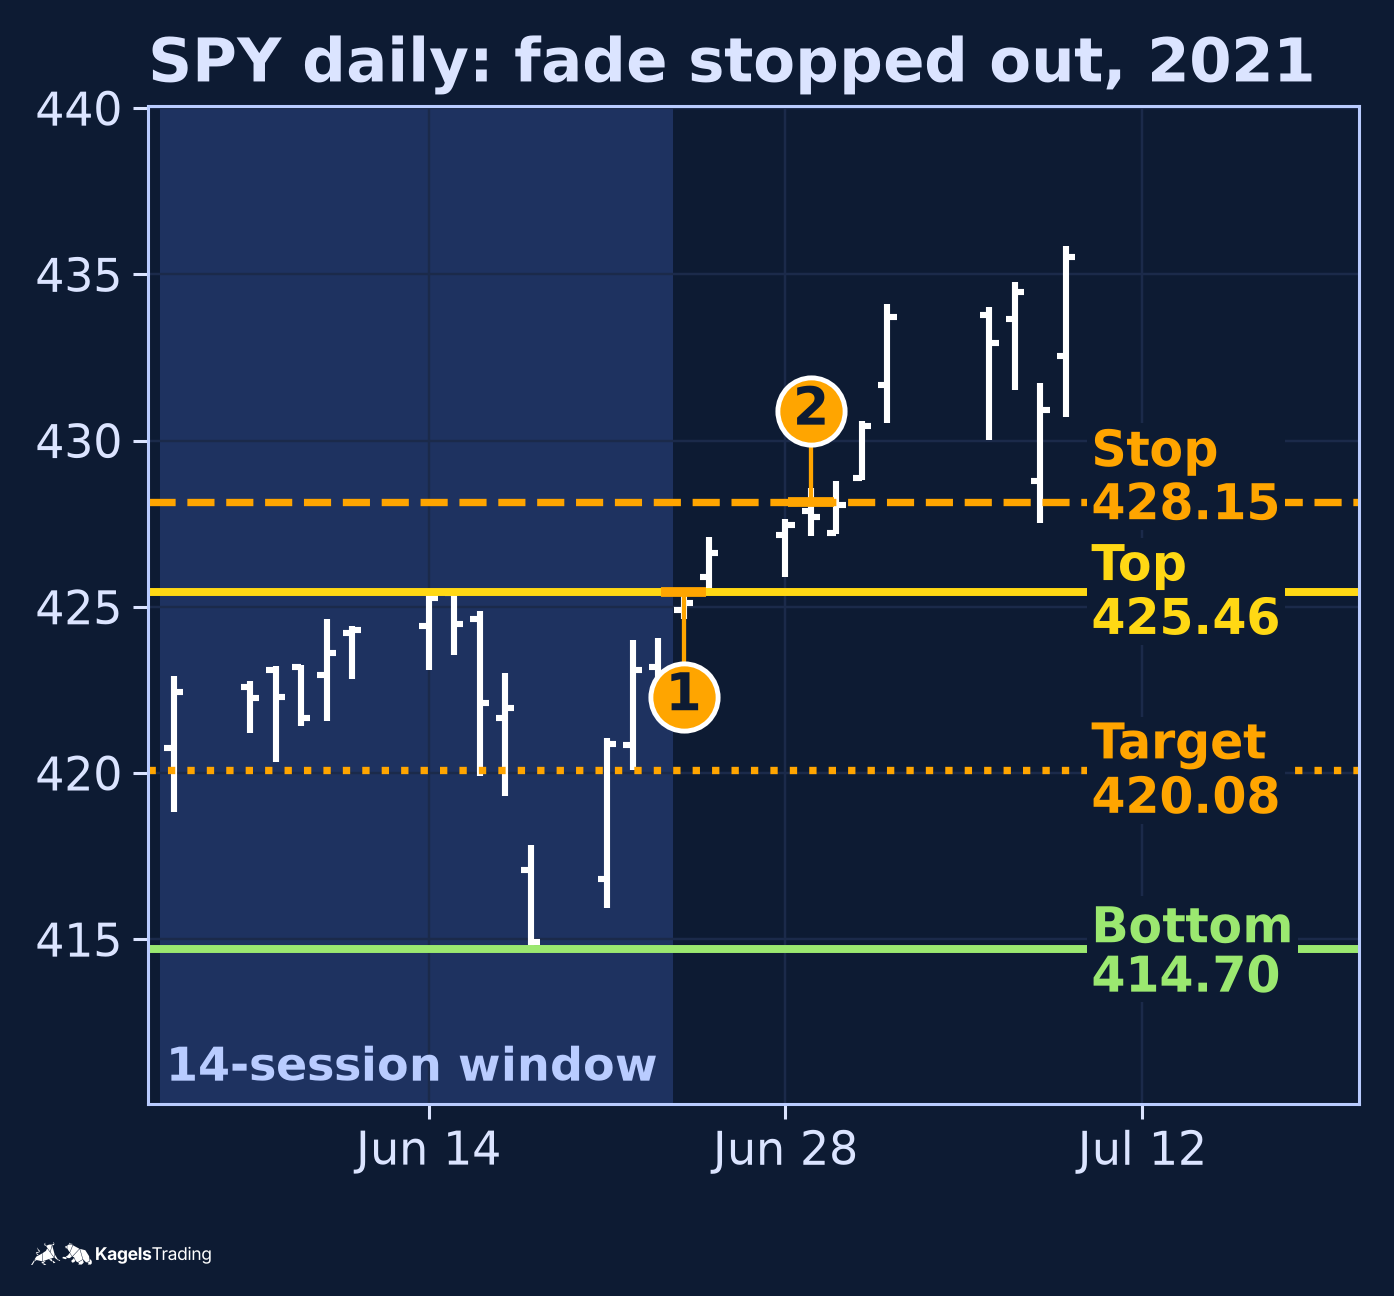 Click to enlarge
Same illustrative execution rule
- 14-session window: 2021-06-04 to 2021-06-23 (both inclusive). Top line = window high 425.46 on 2021-06-15. Bottom line = window low 414.70 on 2021-06-18. Width 10.76 points. Boundaries frozen at the end of the window.
- Resting short sell limit at 425.46, active on 2021-06-24 only. Protective buy stop at 425.46 plus 25 percent of width equals 428.15, activated only after the sell limit is filled. Target buy limit at (425.46 + 414.70) / 2 equals 420.08. Expiry as in the winner case.
Course of the trade (Alpaca SIP daily bars)
- 2021-06-24 open 424.89 is below the limit, so the opening auction does not trigger it; the intraday high 425.55 is at or above the limit, so the resting limit is assumed to fill at 425.46 during the regular session. The protective buy stop at 428.15 is activated after this fill.
- 2021-06-24 low 424.62 is above the target 420.08, so the target does not fill on the entry bar.
- 2021-06-25 open 425.90, high 427.0943; 2021-06-28 high 427.65. None reaches the buy stop 428.15.
- 2021-06-29 open 427.88 (below the stop), high 428.56 (at or above the stop 428.15). The illustrative rule assumes the stop fills at 428.15 on a stop touch; a gap or fast market can print worse than 428.15 and the loss grows accordingly.
- Gross loss: 428.15 minus 425.46 equals 2.69 per share. With the 0.06 per share illustrative hypothetical cost allowance (same disclosure as the winner case; a short leg also requires borrow availability and may carry financing that is not modelled here): net 2.75 per share loss.
Two cases, one worked and one stopped out, under the same stated rule. This is a description of the two cases; it is not a win rate or a backtest. The breakout trading guide covers the complementary side of the fade with a count of 1,472 events.
Range trading and other setups
Opening range breakout is a different setup. It uses the first fifteen or thirty minutes of a US session as a short-term range and trades in the direction of the break, not against it. The order mechanics are the breakout mechanics above, not the fade mechanics in this guide. Our opening range breakout guide covers that setup.
Breakout trading is the complement of range trading on the same chart. When a range ends with a confirmed close beyond the boundary, the trade on the other side of the fade is the breakout entry.
A liquidity sweep is a visible move beyond a prior high or low with a close back inside. Whether stops were in fact triggered is a plausible reading of the sequence, not an observable fact in OHLC data; stops are conditional, not visible on the chart. A sweep at a range boundary can precede a fade; it does not change the mechanics in this guide.
Checklist and limits
- Draw the range by the stated 14-session rule. Freeze the top and bottom at the end of the window.
- Pick a touch tolerance and keep it; 0.4 percent of the top and bottom is the convention used here.
- Pick a stop convention and keep it; 25 percent of the range width beyond the entry side is used here.
- Use the right order type for the entry: resting limit at an untested boundary, retest limit after an observed rejection, stop for the break.
- Protective broker-side stop and close-based invalidation are different orders. State both before the trade.
- Same-session ambiguity. If the stop and the target are hit inside the entry bar, mark the trade ambiguous and do not pick a favourable order.
- Judge the net reward after spread, commissions and slippage against the planned risk.
- Two documented cases are not a win rate. The two cases above are illustrative; a count across many events requires a backtest with its own method.
- Hypothetical and educational. The two cases are retrospectively selected illustrations of mechanics, not a backtest and not a personal recommendation.
Frequently asked questions about range trading
What is range trading?
Range trading is a plan for a market moving between a horizontal top and a horizontal bottom. The trader fades each boundary and exits by the written invalidation or by the target.
Is range trading profitable?
The two documented cases above do not answer that question. Any claim of a general profit rate for range trading is marketing; the honest answer is that a well-defined plan and realistic cost assumptions are a precondition, not a guarantee.
Which indicator is best for range trading?
The chart is the measurement; an indicator is a filter. The usual choices are RSI, Bollinger Bands and ADX. Use at most two, use them the same way every time, and treat them as reasons to skip, not reasons to trade.
How do I know a market is in a range?
By the stated 14-session rule. If the window fails the touch rule or the trend filter, there is no range by this guide’s criterion; the trader waits for one that satisfies the rule, or trades another setup.
What is the right stop distance?
The stop sits outside the range at the entry side by a stated distance. The number used here is 25 percent of the range width; a trader who prefers a nearer stop trades off a smaller loss against a higher chance that a wick triggers it.
Does a bigger range mean a better trade?
Not by itself; what counts is the net reward against the planned risk. A ten-point SPY range and a two-point SPY range are not the same trade; copying a plan across both without resizing is not the same plan twice.
What about failed breakouts into the range?
A breakout that fails back into the range is the fade on the opposite side. It is a new setup, with its own plan and its own stop; it is not a vindication of the first fade.
Can I average down inside a range?
Not under this guide. Averaging down is a separate decision with its own risk calculation. “Add on a second touch” is not the same as “the first entry was wrong”; the two options should not share the same trade.
This English edition is based on our German edition on kagels-trading.de and has been adapted for international readers.
More Chart Techniques guides
- Draw key levels
Support and Resistance: How to Draw and Use Key Levels
Where useful levels come from, how to draw zones with a stated rule and how to turn a level into a trade plan.
- Read price action
Price Action Trading: How to Read Charts Without Indicators
Market structure, key zones and three bar patterns, with a core setup and a real SPY example where the signal failed.
- Read candlestick charts
How to Read Candlestick Charts: Body, Wicks and Context
Open, high, low and close in one candle, body and wicks, two real Gold candles read step by step and how often patterns really occur.
- Know candlestick patterns
Candlestick Patterns: 10 to Know, Tested on Real Data
Ten patterns with rules and a cheat sheet, counted on DAX, S&P 500, EUR/USD and Gold since 2014: most are rare, none is a signal on its own.
- Combine timeframes
Multi-Timeframe Analysis: A Weekly and Daily Workflow
How to combine the weekly chart for context and the daily chart for entry under one stated rule, with a documented SPY case from June 2025.
- Read chart formations
Chart Patterns: Reversals, Continuations and Failures
Reversal, continuation and bilateral formations with the measured-move convention per pattern and two documented SPY rectangle cases.
- Trade breakouts
Breakout Trading Strategy: Entries and False Breakouts
How often breakouts fell back into the range in our count of 1,472, and how to plan entry, stop and position size.
- Draw and trade trendlines
Trendline Trading: How to Draw Trendlines and Trade Them
How to draw trendlines with a fixed rule, four strategies for bounces, breaks and retests, and a real SPY line break without a lasting reversal.
- Use Fibonacci levels
Fibonacci Retracement Levels: How to Draw and Trade Them
How to calculate and draw retracement levels, trade pullbacks with confluence and a stop at the structure, and what a ten-year test says about the levels.
- Set Fibonacci targets
Fibonacci Extension: Levels, How to Draw It and Calculator
Three-point extension targets from the end of a pullback, why they differ from levels beyond 100%, a free calculator and three SPY swings, one without a single target reached.
- Trade gaps
Gap Trading Strategy: How to Trade Gaps and When Gaps Fill
Opening and full gaps, the four classic gap types, how often SPY gaps filled in our count since 2001, and plans for gap fill and gap and go.
- Calculate pivot points
Pivot Points: Formulas, Types and How to Trade Them
Formulas for standard, Fibonacci, Woodie, Camarilla and DeMark pivots, a free calculator, which session counts and a real SPY day.
- Swing trade
Swing Trading: 4 Strategies, Risk and Real Examples
Four swing trading strategies on the daily chart, position size, gap risk and US rules, with two hypothetical SPY pullbacks: one hit its target, one was stopped out.
- Identify market stages
Stage Analysis: Stan Weinstein's Four Market Stages
Stan Weinstein's four stages on the weekly chart, a Stage 2 checklist and two TSMC breakouts: one ran for a year, one gapped through its stop.
- Read Wyckoff ranges
Wyckoff Method: Accumulation, Distribution and Springs
Accumulation and distribution with phases A to E, springs and upthrusts as optional tests, and two real TSMC ranges read with and without hindsight.
- Trade Darvas boxes
Darvas Box Strategy: Rules, Entries and Stop Losses
The box rules step by step, when the edges become known, where the stop goes, and a mechanical test on TSMC in 2024 with two honest results.
- Count Elliott waves
Elliott Wave Theory: Rules, Patterns and Fibonacci
The five-wave pattern, three hard rules, zigzags, flats and triangles, Fibonacci ratios and a real DAX count, from the first German translator of the standard work.
- Trade order blocks
Order Blocks: How to Spot, Draw and Trade the Zone
The three conditions behind a valid order block, entry and stop at the zone, two SPY cases from 2026 and a 25-year count where a fixed rule lost money.
- Trade fair value gaps
Fair Value Gap (FVG): How to Spot, Trade and Test It
The three-candle rule, bullish, bearish and inverse FVG, two SPY cases from 2026 and a 25-year count of how often gaps were revisited and traded.
- Read liquidity sweeps
Liquidity Sweep: How to Spot It and Trade the Reversal
Sweep or run, buy-side and sell-side liquidity, internal and external targets, SPY reversal, continuation and failed-reversal examples and a 25-year count of a fixed sweep rule.
- Interpret volume
Volume Analysis in Trading: How to Read Volume Honestly
What volume counts in stocks, futures, forex and crypto, how to read it against its own average, and our SPY test of high-volume days since 2001.