
Market forecasts
Price and yield forecasts across major markets, plus valuation outlooks for private companies. Each page explains its scenarios and the levels or assumptions that matter.
24 forecasts across 7 categories, published openly since 2015.
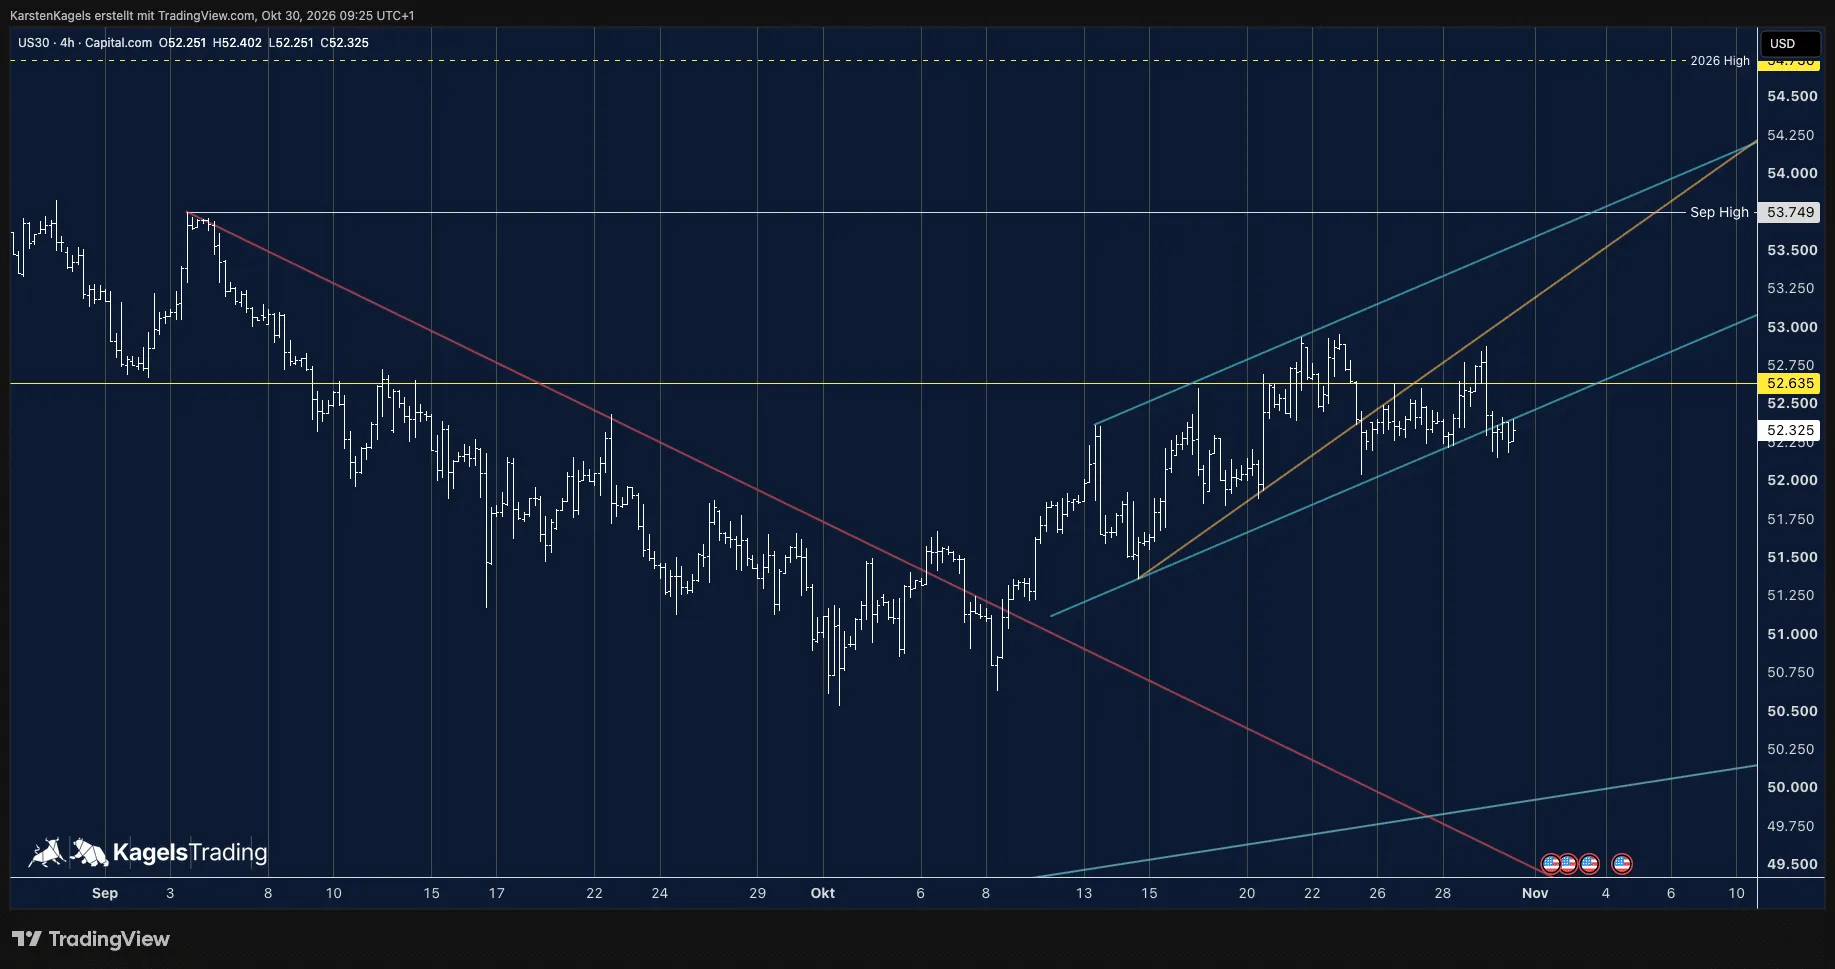
Latest update: Dow Jones forecast
The situation: Downward pressure at the line at 52,635, trend channel left to the downside on the 4-hour chart. The Dow Jones stands at 52,325 points below the line and aims at the weekly low at 52,144.
Read the forecast →Indices
US and German stock indices.
Dow Jones
US30 · CFD
- Price at update
- 52,325
- Updated
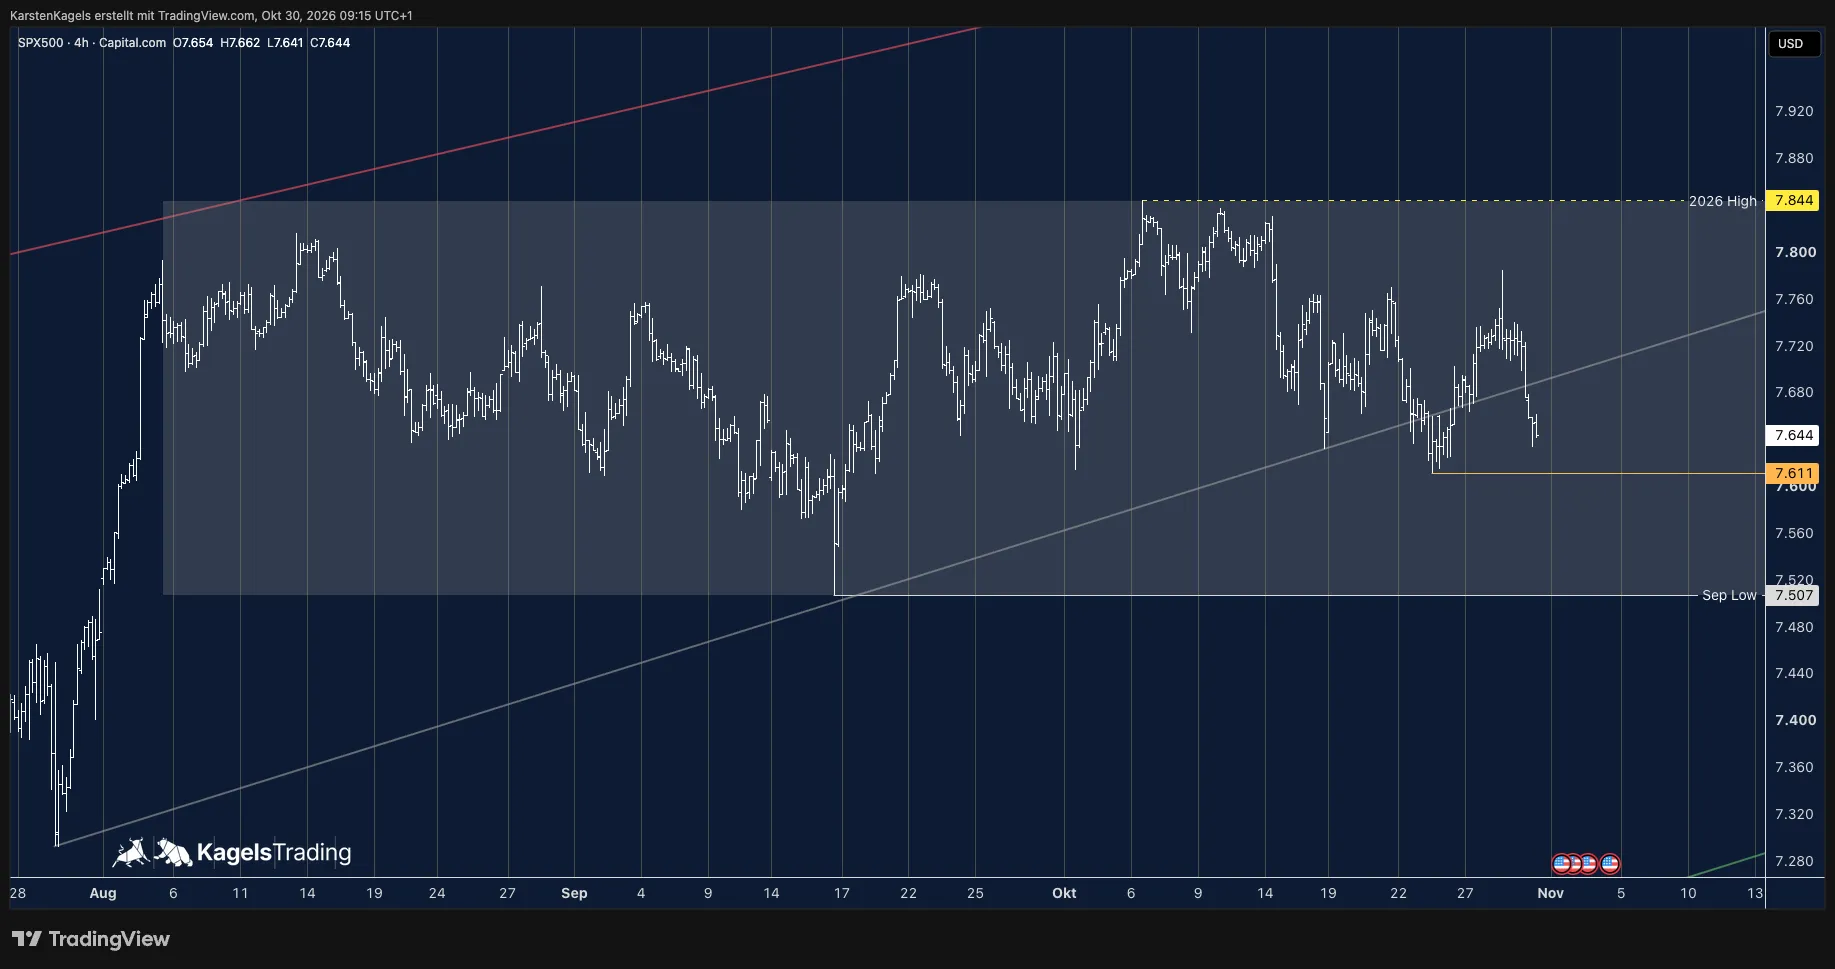
S&P 500
SPX500 · CFD
- Price at update
- 7,644
- Updated
Nasdaq 100
NDX
- Price at update
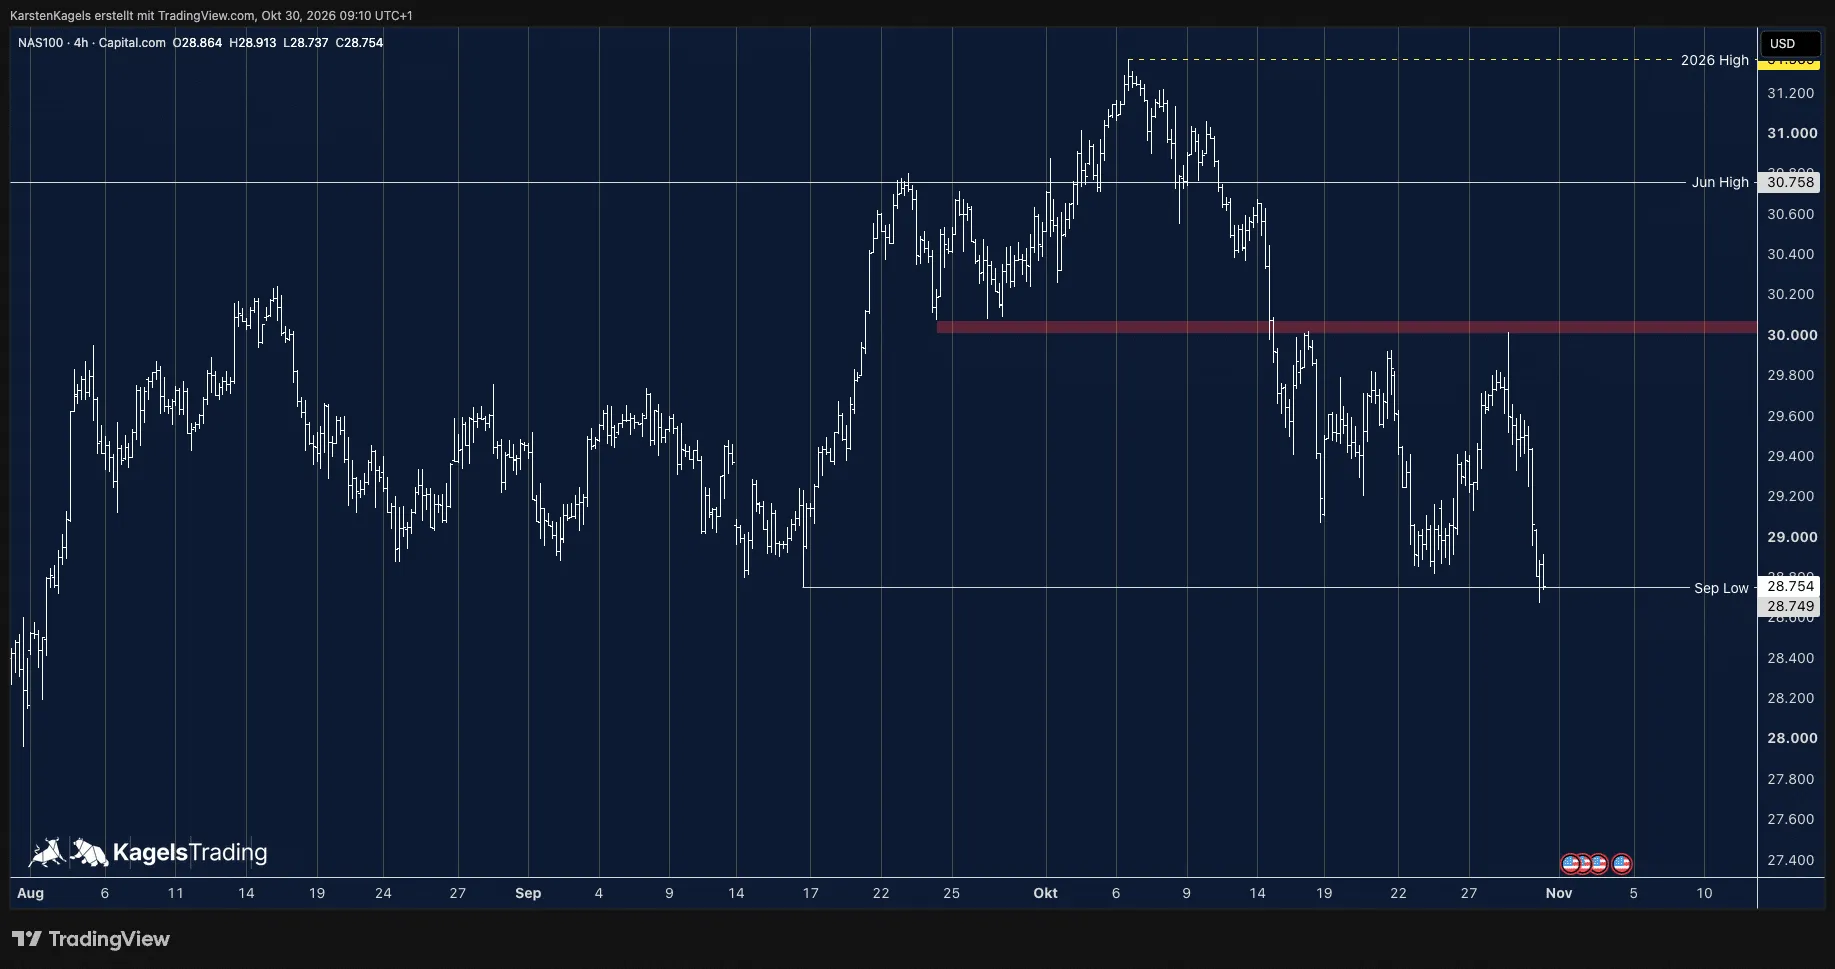
- 28,759
- Updated
What changed: The weakness from the 30,000 resistance continues and has tested the September low; the price trades around 28,750 and keeps the pressure on the low at 28,749.
DAX
DAX · CFD
- Price at update
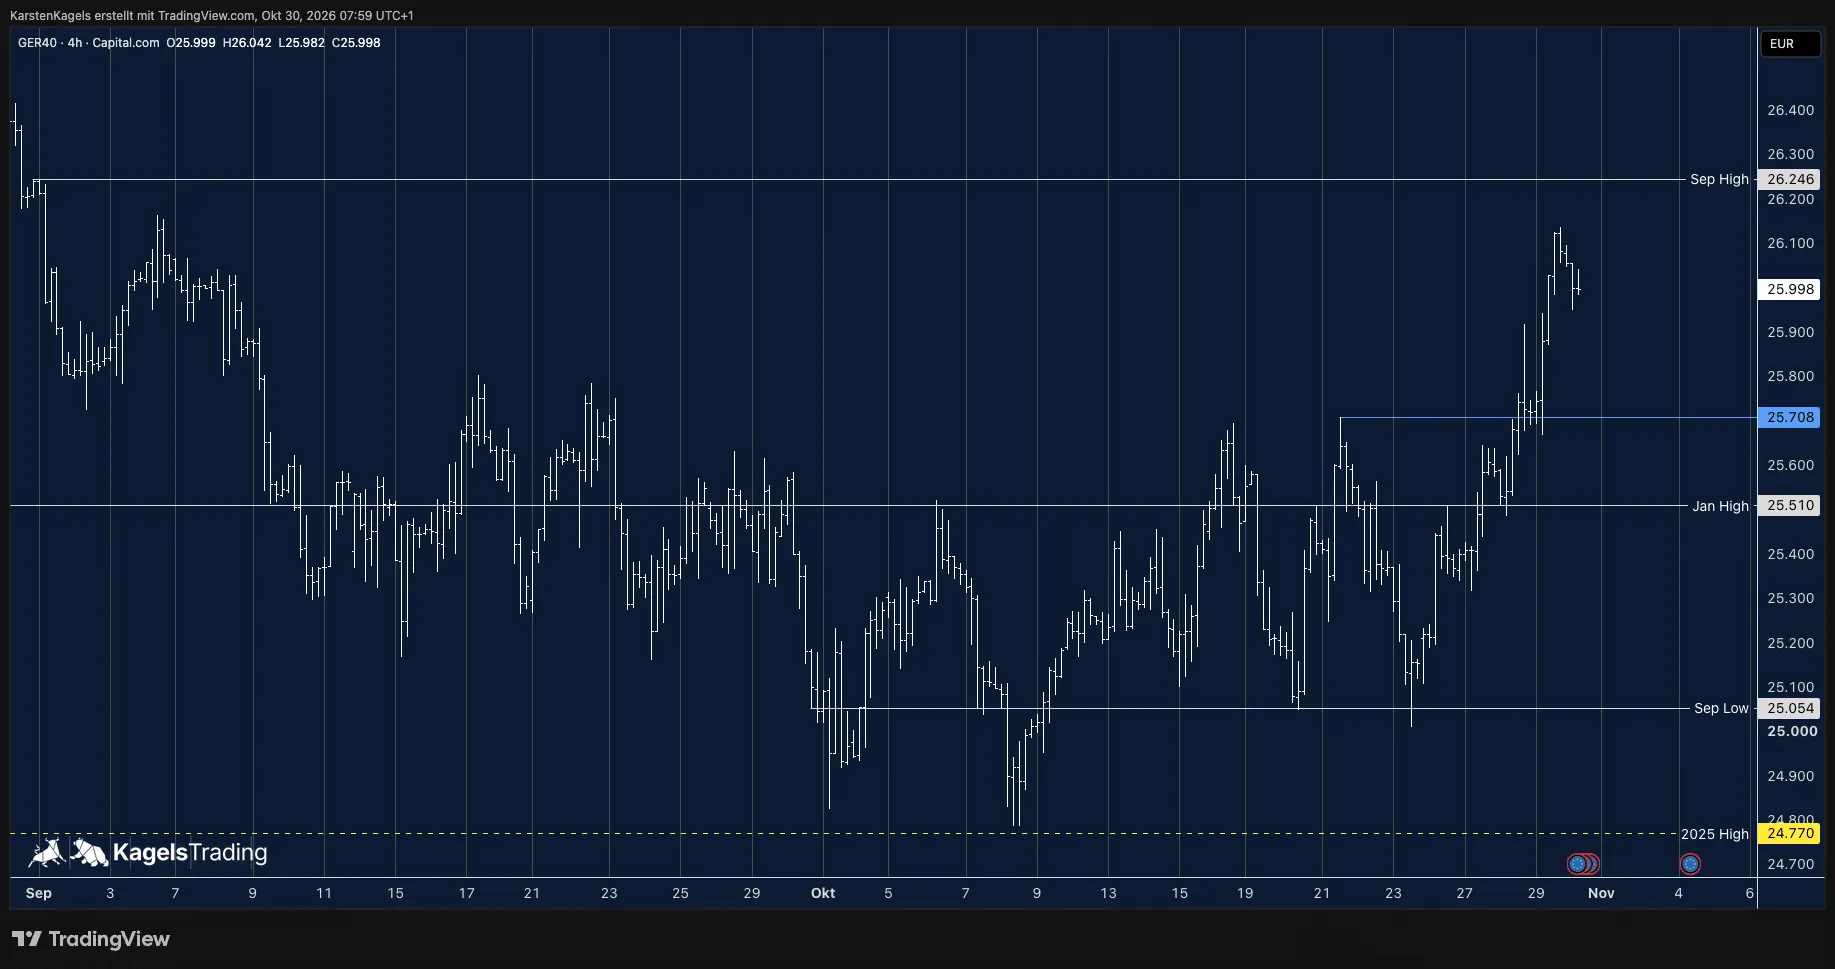
- 26,083
- Updated
Metals
Precious and industrial metals.
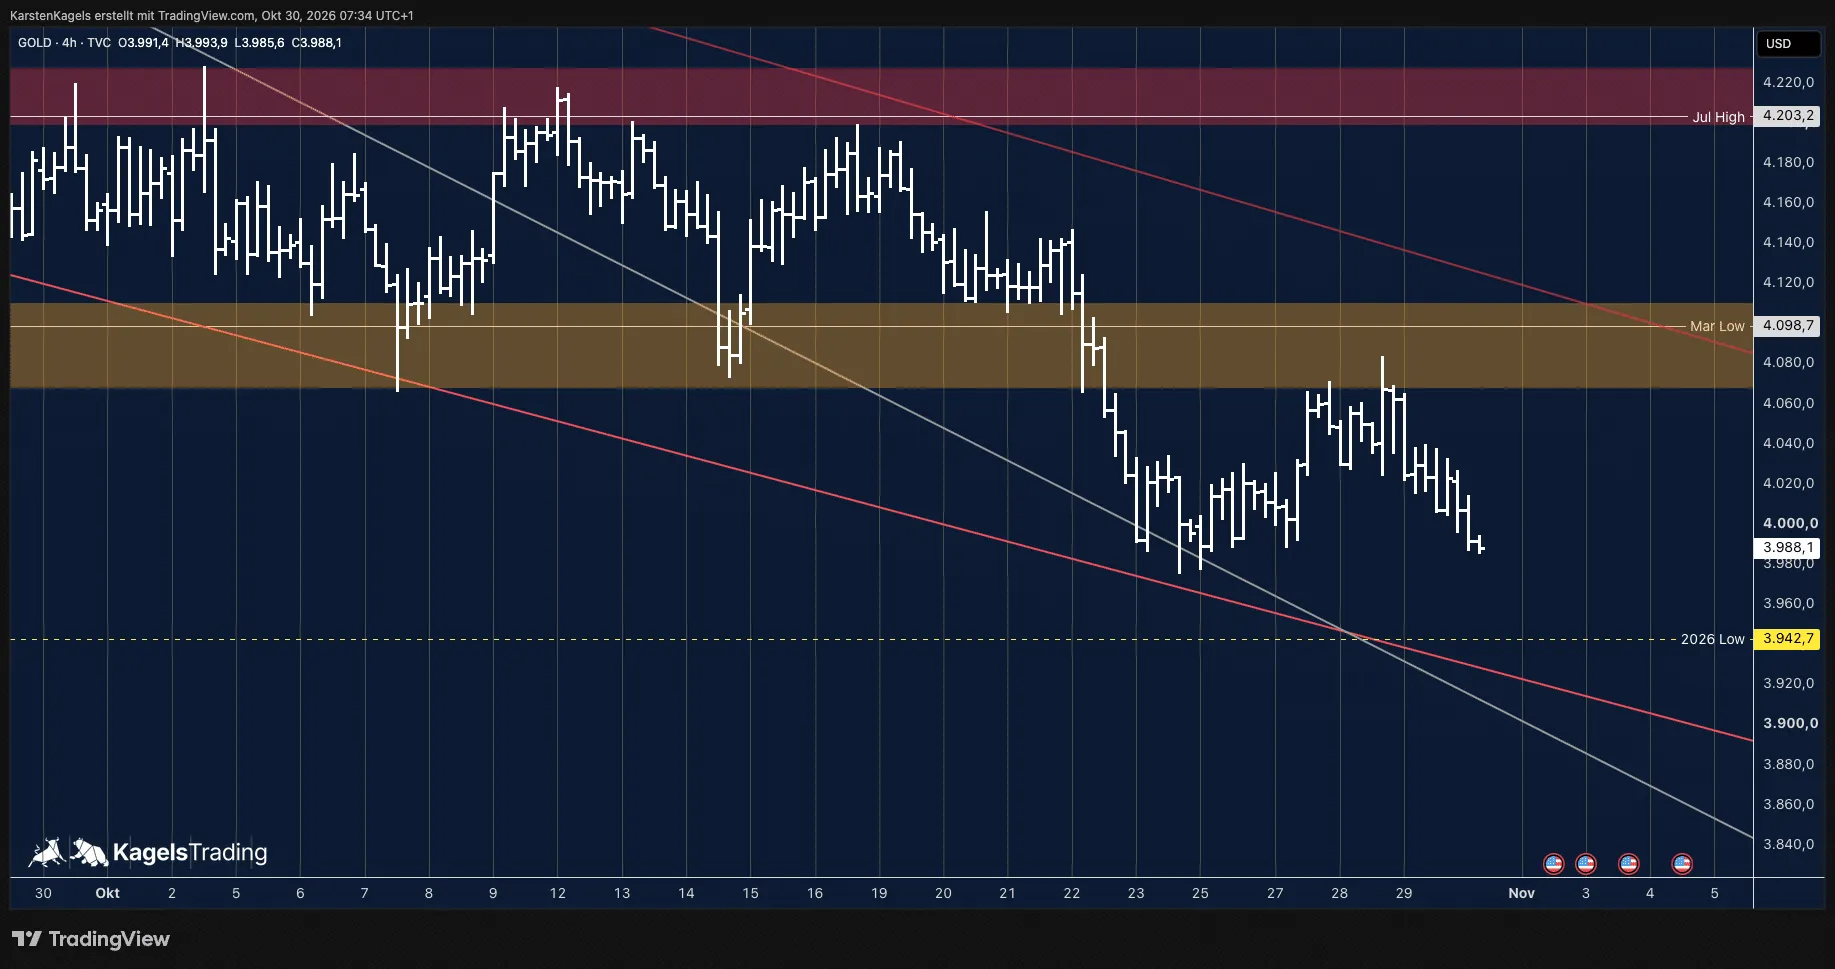
Gold
XAU/USD · spot
- Price at update
- $3,988.10
- Updated
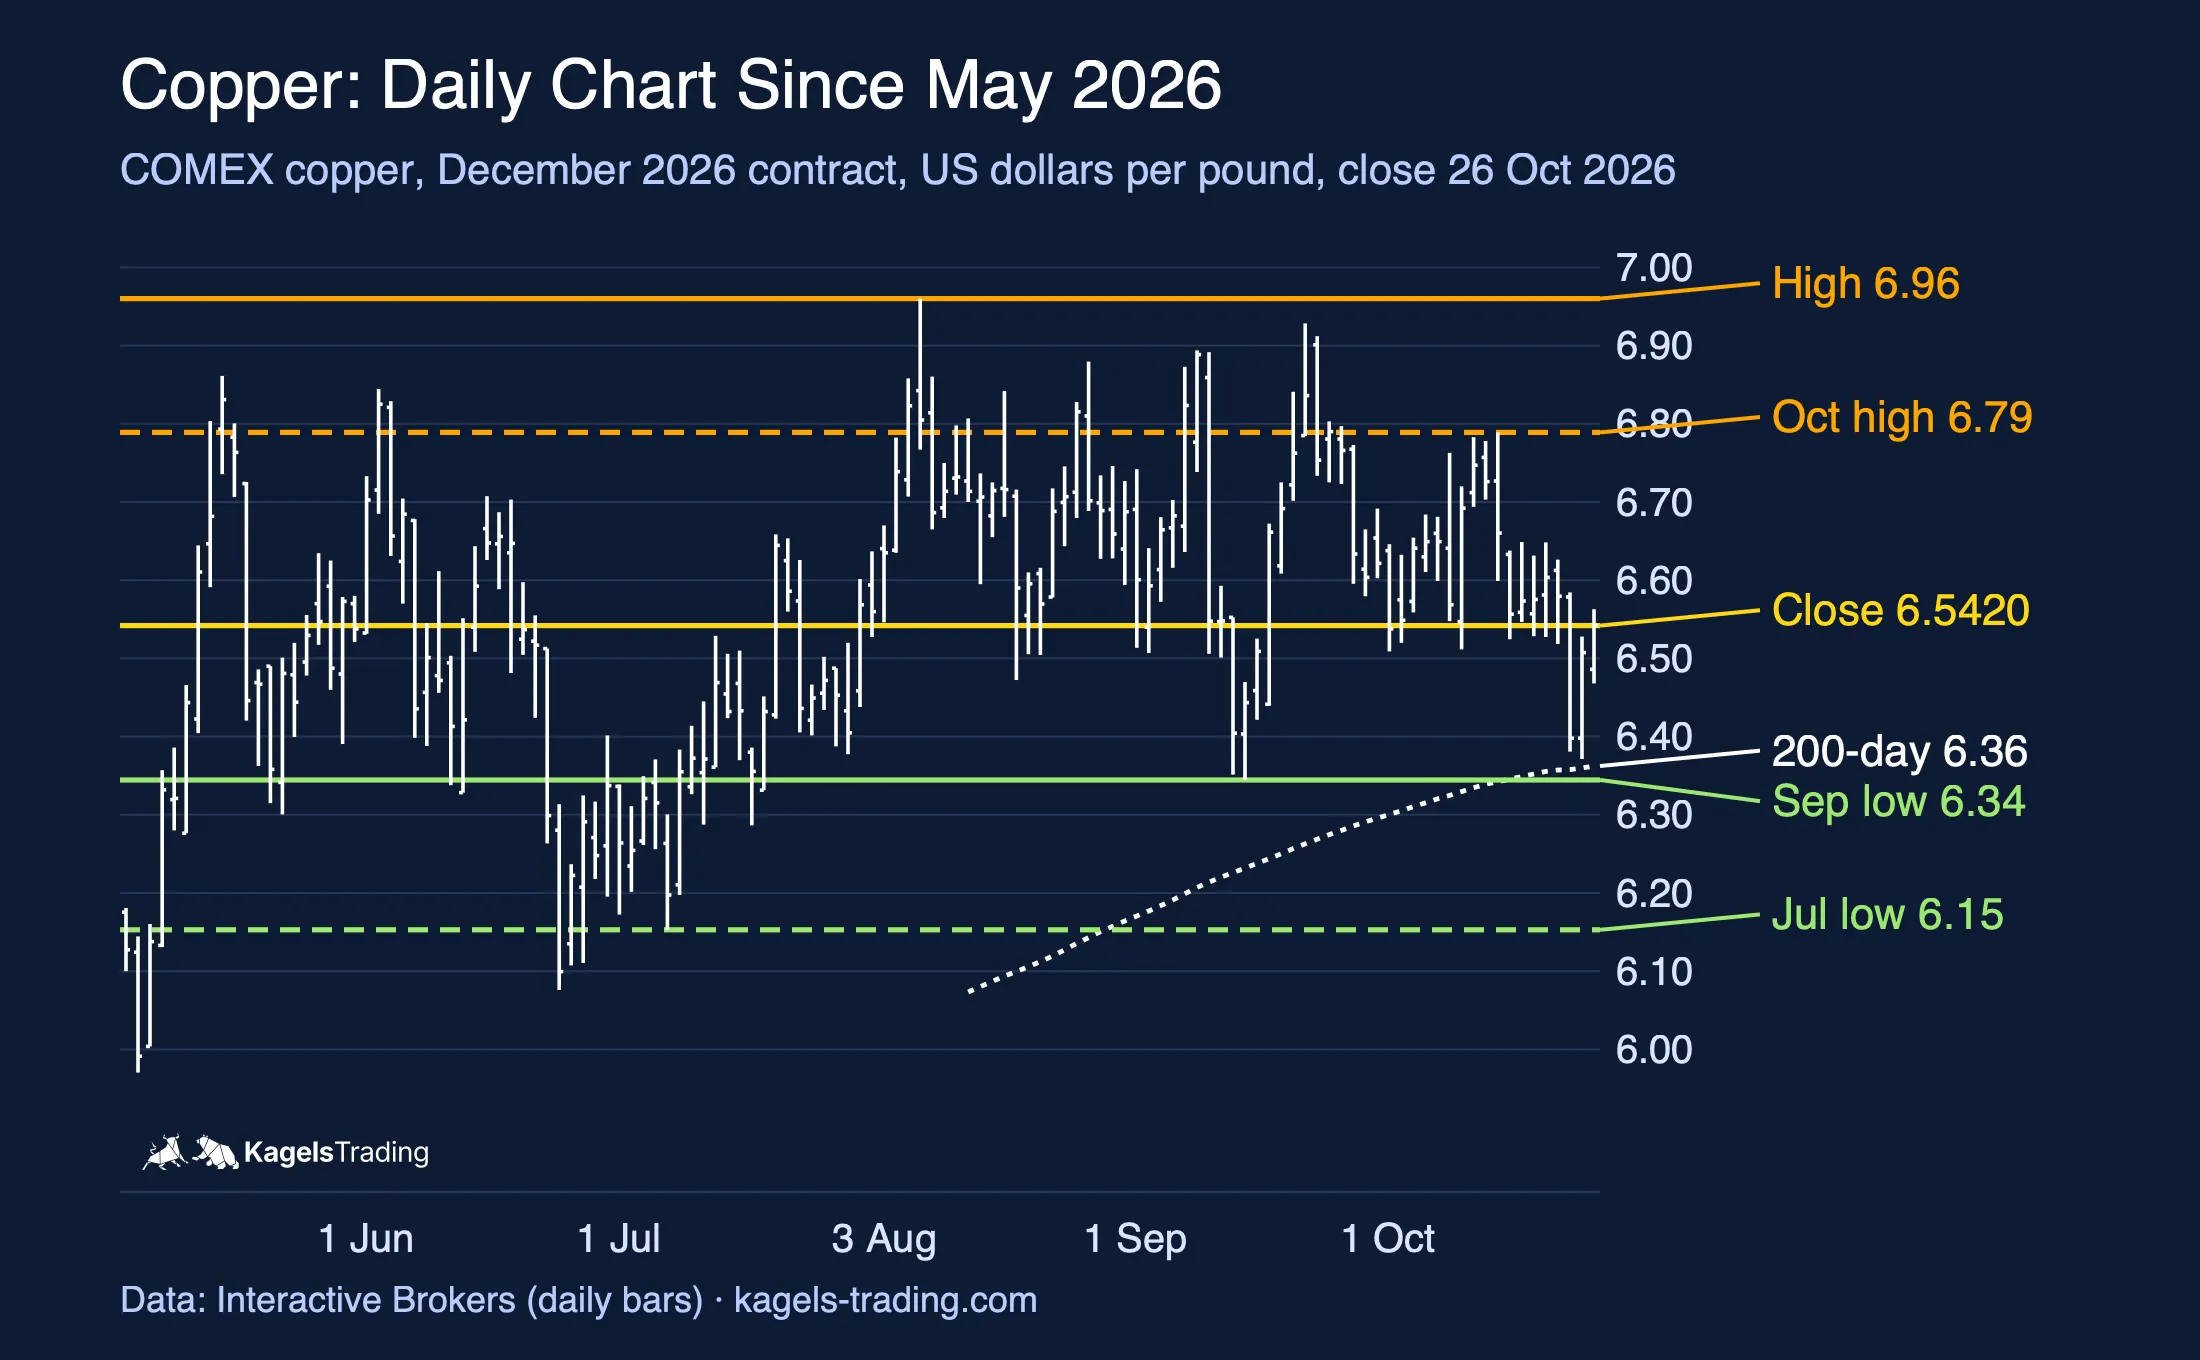
Copper
COMEX copper
- Price at update
- $6.54
- Updated
What changed: Data to the close of 26 October ($6.54) and Freeport's third-quarter report of 27 October; levels and reading unchanged, range $6.08 to $6.96.
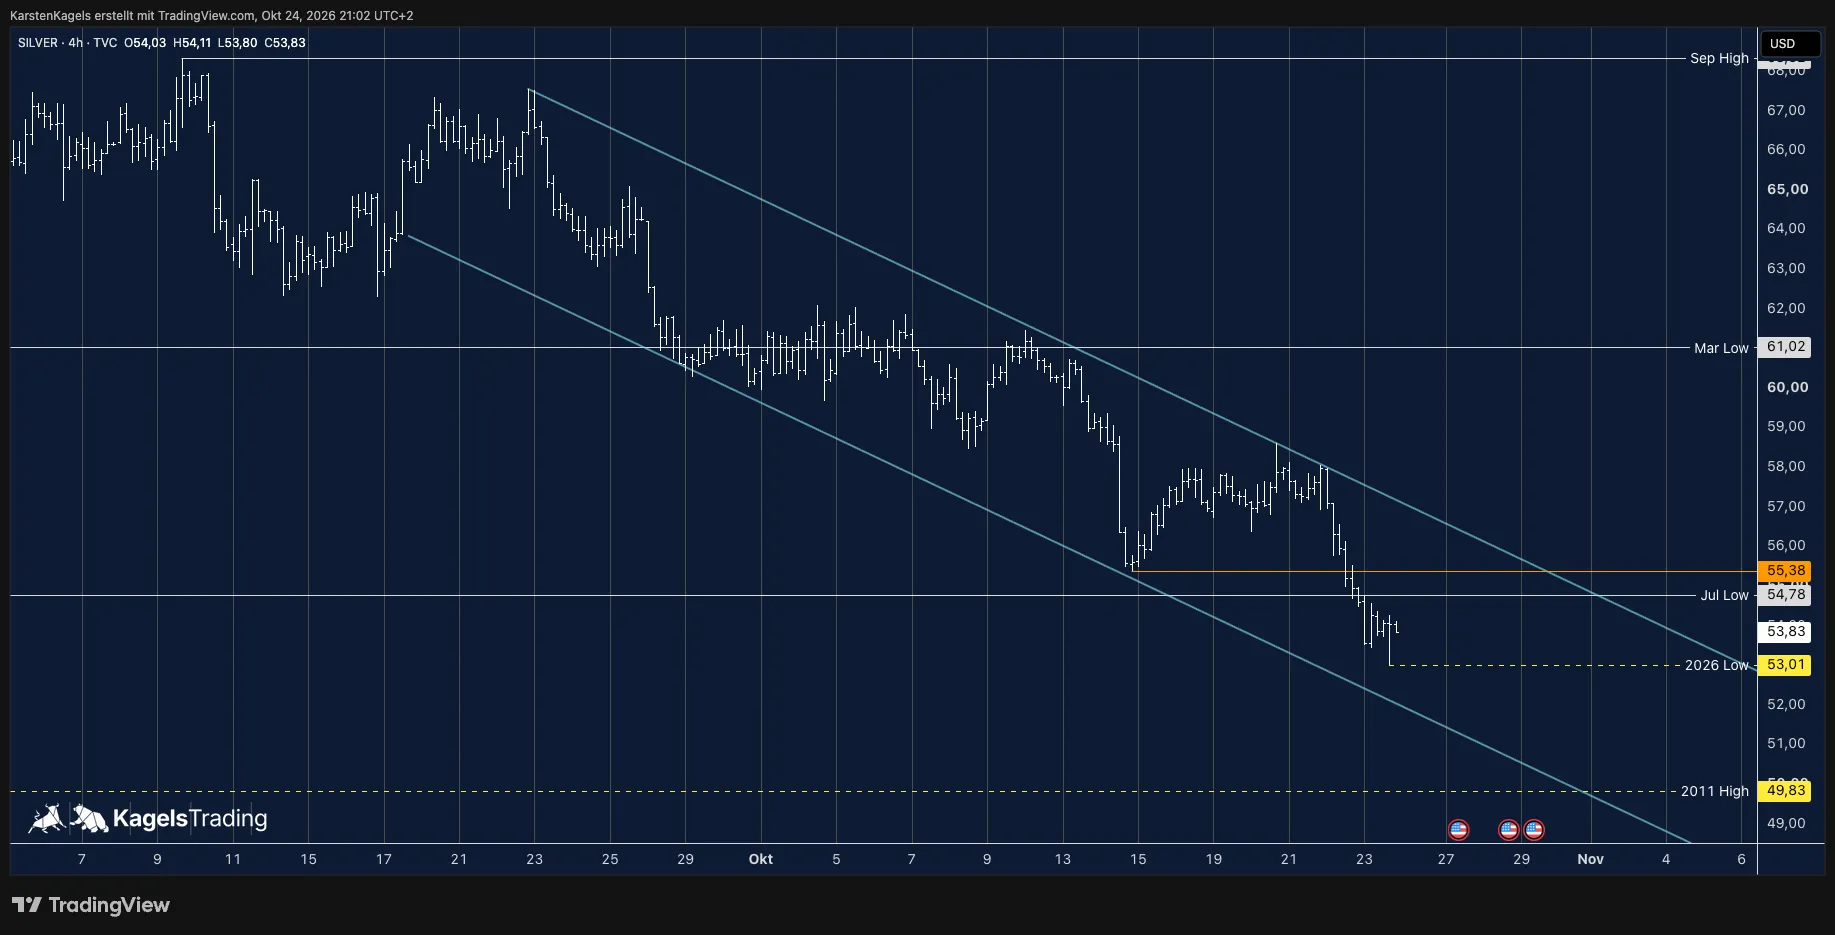
Silver
XAG/USD · spot
- Price at update
- $53.83
- Updated
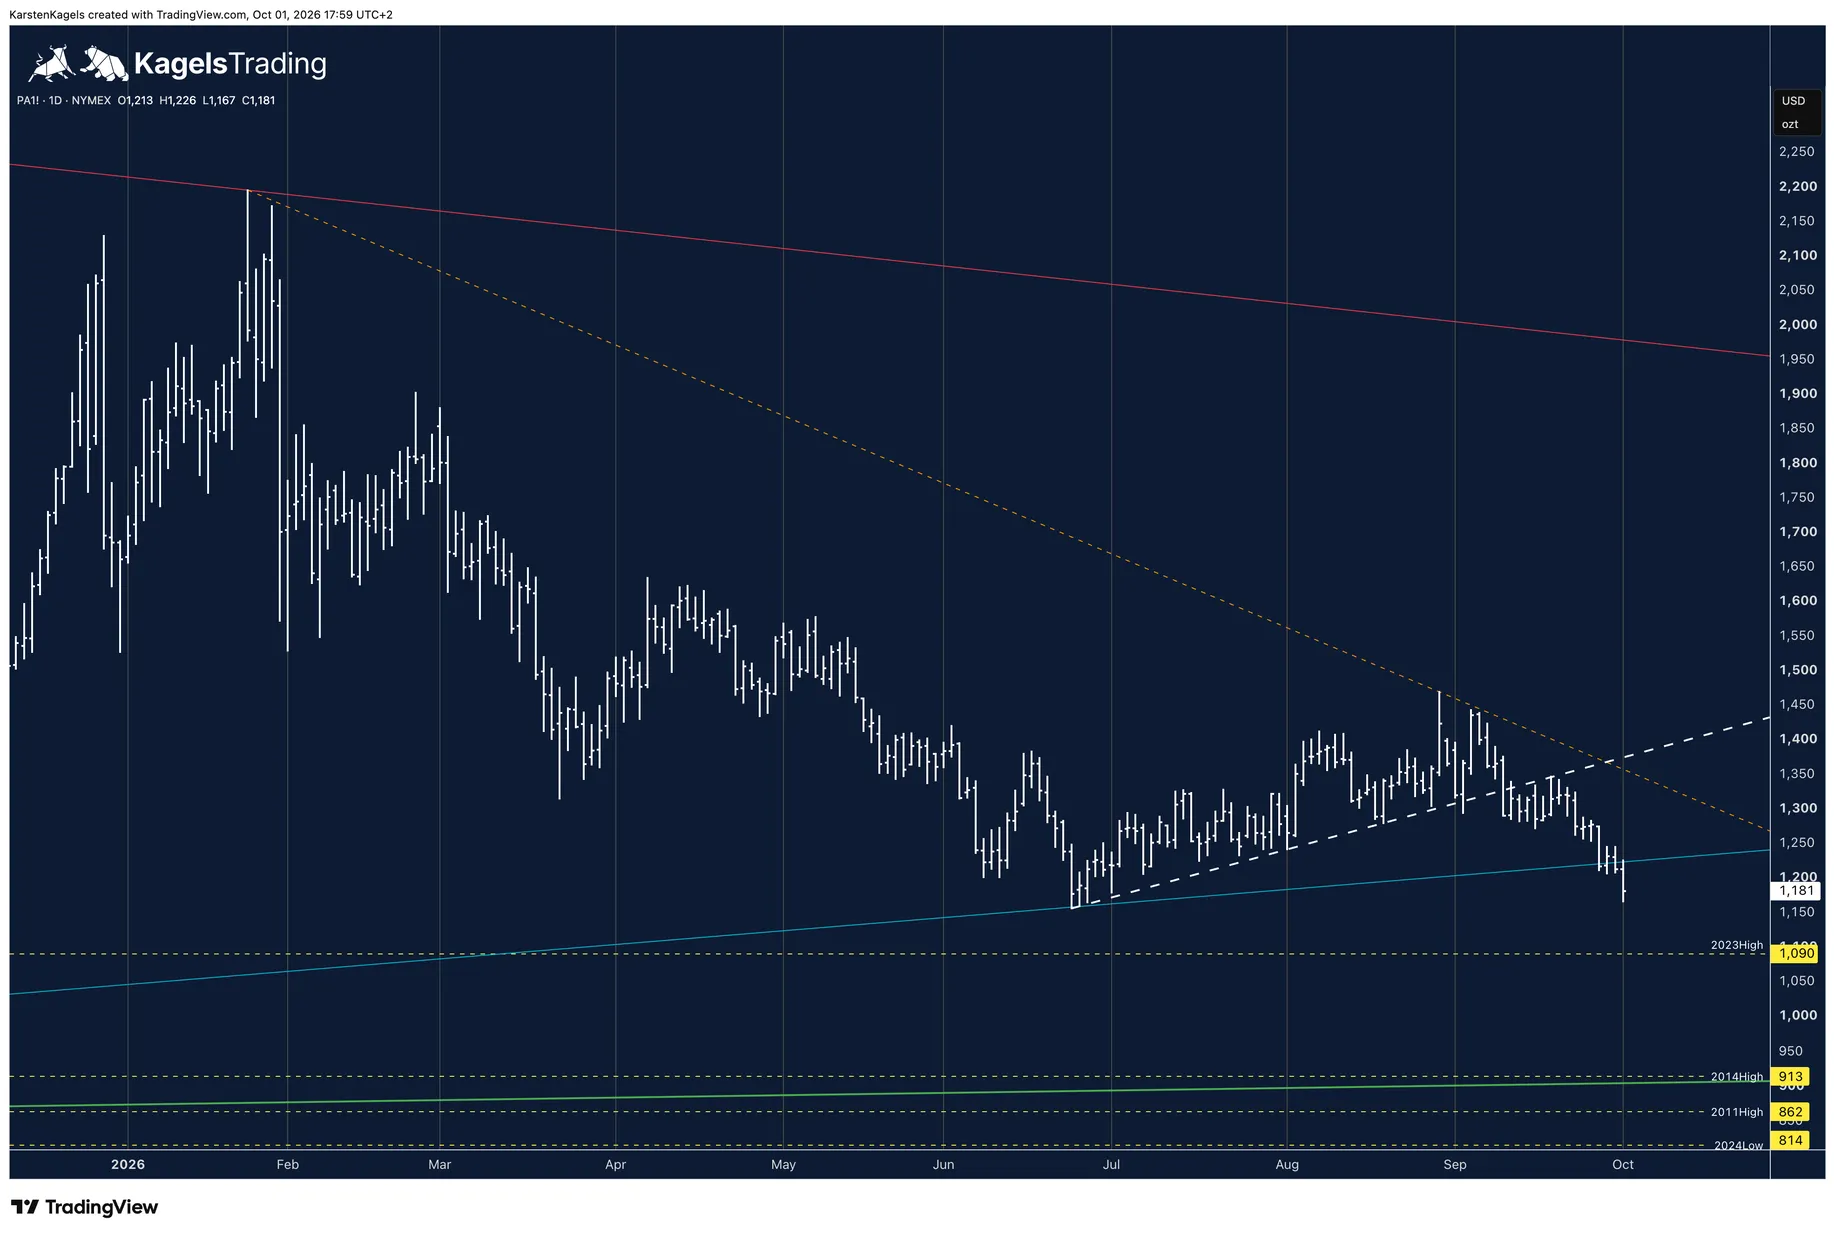
Palladium
NYMEX palladium
- Price at update
- $1,185
- Updated
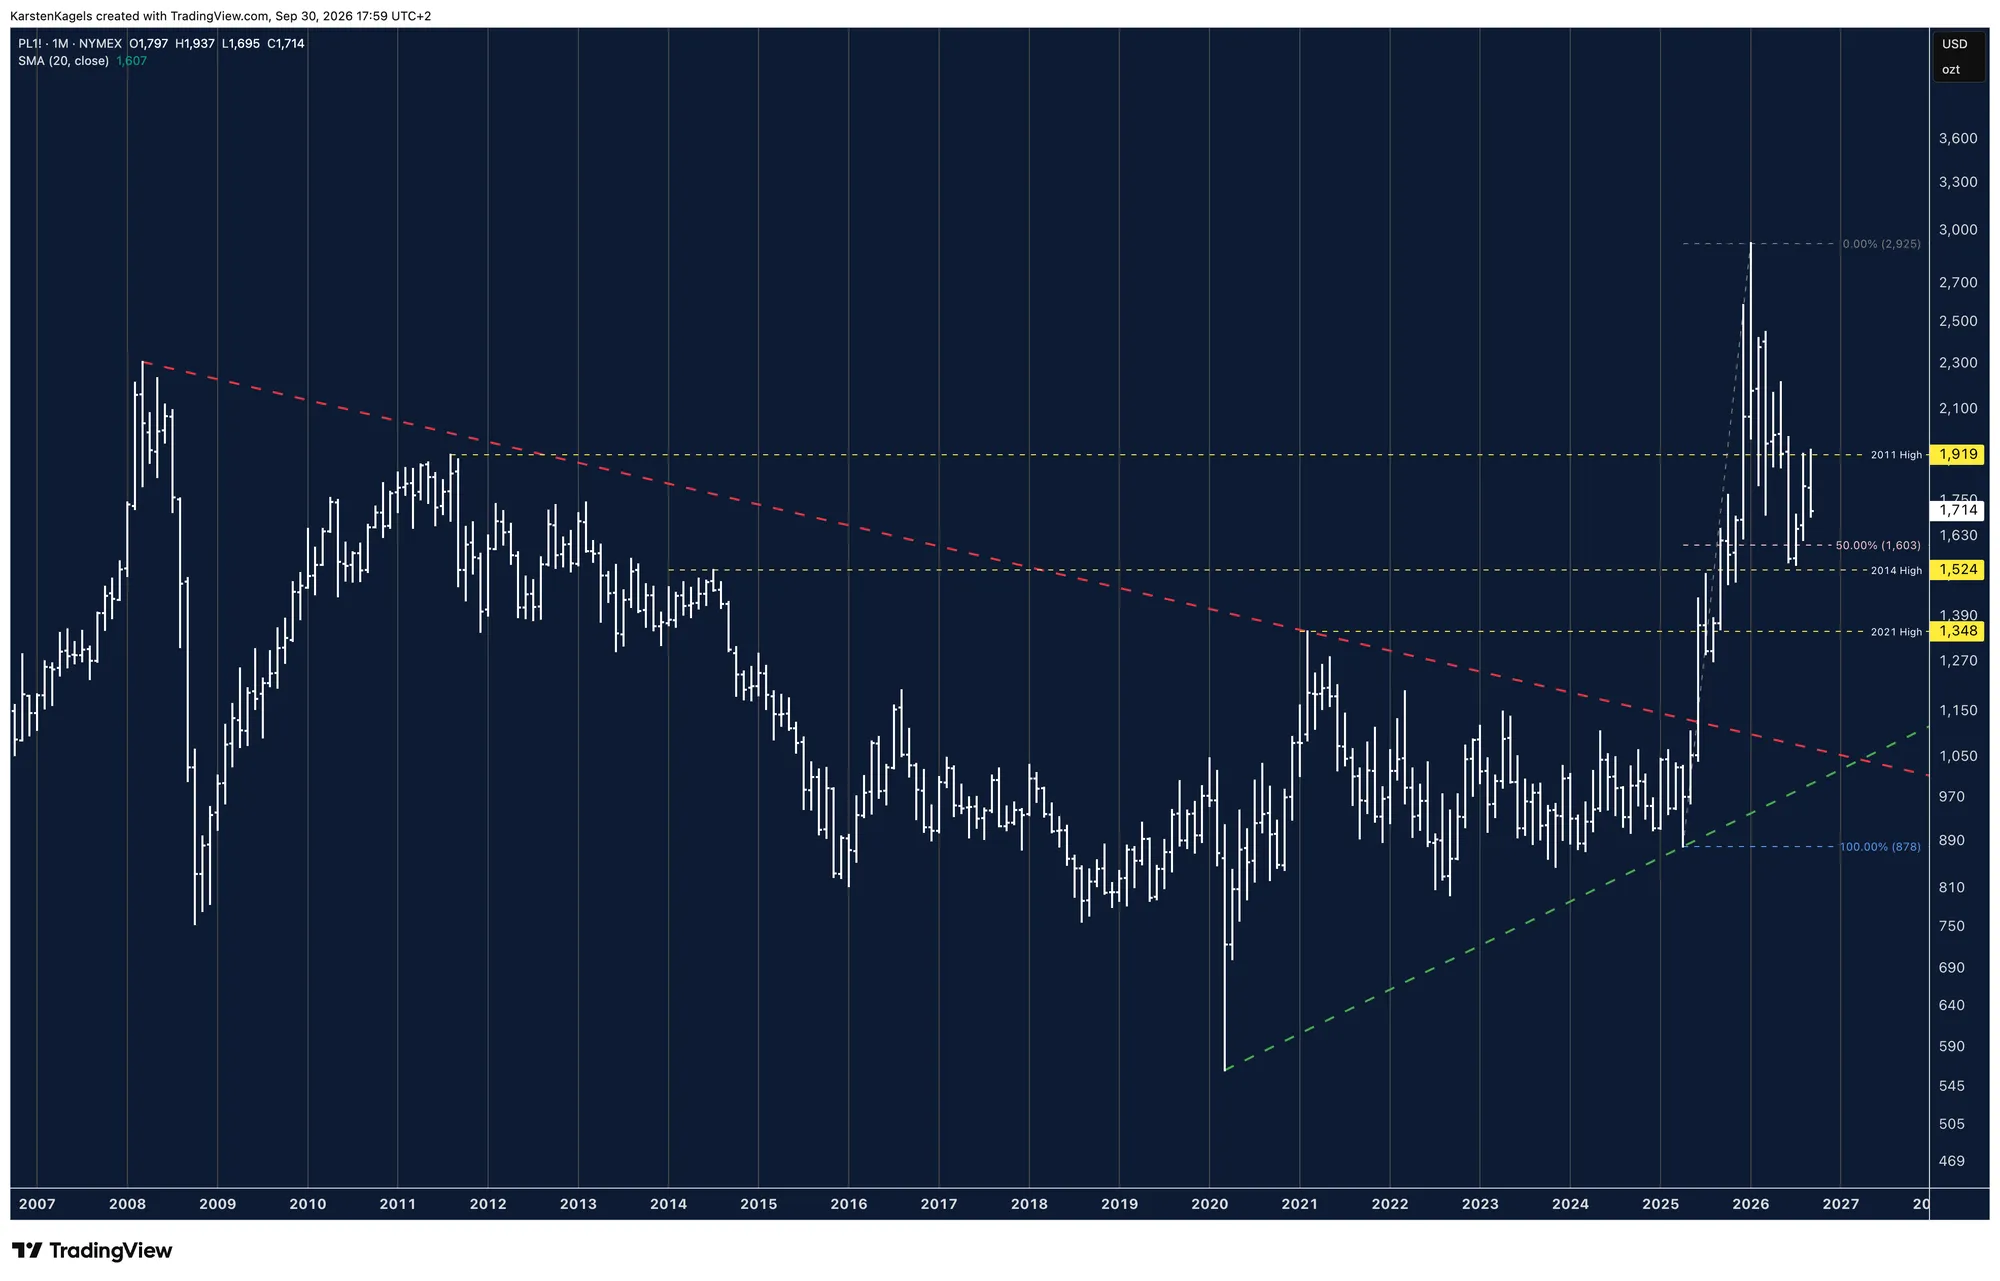
Platinum
NYMEX platinum
- Price at update
- $1,716
- Updated
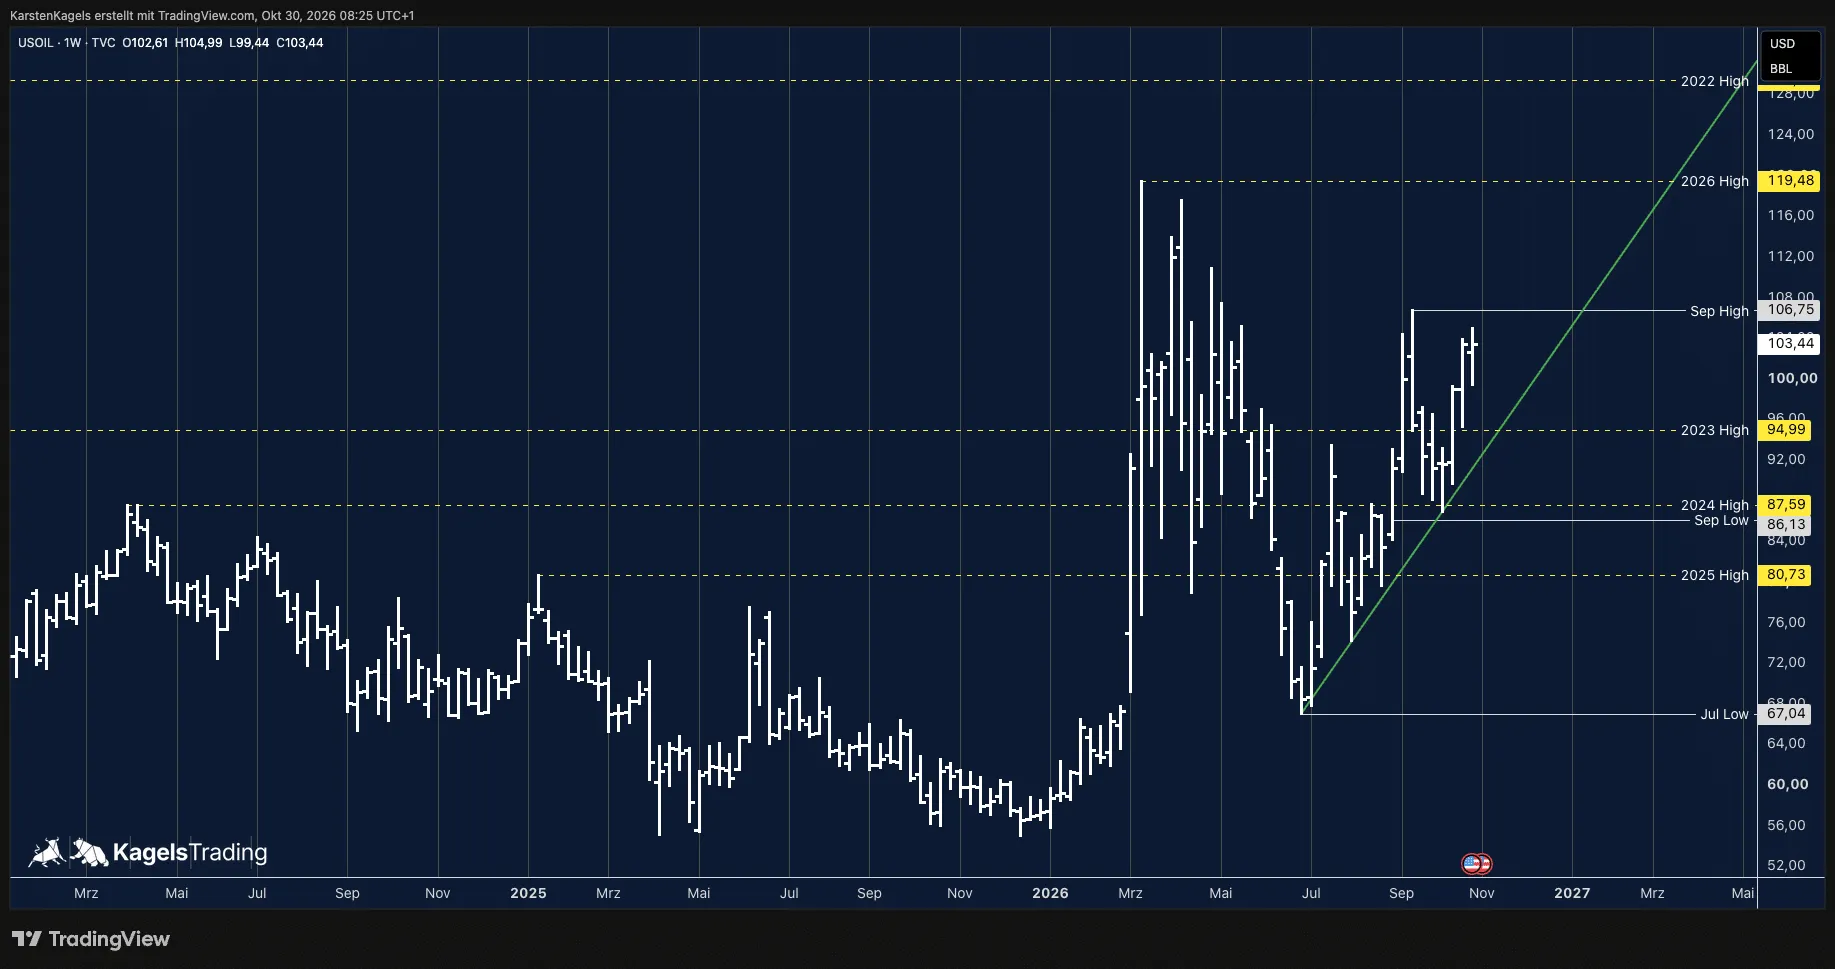
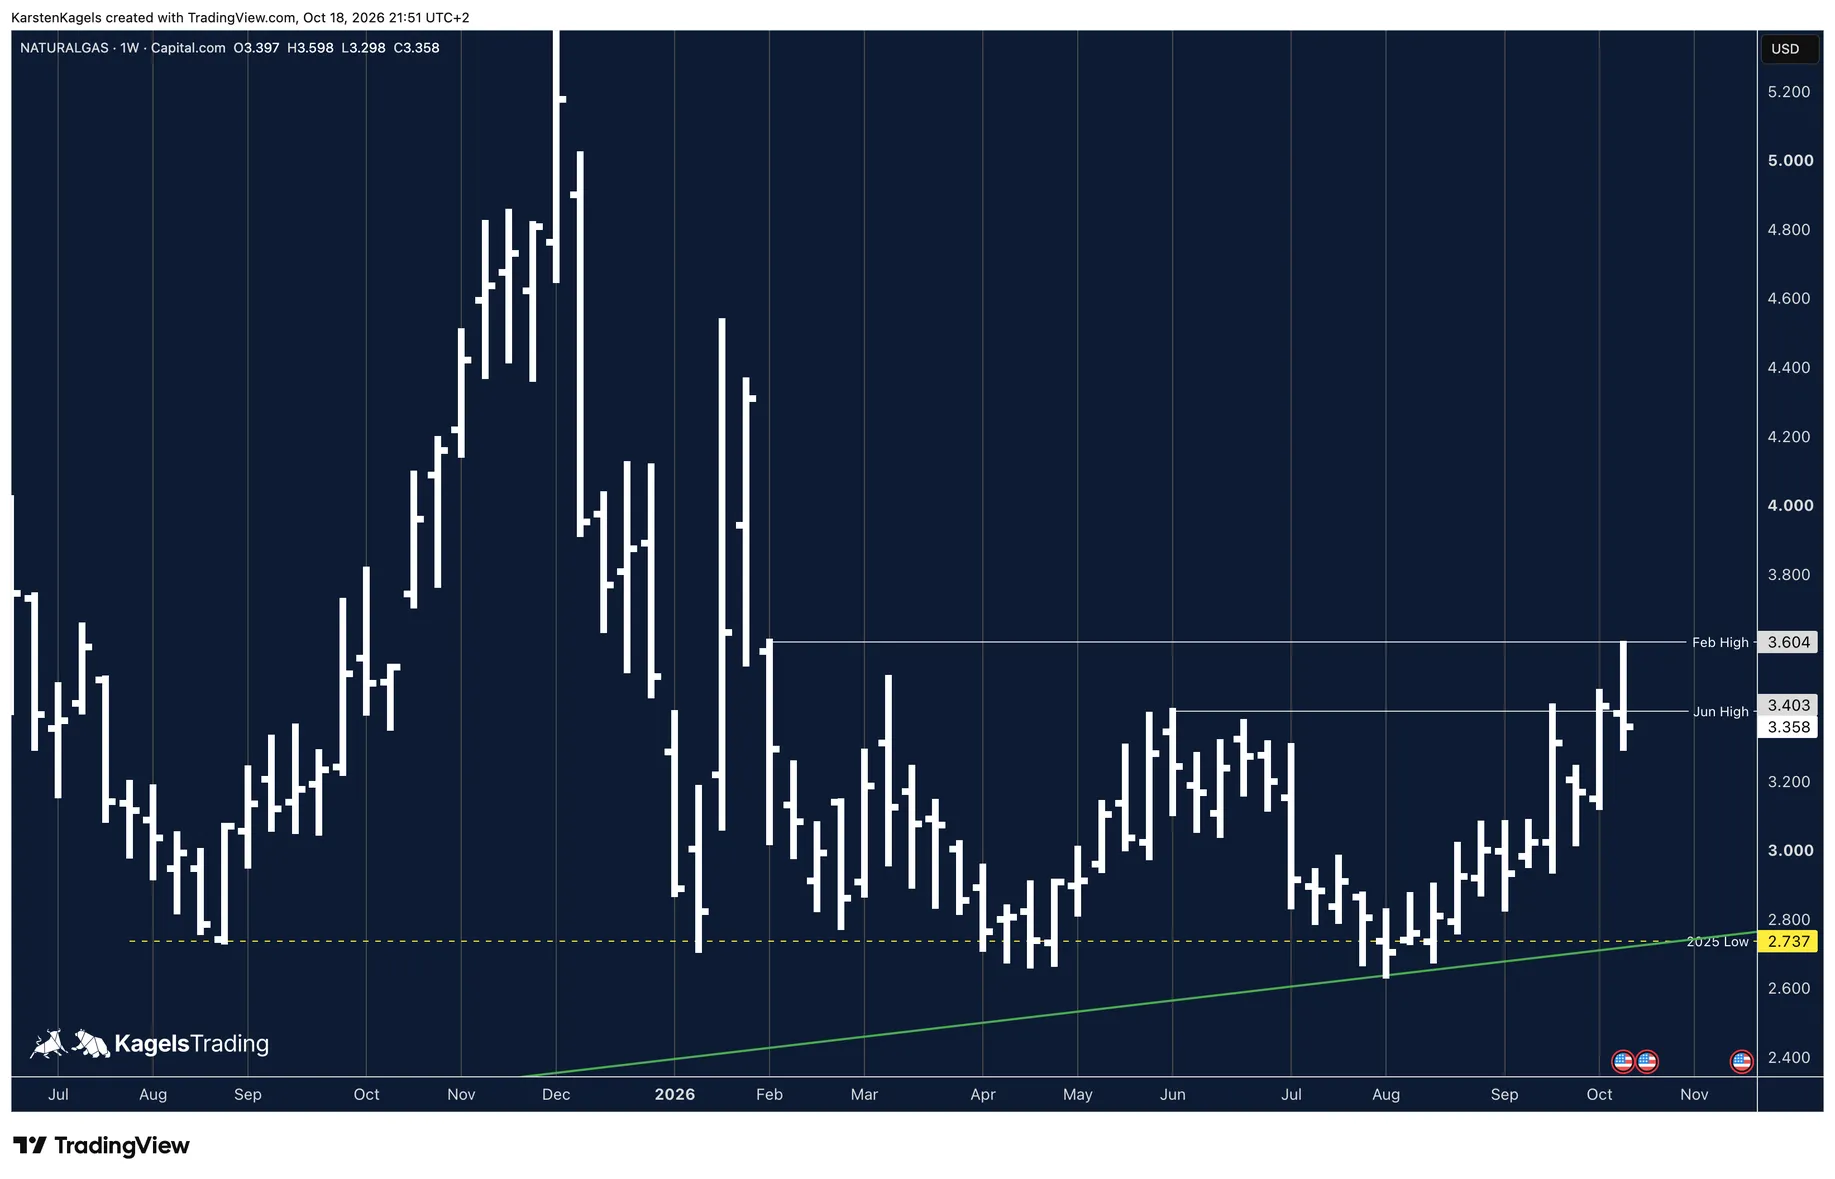
Energy
Crude oil and natural gas futures.
Forex
Currency pairs and the rate gaps behind them.
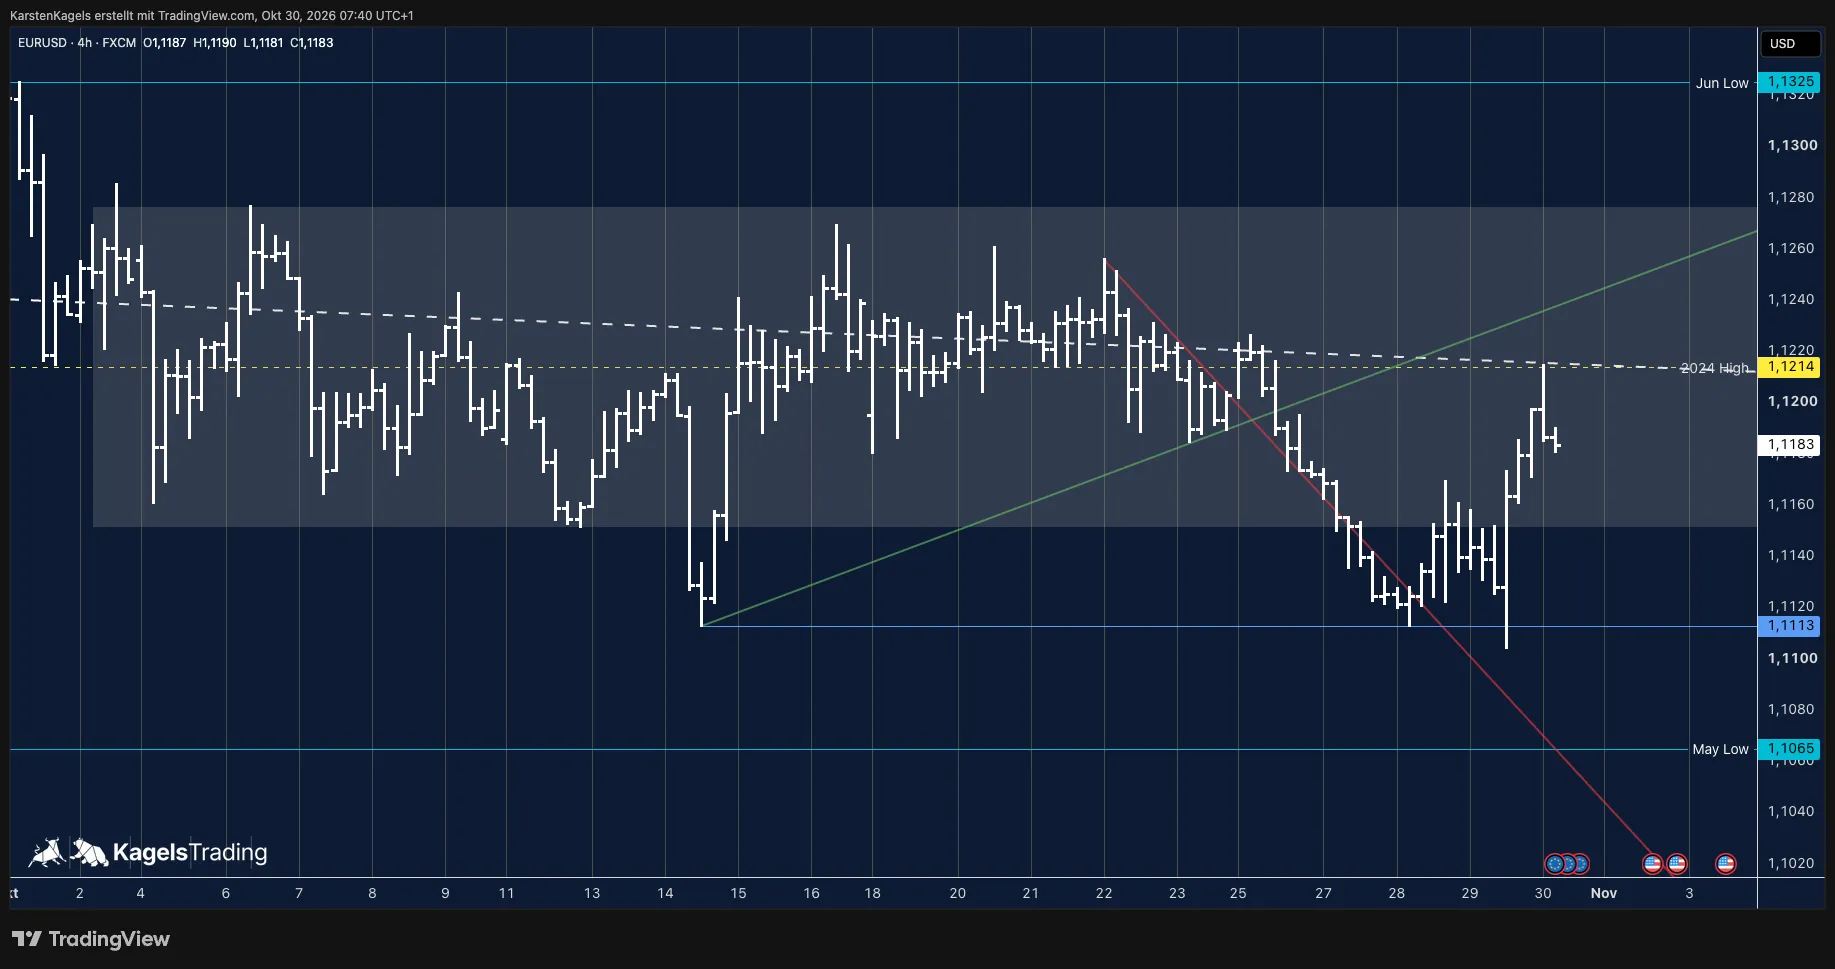
EUR/USD
EUR/USD
- Price at update
- 1.1183
- Updated
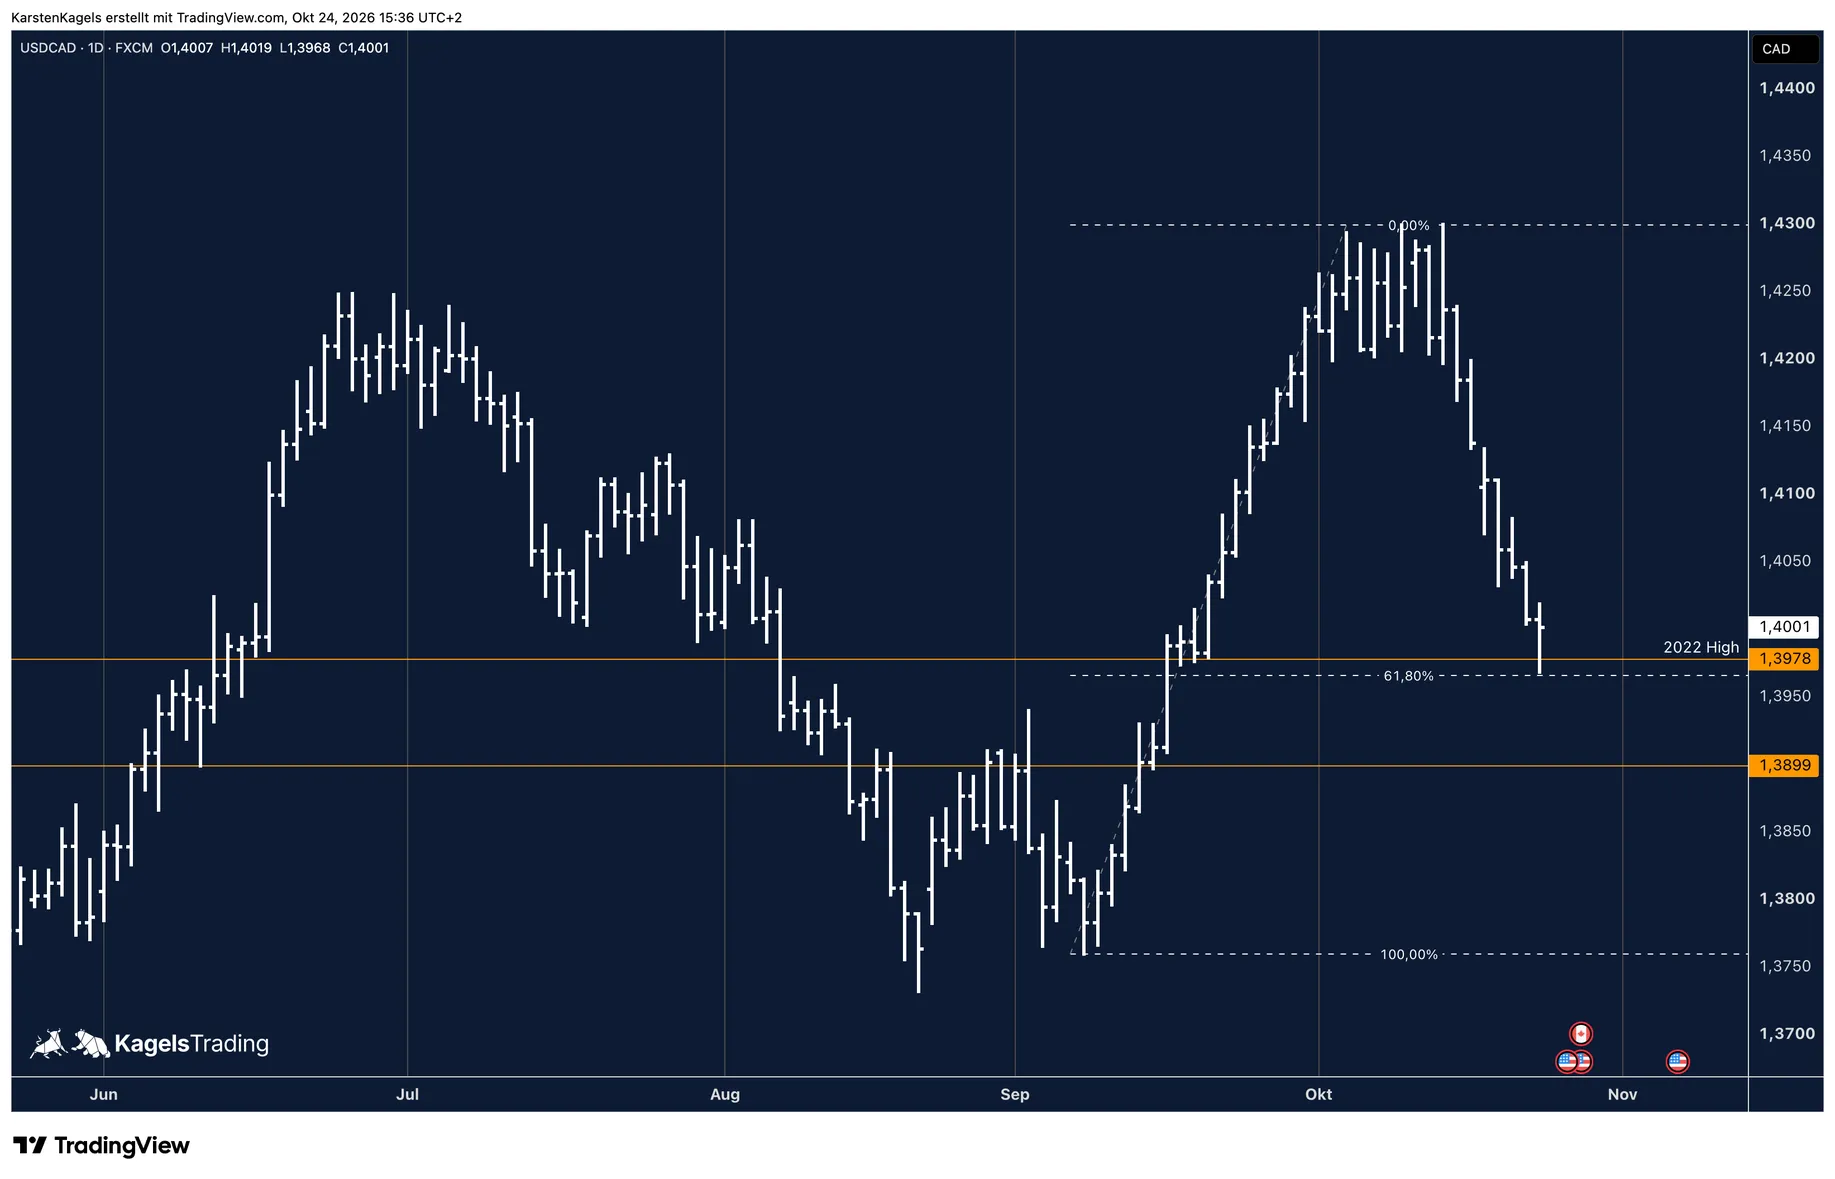
USD/CAD
USD/CAD · FXCM
- Price at update
- 1.4001
- Updated
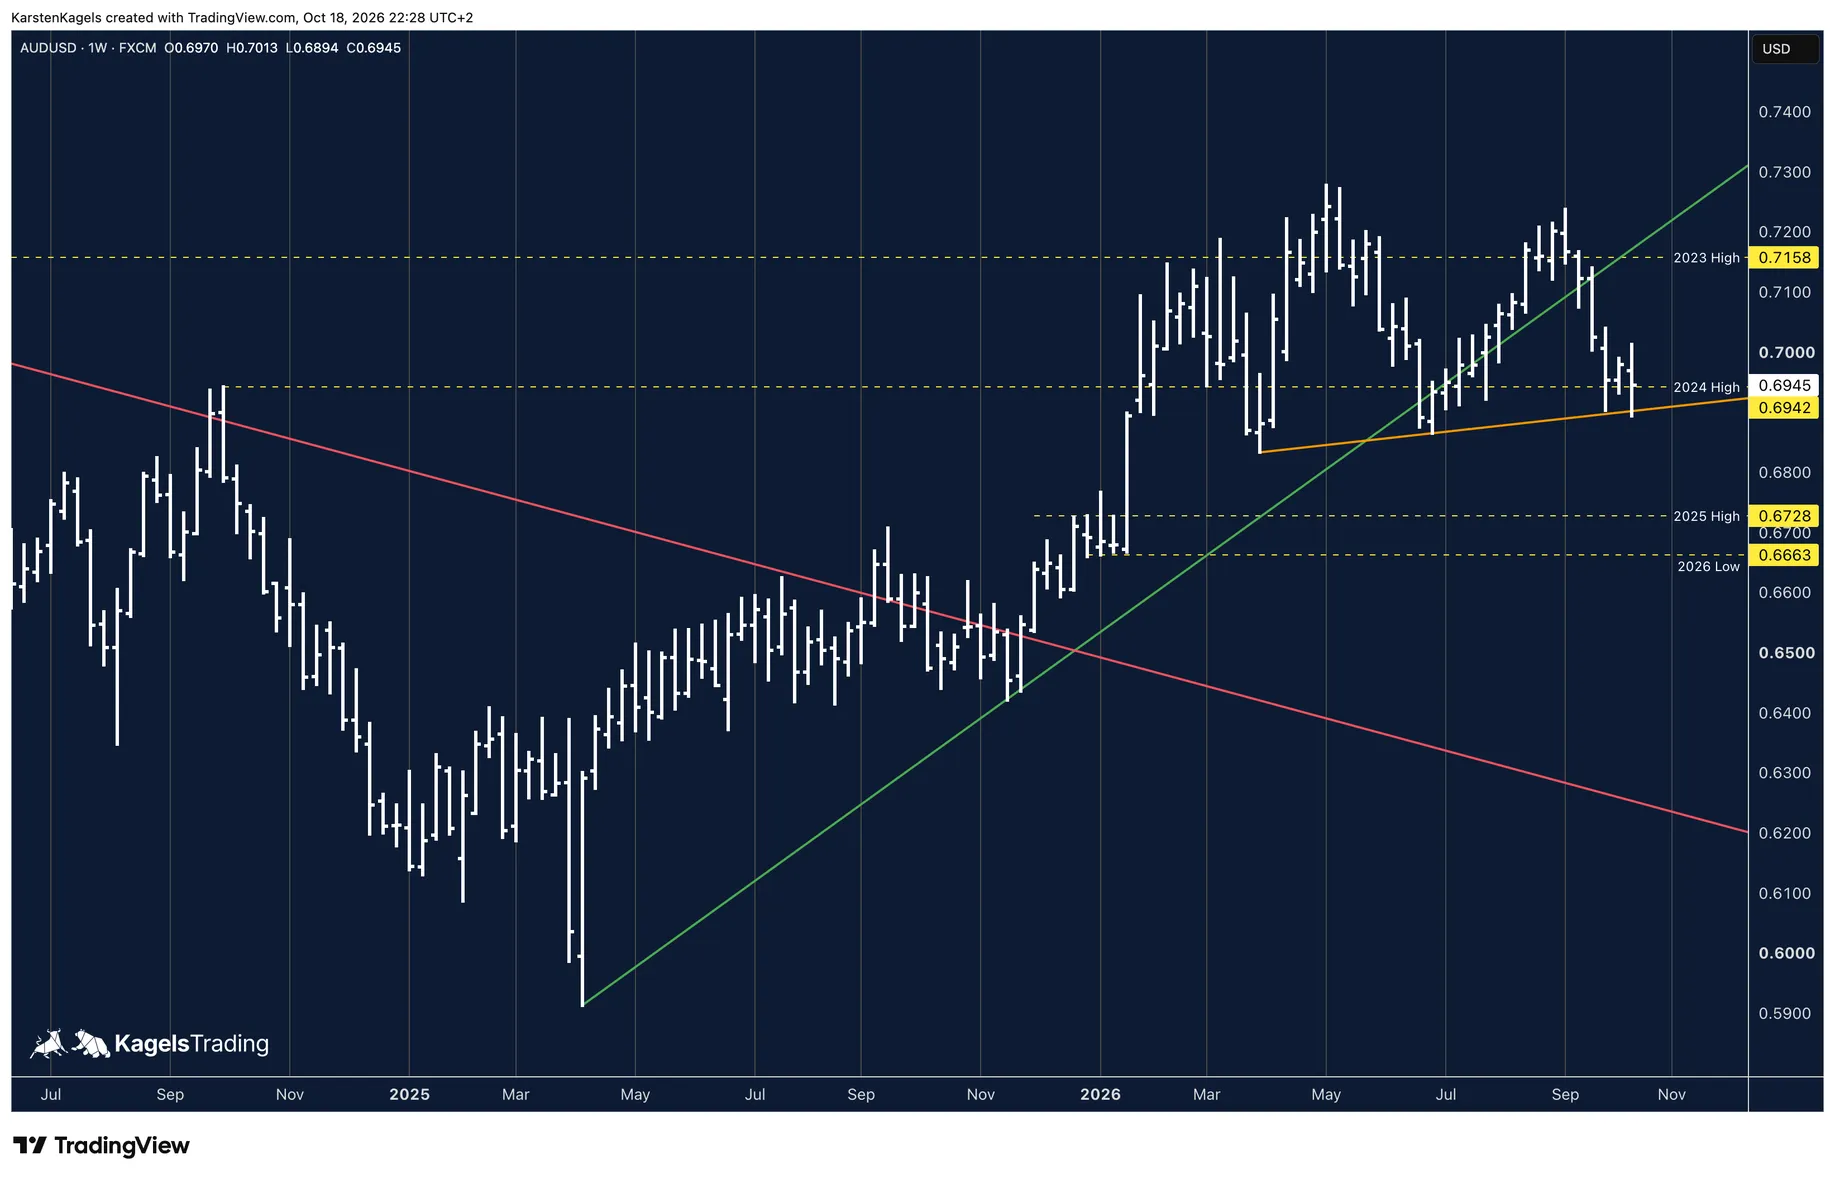
AUD/USD
AUD/USD · FXCM
- Price at update
- 0.6945
- Updated
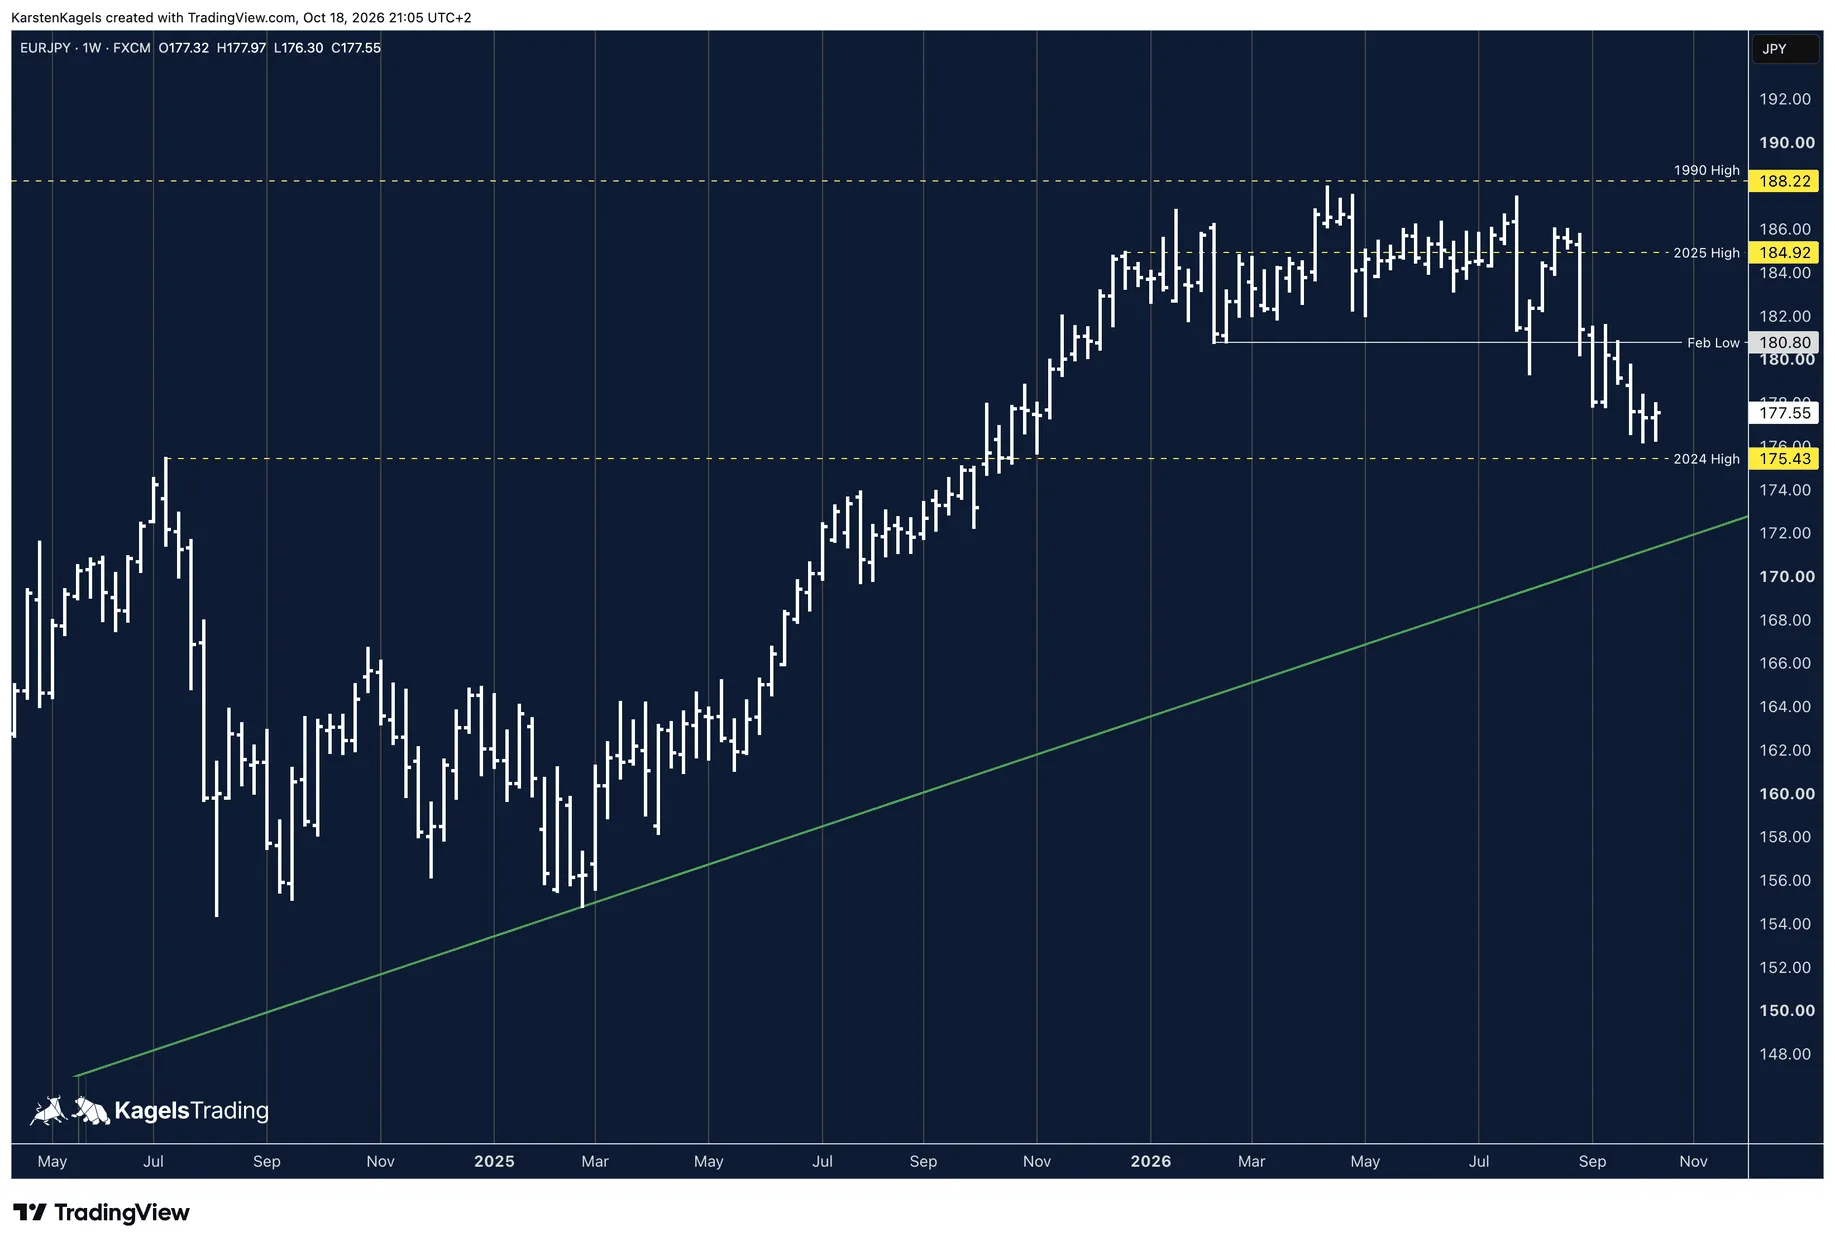
EUR/JPY
EUR/JPY · FXCM
- Price at update
- 177.55
- Updated
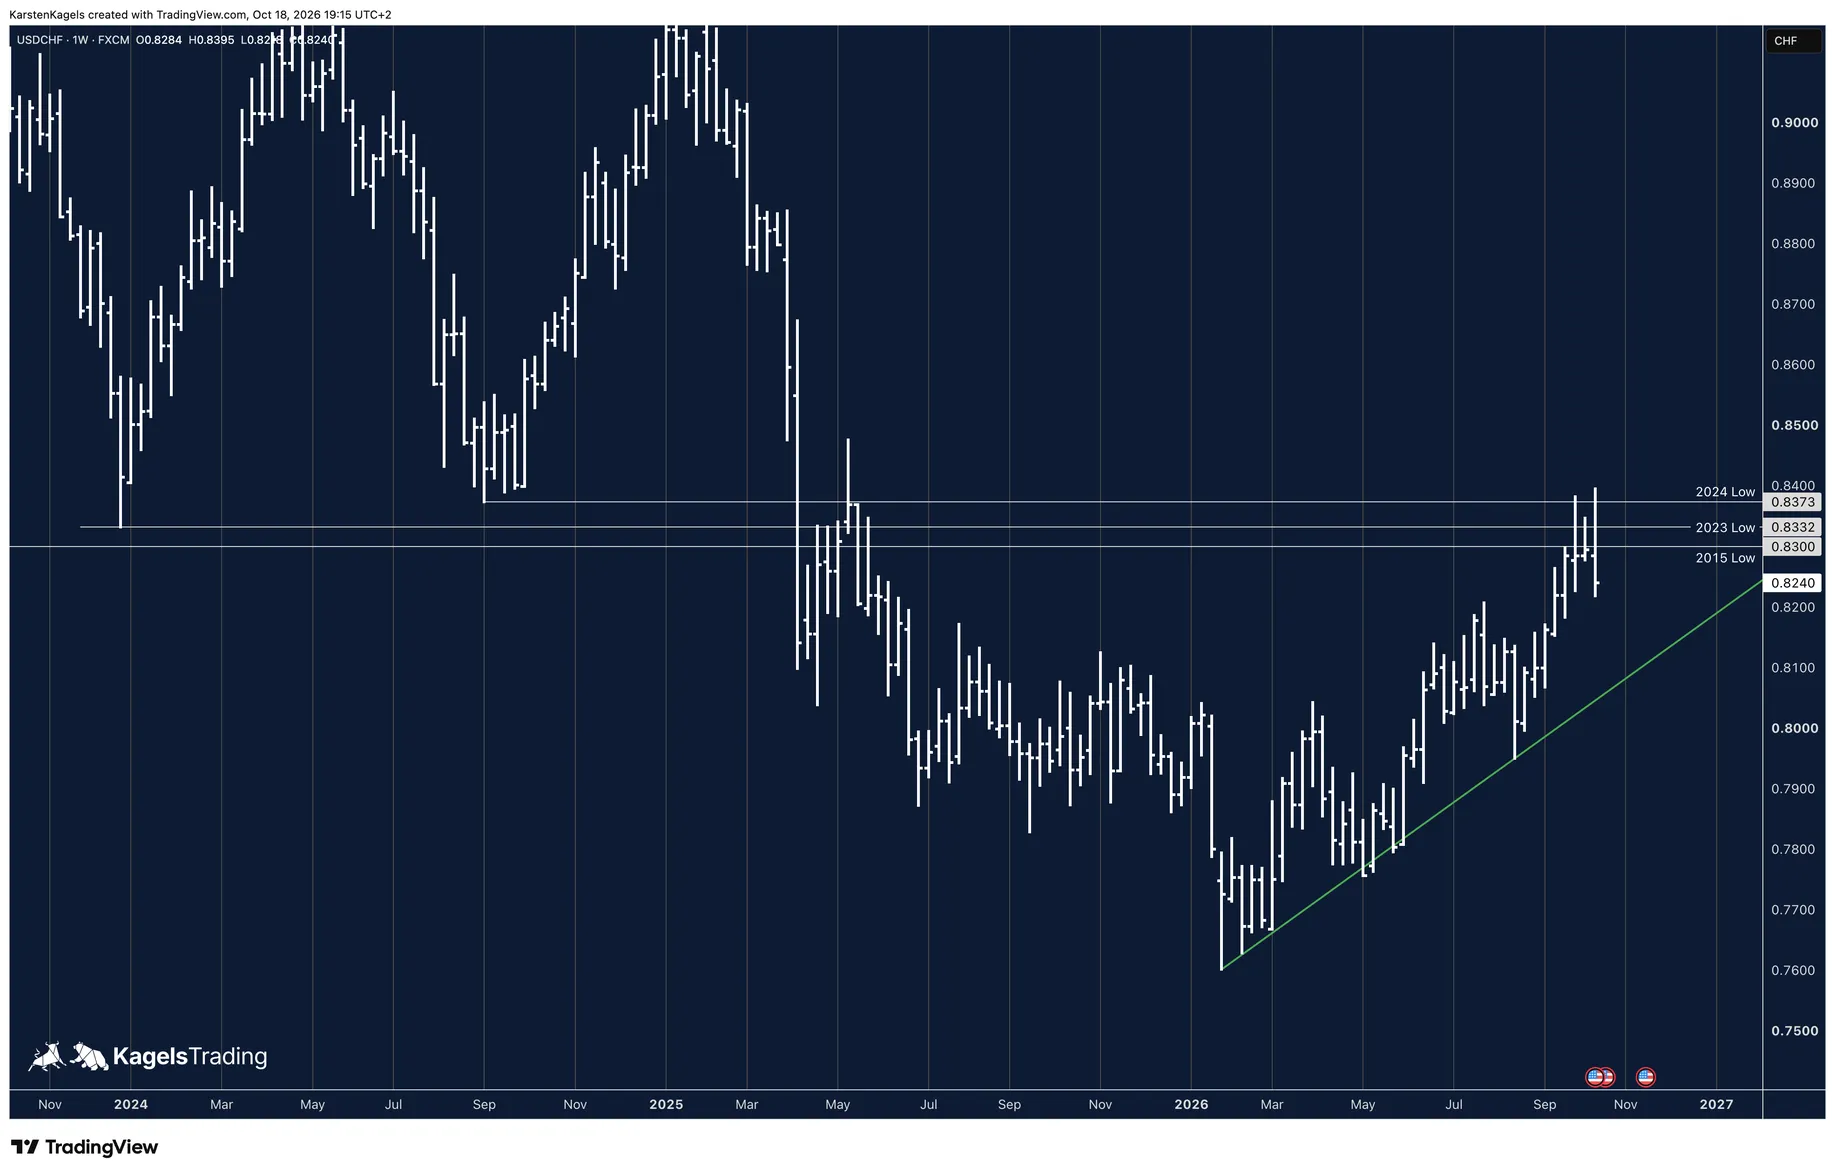
USD/CHF
USD/CHF · FXCM
- Price at update
- 0.8240
- Updated
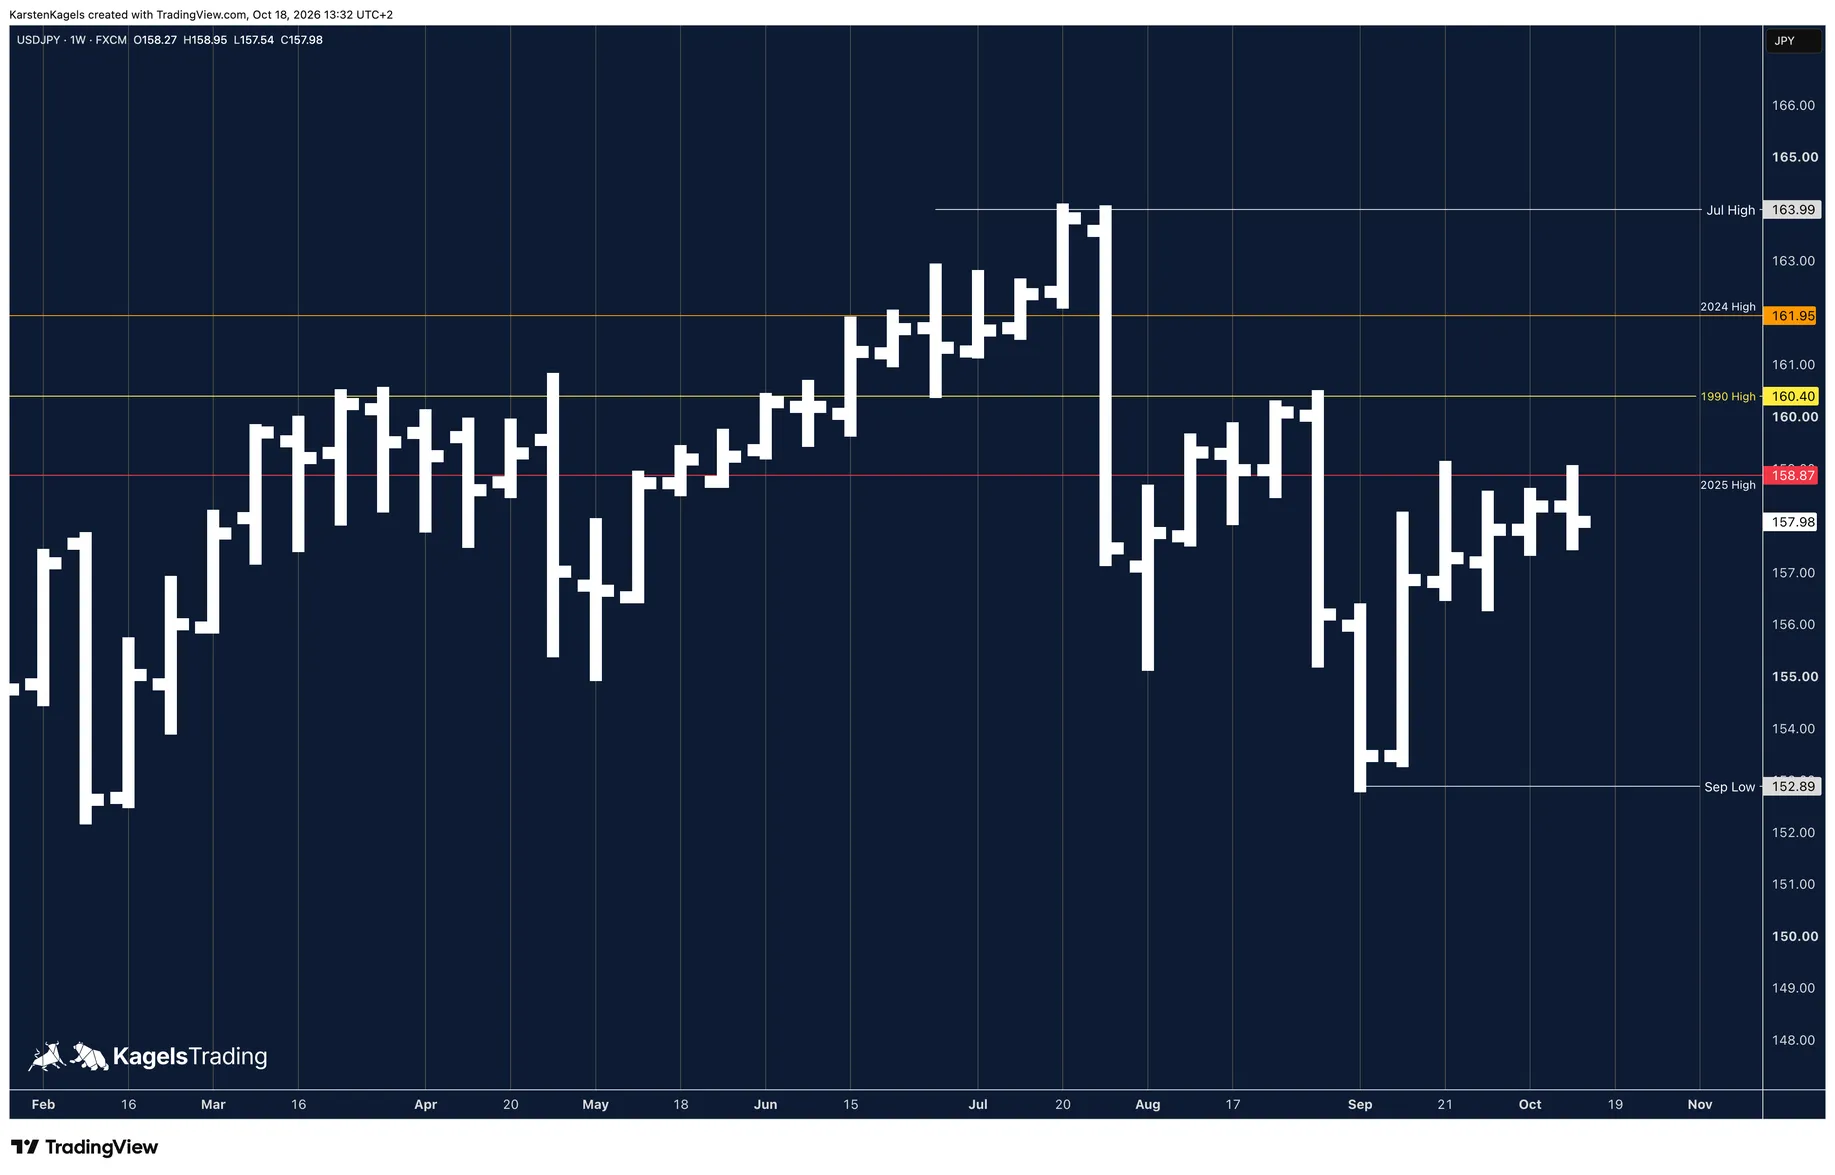
USD/JPY
USD/JPY · FXCM
- Price at update
- 157.98
- Updated
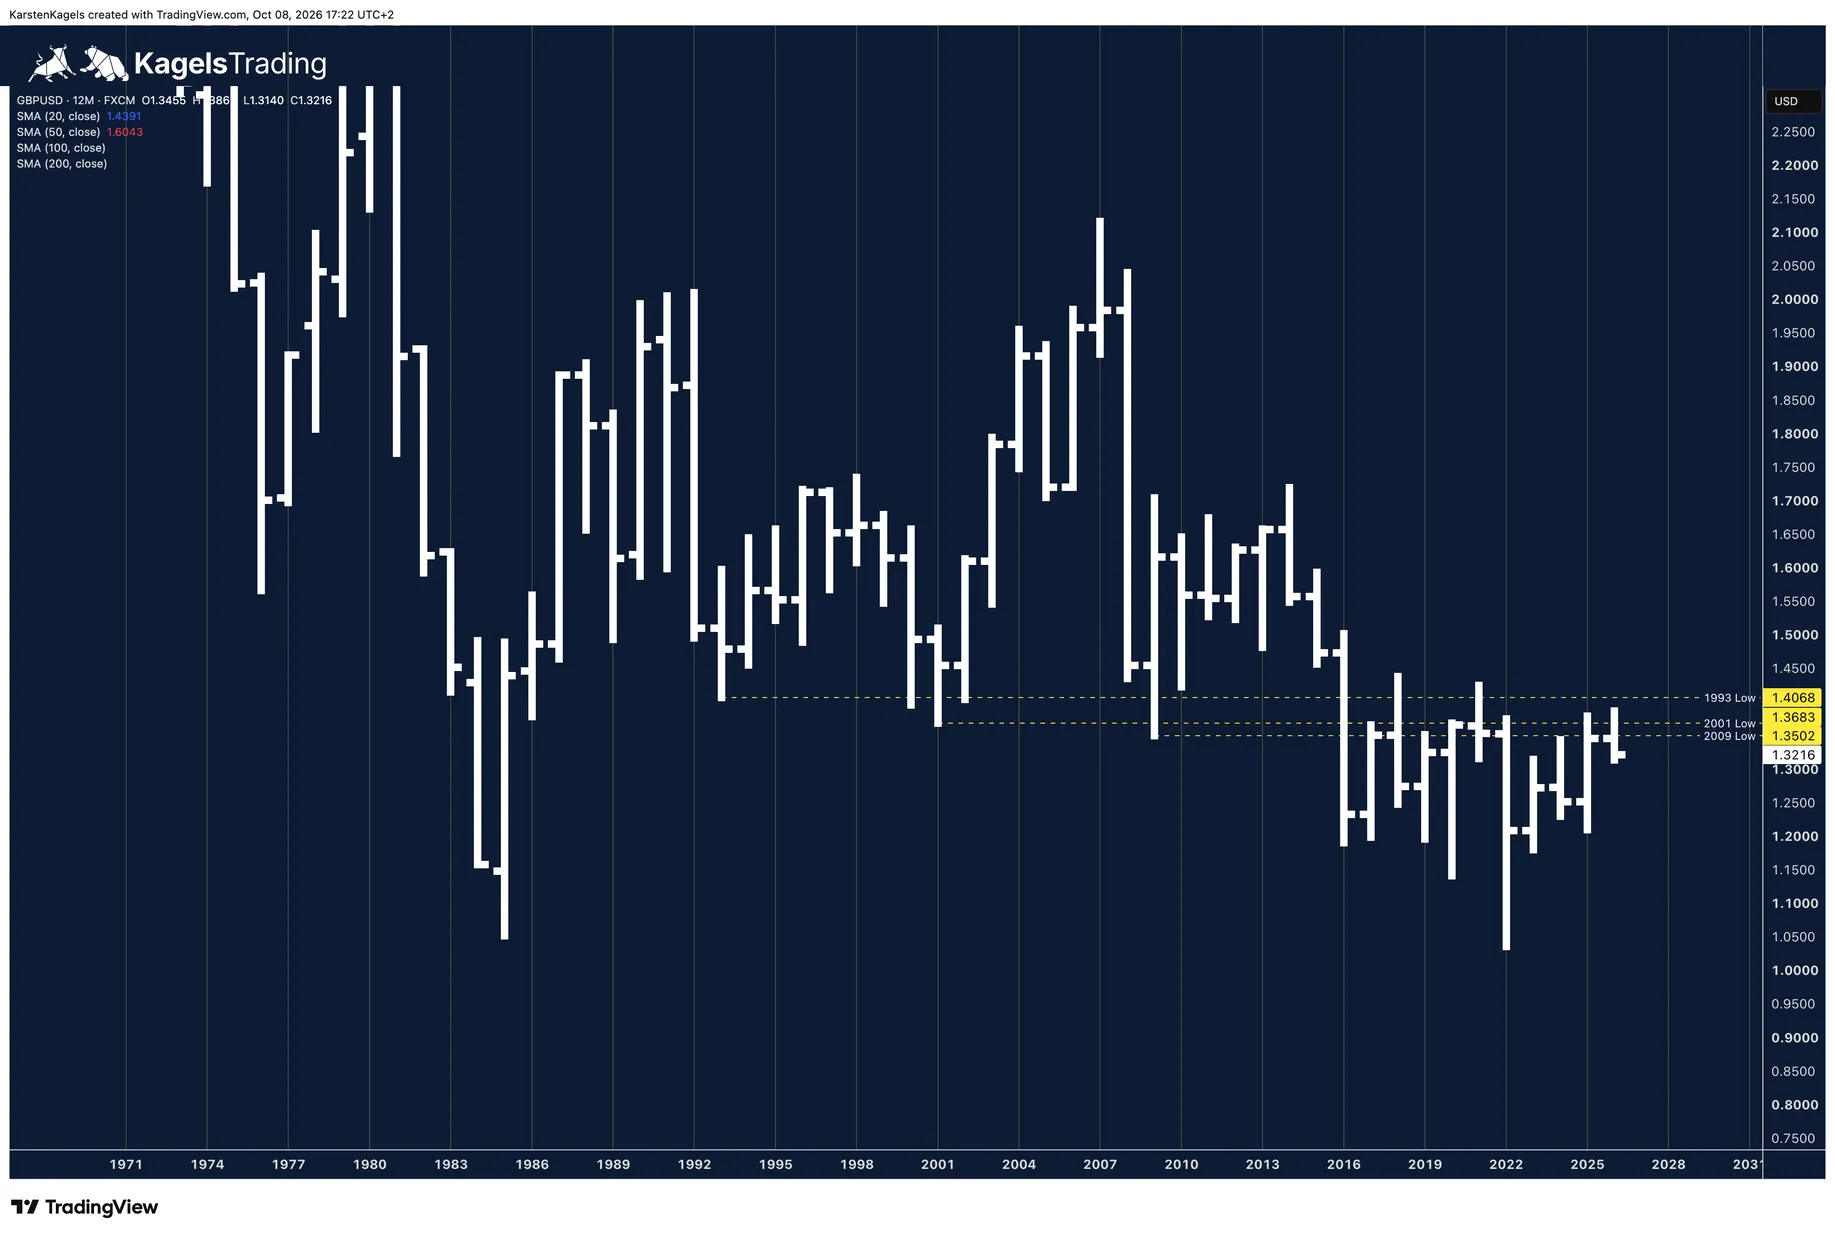
GBP/USD
GBP/USD · FXCM
- Price at update
- 1.3214
- Updated
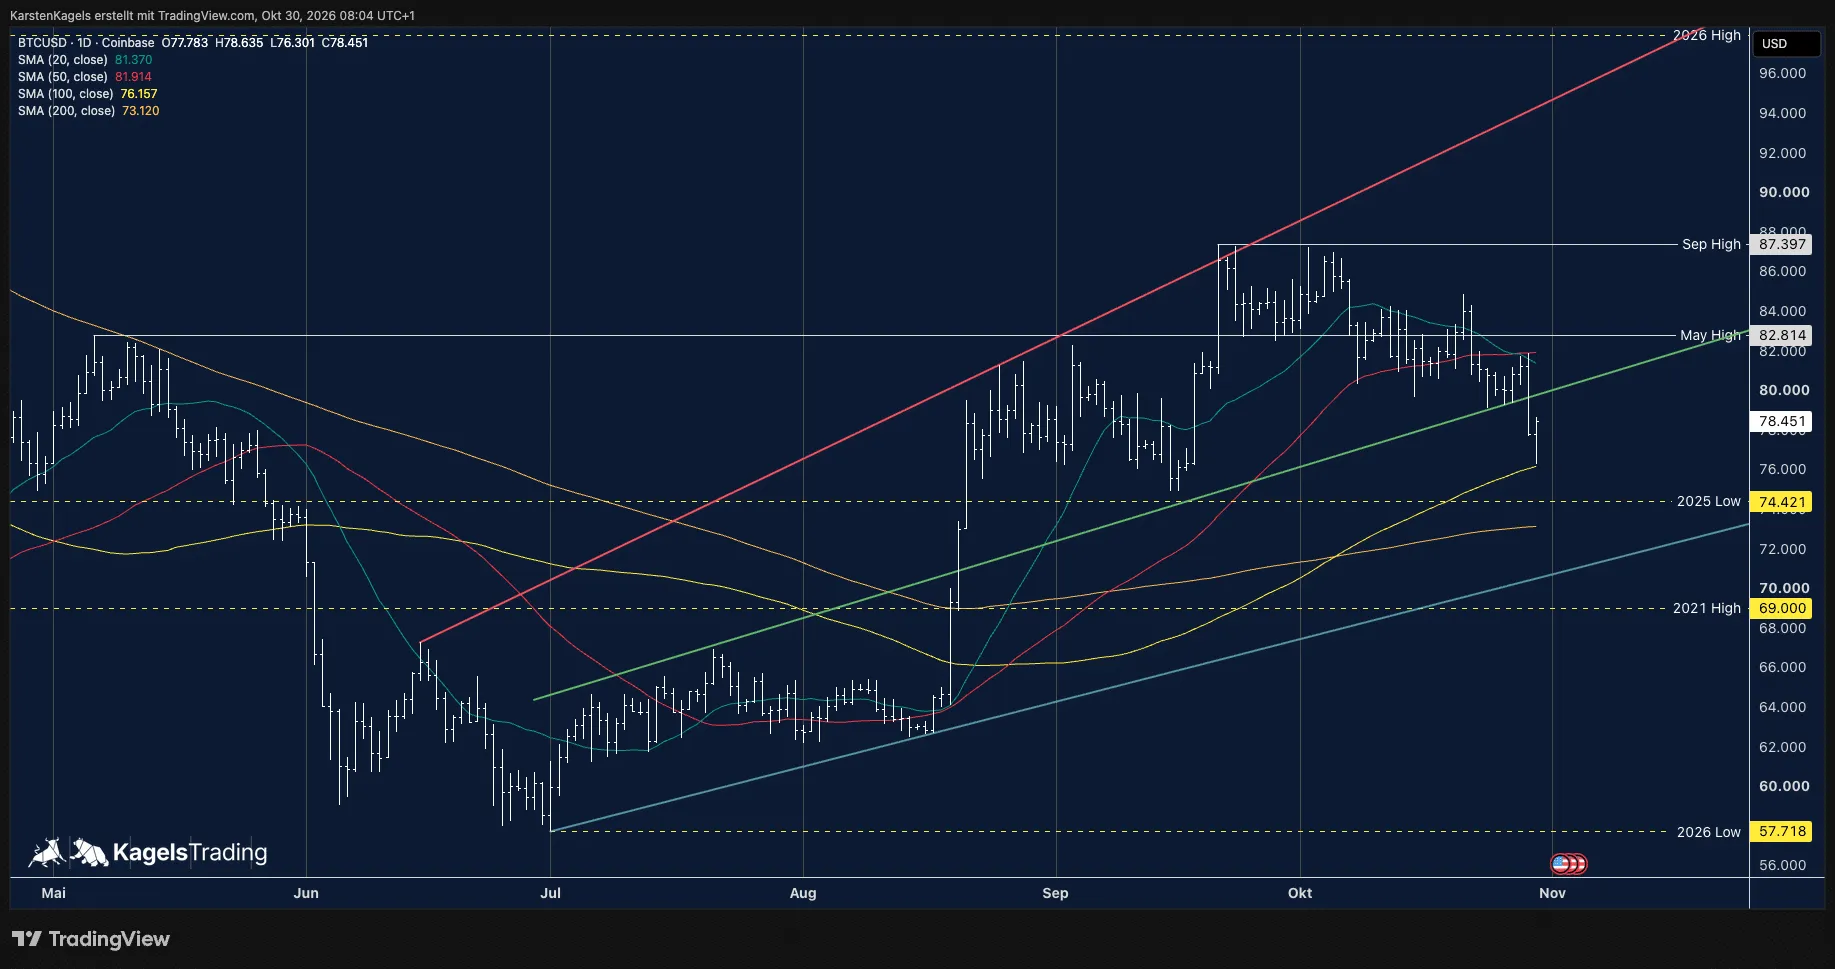
Crypto
Bitcoin against the US dollar.
Interest rates
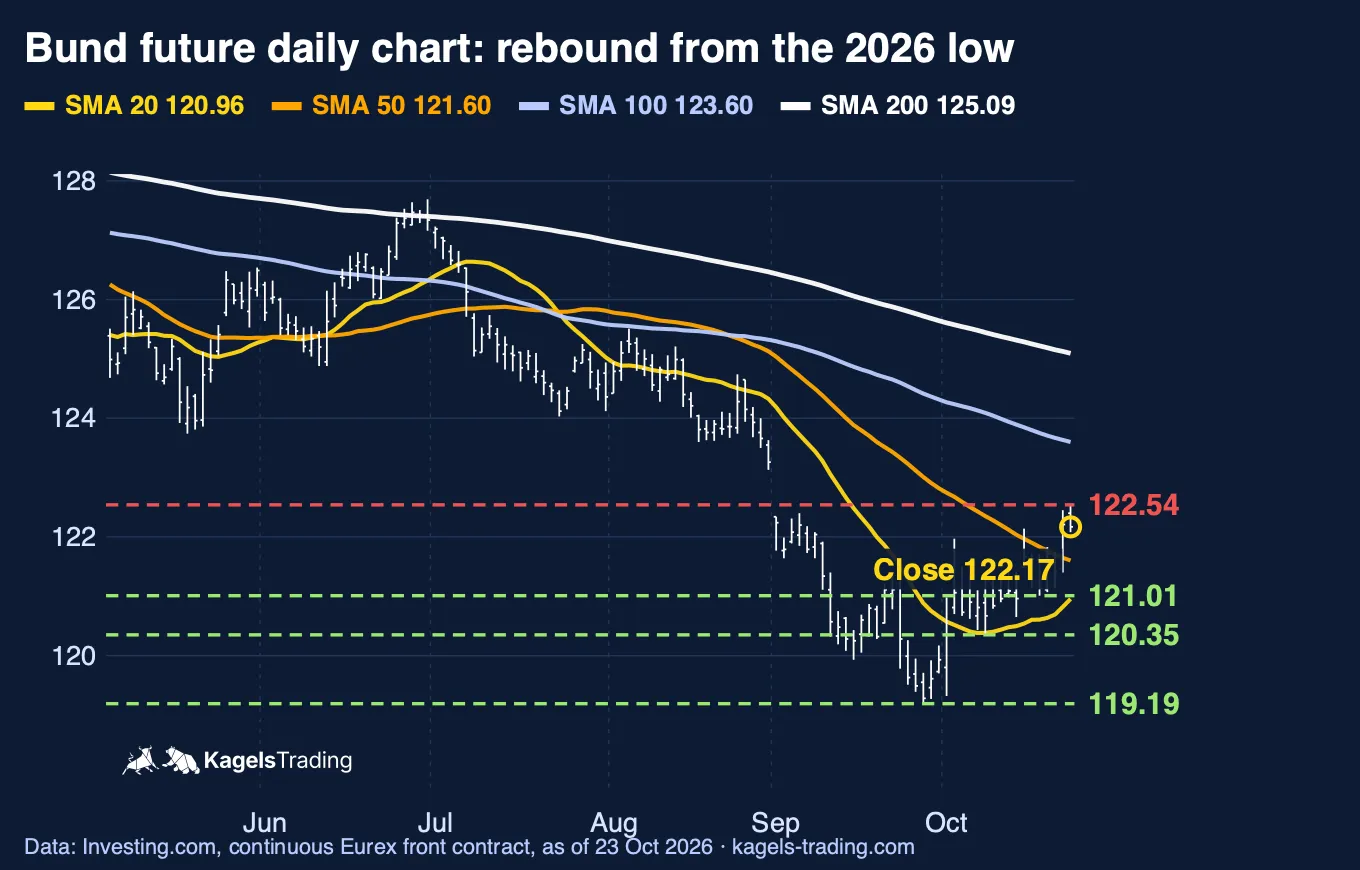
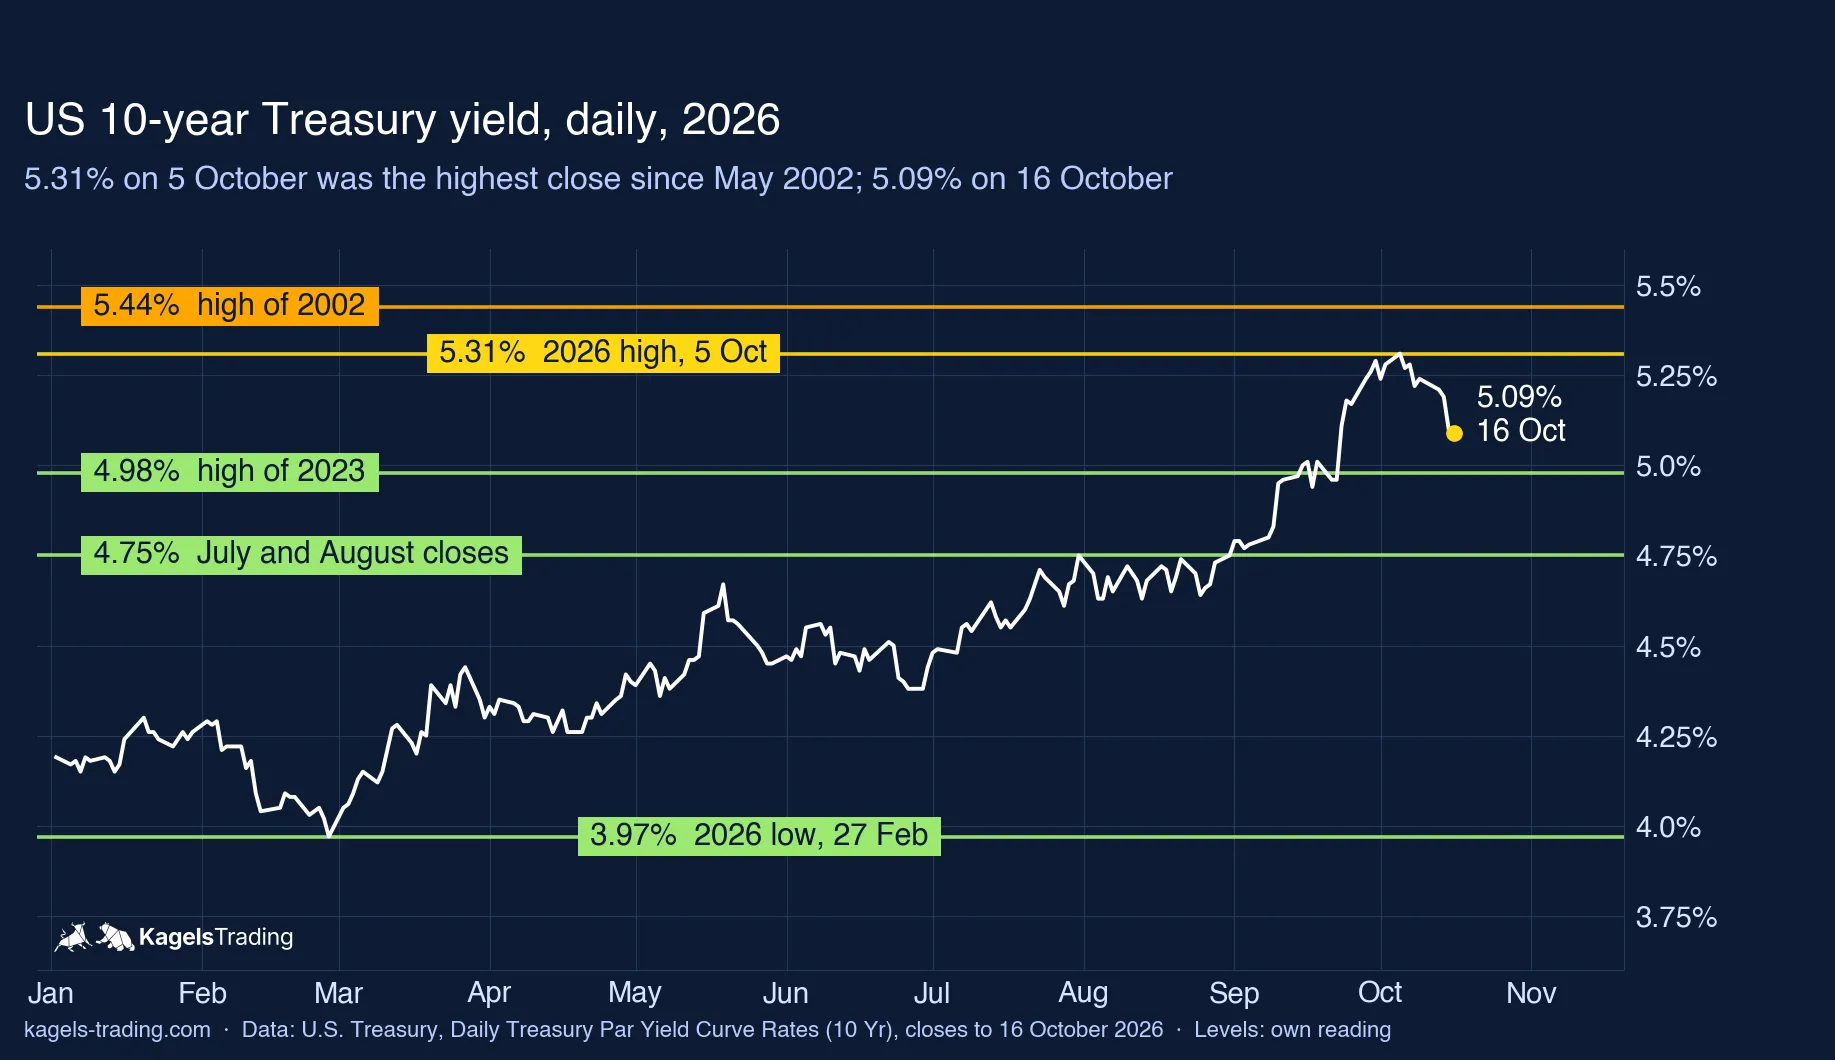
The Fed, Treasury yields and government bond futures.
Stocks & private companies
Share-price forecasts for listed companies and valuation outlooks for private companies.
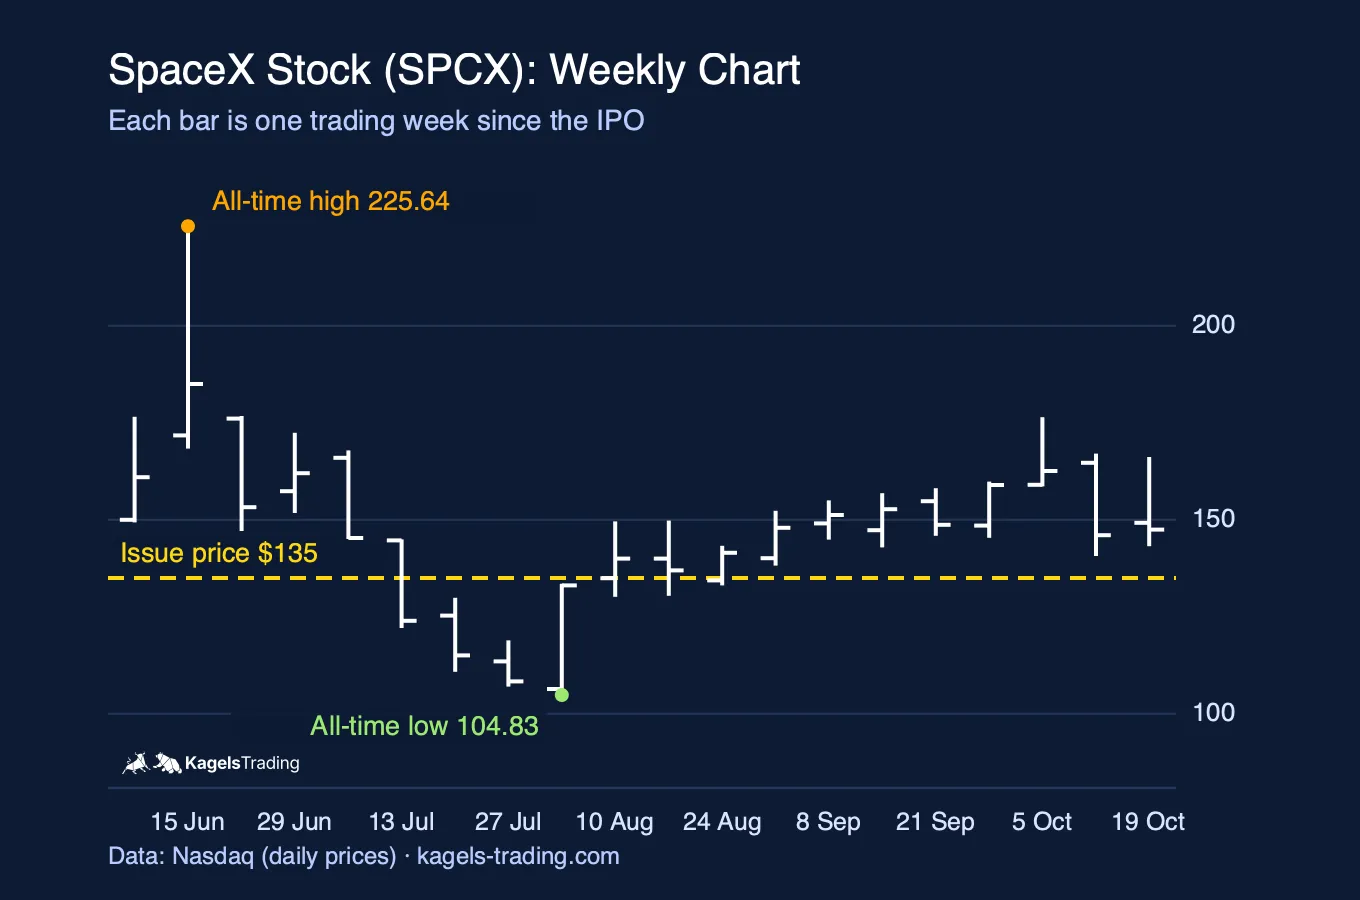
Listed stocks
Private companies
These figures are company valuations, not publicly traded share prices.
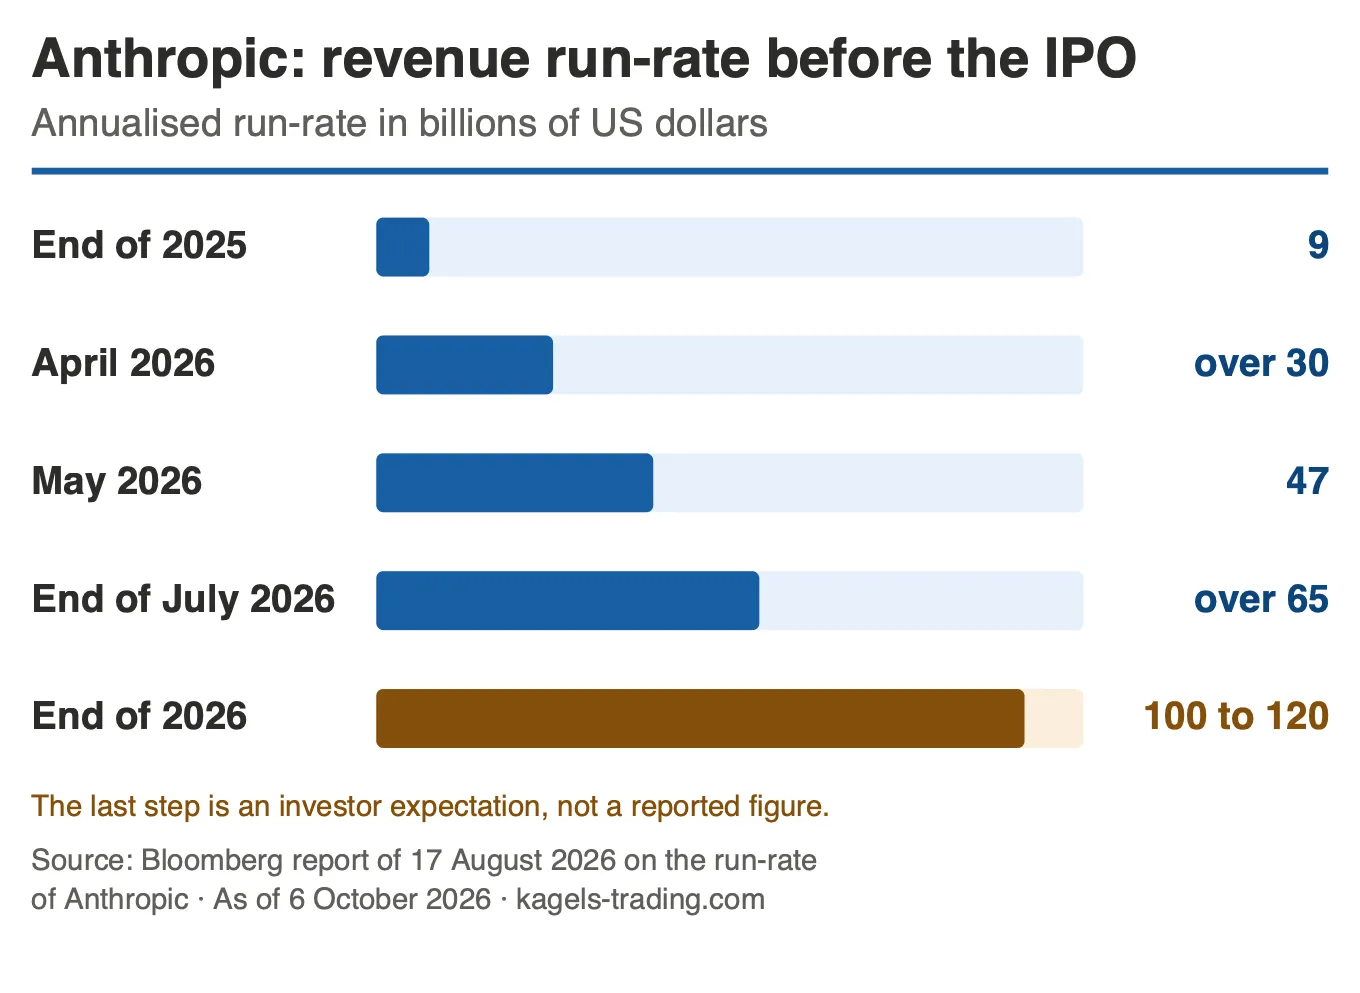
Anthropic
Not listed yet · ANT applied for
Private company · not publicly traded
- Valuation at update
- $965bn
- Updated
Valuation basis: Funding round of May 2026, post-money
What changed: Public S-1 filed on 26 October: ticker ANT applied for, first operating profit of $974 million in Q2, roadshow from 10 November at the earliest.
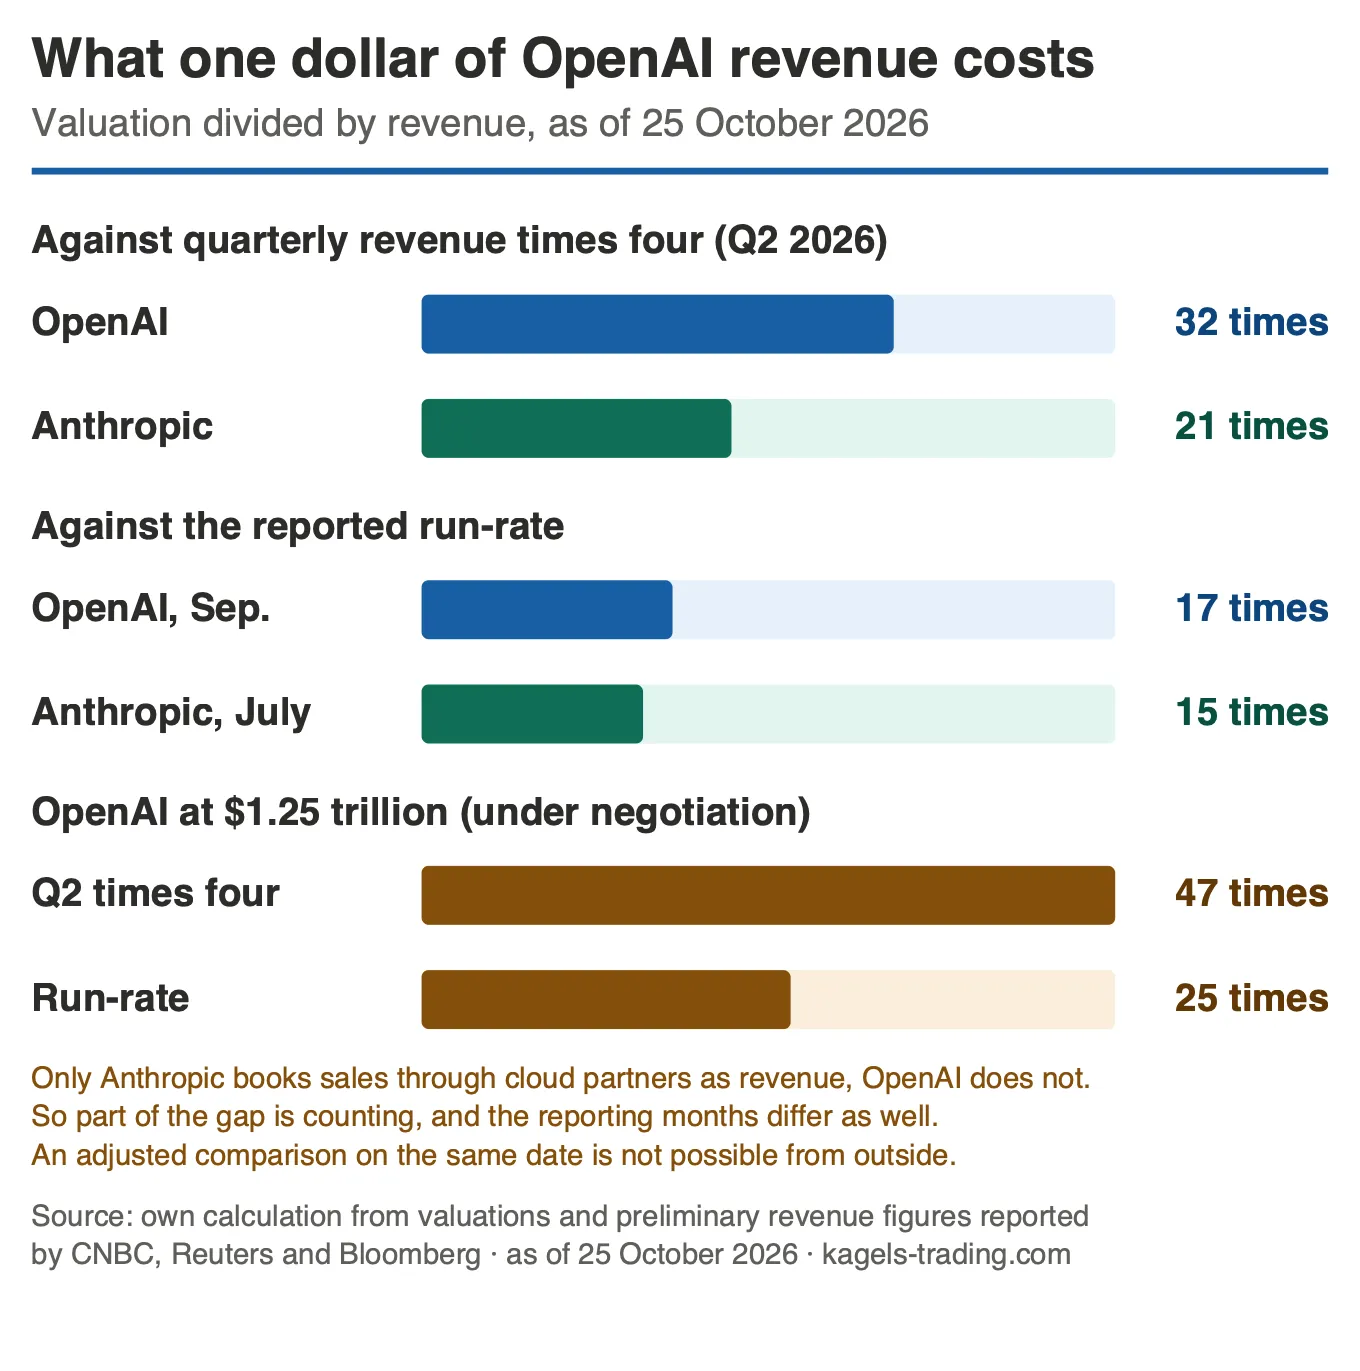
OpenAI
Not listed yet · no ticker
Private company · not publicly traded
- Valuation at update
- $852bn
- Updated
Valuation basis: Funding round of 31 March 2026, post-money
What changed: The reported private round is now $1.25 trillion before new money, down from about $1.4 trillion in September. The confirmed $852 billion is unchanged.
More markets will follow. How we build and update the forecasts: How we work.