
Liquidity Sweep: How to Spot It and Trade the Reversal


Contents
- Liquidity sweep in 30 seconds
- What is a liquidity sweep?
- Liquidity sweep vs liquidity run: the reaction decides
- Liquidity sweep, liquidity grab and stop hunt
- Which level matters? Internal and external liquidity
- How large traders use liquidity sweeps, according to SMC
- How to spot a liquidity sweep: the checklist
- Trading a liquidity sweep step by step
- How I use liquidity sweeps in my own trading
- Reversal or continuation: real SPY examples
- What fixed rules did on SPY and gold
- Liquidity sweeps on different timeframes
- The limits of the concept
- Conclusion: a sweep shows where a level did not hold
- Frequently asked questions about liquidity sweeps
- About the author
An obvious low breaks for a moment, and a little later price stands higher than before. Traders call this picture a liquidity sweep. The usual explanation: below the low sat the stop-loss orders of buyers and the sell orders of breakout traders, the break triggered them, and the other side absorbed them. What the chart shows is only the sequence, not the orders and not the people behind them.
I have traded pure price action since 1980, and few patterns show up as often as a short break of an obvious level. In this guide I show you what a liquidity sweep is, how to tell it from a liquidity run, which levels matter, and what fixed rules did on 25 years of SPY and on gold. The result is more sober than most videos suggest.
Liquidity sweep in 30 seconds
- Meaning: a liquidity sweep is a short break above an obvious high or below an obvious low after which price closes back inside the range. The usual explanation is that the break triggered stop orders waiting there.
- The SMC reading: large traders need the triggered orders as counterparties. Who traded in a single case is not visible on the chart.
- How to spot it: the close is back inside the range. A long wick alone is not enough. A break of structure the other way is the confirmation many traders wait for before a trade.
- Three outcomes: if the break bar closes beyond the level, it is a liquidity run. If the reaction is unclear, there is no trade.
- Our test: with fixed rules, sweeps gave no stable edge on SPY (since 2001) or the gold ETF GLD (since 2004). With confirmation, SPY was slightly positive and gold negative.
What is a liquidity sweep?
A liquidity sweep is a short break above an obvious high or below an obvious low that can trigger the stop-loss and pending orders waiting there, after which price closes back inside the previous range.
Above highs and below lows, traders expect a lot of orders. There are stop-loss orders, which protect open positions, and pending orders from breakout traders. For the currency market this link is documented. A New York Fed study by Carol Osler (Staff Report 150, 2002) found that exchange rates trend unusually fast when they reach levels where stop-loss orders cluster. Triggered stops add to the move instead of slowing it, which the study calls price cascades.
The term itself comes from the Smart Money Concepts (SMC). They go back to Michael Huddleston, known as the Inner Circle Trader (ICT). The idea is much older: the Wyckoff spring described a short break below support with a quick return about 100 years ago.
SMC traders read this move as deliberate rather than accidental. They see it as a collection of liquidity, after which the real move starts, usually in the opposite direction. To an inexperienced trader it looks like a false breakout. What the chart can prove is only the sequence: whether a large trader pushed price through the level or only used the triggered orders stays open.
Buy-side and sell-side liquidity
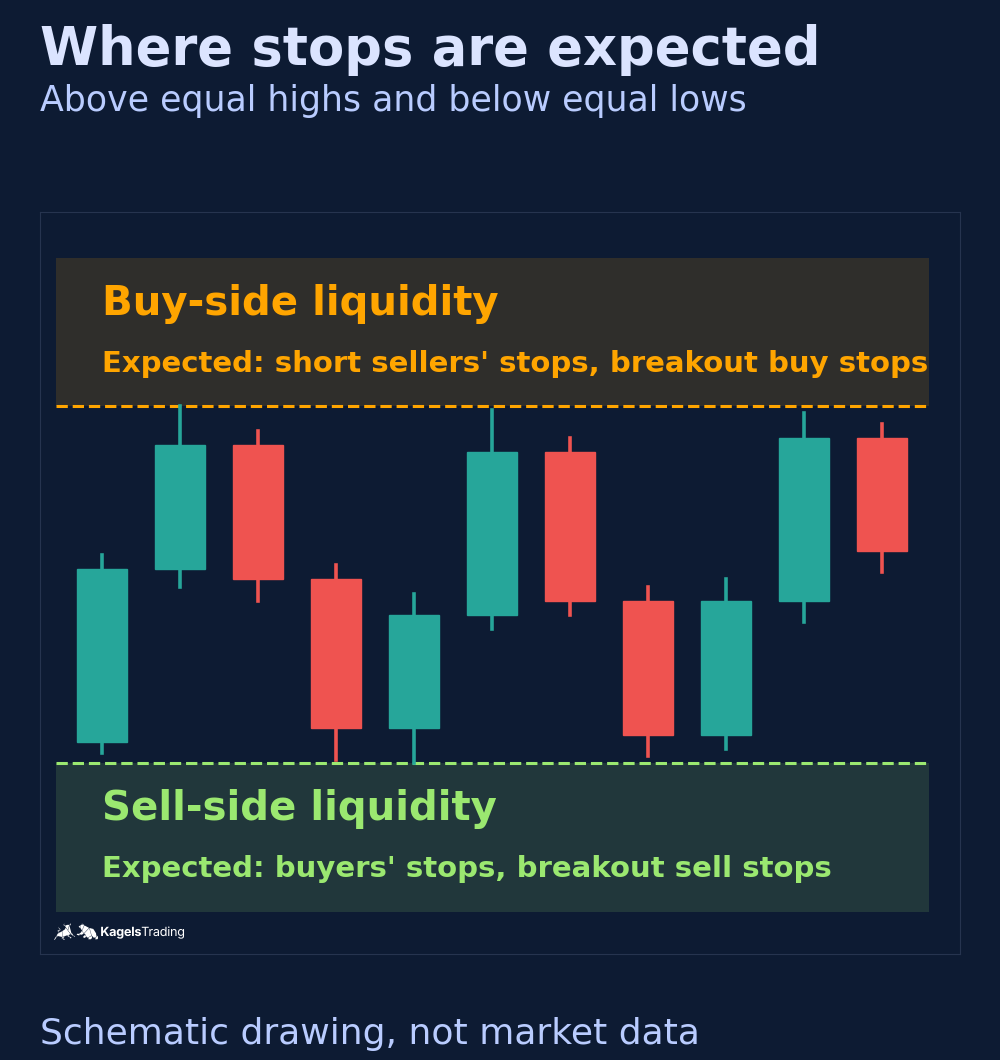
Buy-side liquidity is the cluster of buy orders that traders expect above obvious highs. It is made of the stops of short sellers and the buy stops of breakout traders. All of them buy when price trades through the high.
Sell-side liquidity is the cluster of sell orders that traders expect below obvious lows. It is made of the stops of buyers and the sell stops of breakout traders. All of them sell when price trades through the low.
A liquidity pool is a price zone where many stop and pending orders are expected, typically above equal highs, below equal lows or at round numbers. The graphic shows both sides in a sideways range. Round numbers such as 1.1000 in EUR/USD attract orders for the same reason.
 Click to enlarge
Source: Kagels Trading, own drawing.
Two kinds of liquidity: resting limit orders and triggered stops
The word liquidity means two different things in a sweep. Resting limit orders sit in the order book and offer the other side a price. Stop orders are conditional orders. At the CME, according to the exchange, a stop order “does not immediately go on the book, but must be triggered by a trade” at its price (CME Group, Futures Order Types). Once triggered, a stop with protection becomes a market order and takes resting liquidity. A stop-limit order becomes a limit order and can rest in the book if it cannot fill at once.
This sets a hard limit: nobody can see stop clusters in full. The public order book does not show them, and volume analysis shows traded volume per price, not waiting stops. When we speak of buy-side and sell-side liquidity, it is a reasoned guess about where stops sit, not a measurement.
Liquidity sweep vs liquidity run: the reaction decides
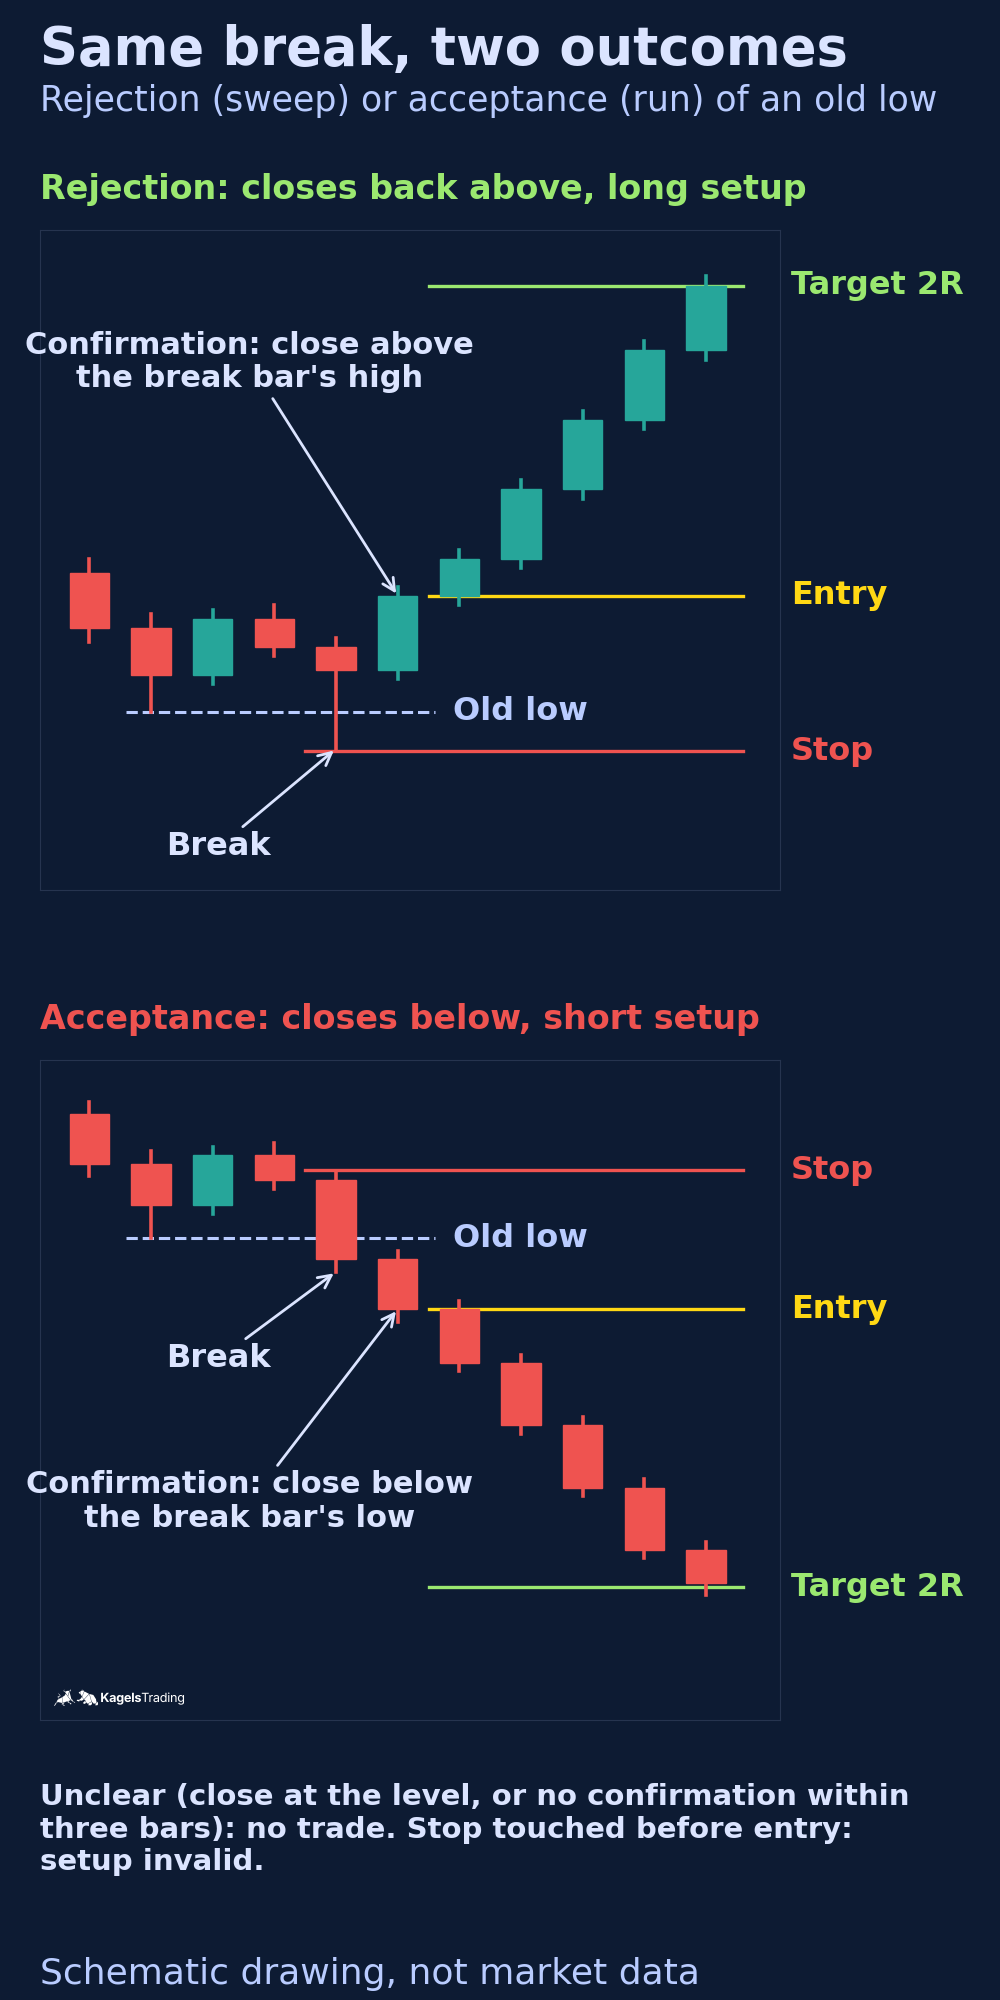
A sweep and a run start the same way. Price breaks an obvious high or low and can trigger the stop orders there. As long as the reaction is open, I only call it a level break. The difference shows in what follows.
A liquidity run is a break where the break bar closes beyond the level instead of returning into the previous range.
In a sweep the break bar closes back inside the range. The level is rejected, and the break becomes a false breakout. That is the base for a counter-trend setup back into the range.
In a run the break bar closes beyond the level. If that is confirmed, a trend continuation can follow, often with rising momentum. A pullback into the breakout zone can then be a trend-following entry.
I separate three stages. First the classification of the break bar: a close back inside means sweep, a close beyond the level means run, a close exactly at the level stays unclassified. Second the confirmed setup: only the confirmation in the table turns a break into a possible trade. Third the outcome: whether price really turns or keeps going only shows later.
 Click to enlarge
Source: Kagels Trading, own drawing.
| Feature (break of a low) | Sweep: rejection | Run: acceptance |
|---|---|---|
| Close of the break bar | back above the low | below the low |
| Signal within 3 bars | close above the break bar’s high | close below the break bar’s low |
| Invalid (also before entry) | trade below the break bar’s low | trade above the break bar’s high |
| Typical candle | often a long wick, not a signal alone | often full bodies |
| Setup | reversal | with the trend |
| No trade | close at the level, or no signal | close at the level, or no signal |
In short: in a sweep the break bar closes back inside, in a run it closes beyond the level. Whether price then really turns or continues only shows later. Terms are not the same everywhere: some traders call every break of a high a sweep. Here sweep means a break with rejection and run a break with acceptance. If price swings around the level without a clear close on one side, the situation is open and there is no trade.
Liquidity sweep, liquidity grab and stop hunt
Many traders use “liquidity sweep” and “liquidity grab” as the same thing. Those who separate them use speed and size as the difference.
In SMC language, a liquidity grab is a very fast break of a level, often inside a single candle with a long wick, where traders assume stops were triggered. A sweep then means a somewhat broader move beyond the level with a return afterwards. In practice the label matters less than the principle: price broke a level briefly and did not hold it, and in the SMC reading stops were triggered. You wait for the same confirmation either way.
A stop hunt is the older, more suspicious name for the same picture. It suggests that a broker or a big player hunts your personal stop. That misses the mechanism. Large orders need counterparties, and many traders probably place their stops at the same obvious levels. Nobody needs to know your stop for this to happen.
Which level matters? Internal and external liquidity
Traders expect liquidity almost everywhere on a chart. Above every high and below every low there can be stops. Whoever marks every level sees only lines. The real question is which level matters right now. Brad Goh (“The Trading Geek”) sorts this in his video How I Identify Which Liquidity Price Will Target from 16 October 2026 into internal and external liquidity. I use this split as a way to sort the chart, not as proof.
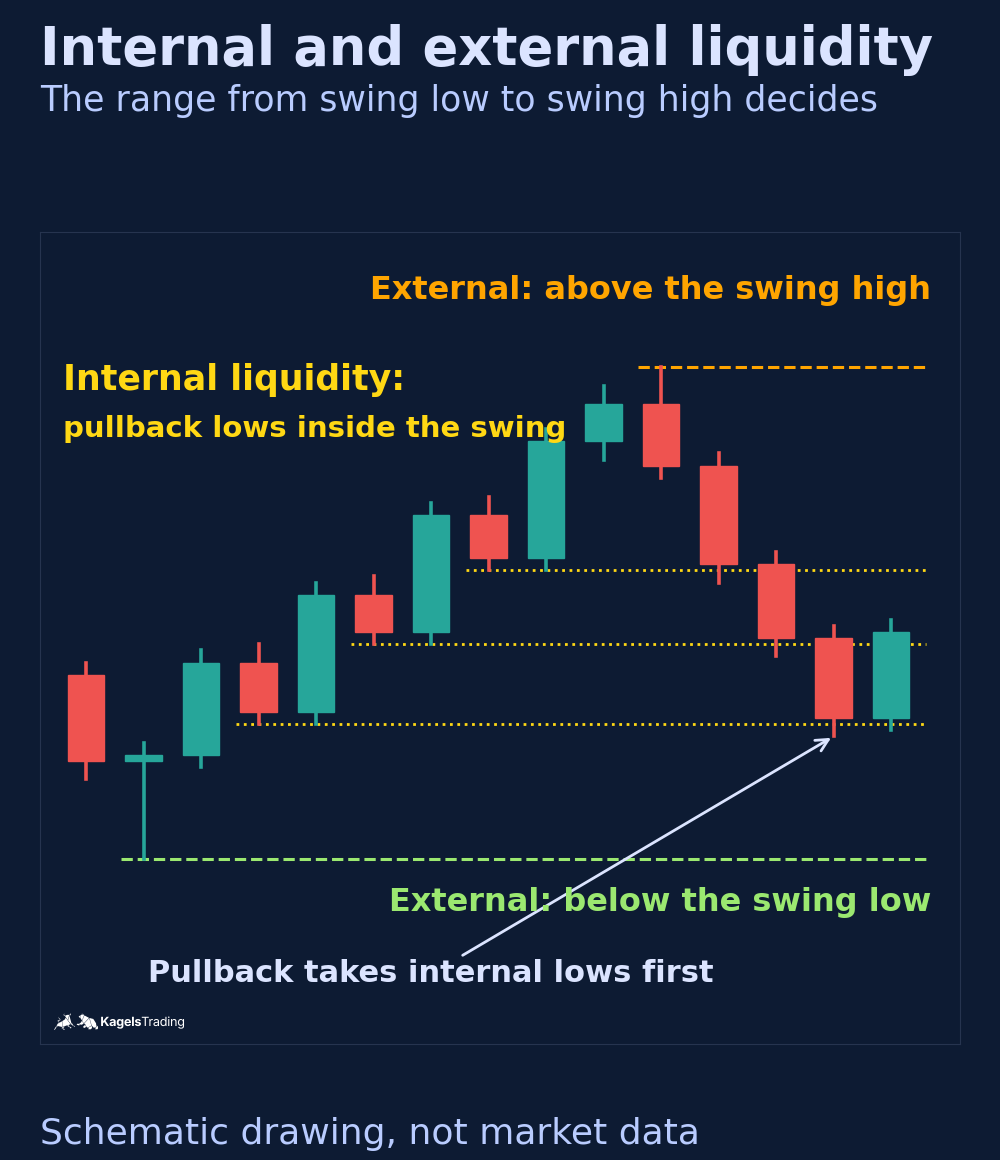
External liquidity means the levels beyond the extremes of the current swing: above the swing high and below the swing low of the higher timeframe, plus previous-day and session extremes.
Internal liquidity means the smaller highs and lows inside that swing, such as the pullback lows in an upswing.
Both are labels for candidates, not measured stop inventories. In practice the nearest level is not automatically the target. In a pullback within an uptrend, price may break the first internal low, then the next one, and only then the external low before it turns. It may also turn at the first one. There is no fixed order that predicts the next target.
 Click to enlarge
Source: Kagels Trading, own drawing.
Two points from the video I share without reservation. First, the higher timeframe gives direction and frame, the lower one only the entry. A break of an internal low in an uptrend is first a pullback, not a trend change. Second, if both sides of a range hold levels and price shows no direction, no trade is the right decision.
Where I am more careful than the video. Phrases like “smart money takes the liquidity before the real move” describe a model, not an observation. Whether there was “enough fuel” for a turn is only known afterwards. The video also promotes the author’s own platform and a paid course; we have not reviewed either.
How large traders use liquidity sweeps, according to SMC
In the SMC reading, banks, hedge funds and market makers trade very large positions. To fill them they need a counterparty. Triggered stop-loss and breakout orders provide one for a moment, all on the same side.
The SMC go further and say price prefers to move from thin to dense liquidity. That is a working assumption, not a law. The market has no fixed target, and not every high is revisited. The usual candidates are obvious technical levels: below swing lows, above obvious highs, around tight support and resistance ranges and at round numbers.
The typical sequence of a sweep
- Mark candidates: traders mark obvious highs and lows where they expect stop clusters. Nobody can see the stops there in full.
- Approach: price moves toward the level, slowly or as a fast spike.
- Trigger: when a trade reaches the trigger price, the stop orders turn into market or limit orders, joined by market orders from breakout traders. A short burst of orders on one side appears.
- Absorption: on the other side there is enough passive volume to take these orders. Whether that was the case can only be checked roughly with order book and volume data, not on a candle chart.
- Turn: if no new orders follow in the same direction, price often turns sharply. If they do follow, the break becomes a run.
How much a large order moves price depends on the market, the depth of the book and the time of day. In a liquid index future during the main session, a large order spreads more easily than in a thin market or at night. That is why large traders look for phases with a lot of two-way trading. Triggered stops are one such phase, but not the only one: the open, the closing auction and news also bring heavy volume.
A simplified example shows the mechanism. Trader A is long with a stop just below the last low. Trader B waits for a break of that low to go short. When price falls below the low, A is stopped out with a market sell order, and B sells as well. Both deliver the same side of the market. These sell orders give a large buyer the volume to fill a big buy order without pushing price up at once.
What you can see on a chart is the sequence, not the sender. Even the most detailed CME data feed, Market by Order, shows each order, but according to the CME it contains no customer identifiable information and no firm IDs. Whether a fund, a market maker or many small traders stood on the other side is not written in any chart. If you want to see where volume actually traded, look at order flow data. The order block concept builds on the same reading: there, the sweep is the first of three conditions.
How to spot a liquidity sweep: the checklist
The break bar’s close classifies the break; whether it becomes a tradable setup only shows in the reaction afterwards. The first feature decides between a sweep and a run. The other four are context and confirmation for the trade, not conditions for the label:
- Close back inside the range: the area beyond the level is rejected. The close counts; a long wick alone is not a sweep.
- Quick return: price does not stay above the high or below the low. The faster the return, the clearer the signal.
- No follow-through: after the break there are no further buyers or sellers. That can only be checked with volume data, not with the candle shape.
- Structure break the other way: after the sweep, price breaks an internal high or low in the opposite direction.
- A fresh zone: the reversal often leaves a gap or an order block that price can return to later.
If the return is missing, it was not a sweep. A break counts as a run when the break bar closes beyond the level; whether it continues only shows after a confirmation. Without one, the situation is open and you do not trade. And be careful when counting: a structure break, a gap and an order block often describe the same fast move, so three labels on the same candles are not three independent pieces of evidence.
Trading a liquidity sweep step by step
A liquidity sweep is not an entry signal on its own. It tells you that the market could not hold a level; whether many stops sat there remains a guess. I do not chase the move and wait until the market confirms the other direction. That is my preferred rule; our test does not show that it improves results.
- Mark the obvious highs and lows. Use higher timeframes such as H1, H4 or the daily chart for context, and decide whether a level is internal or external to the current swing.
- Wait for the break. Price trades beyond the level briefly but does not close there. Long wicks and a fast rejection are typical.
- Look for confirmation. A close beyond the break bar’s opposite extreme, or a structure break, turns the sweep into a possible trade.
- Wait for a pullback if it fits. A pullback into the confirmed zone often shrinks the distance to the stop. It does not always come: if price runs on without it, you miss the trade. That is the price of this rule.
- Place the stop beyond the sweep. Put it just beyond the high or low of the break bar. That gives you a defined planned risk. Gaps, fast markets and news can still fill the stop worse, so the realized loss can be larger. Size the position from the planned risk, see our guide to position sizing.
- Set the target in advance. Many traders want at least twice the risk. That alone is not an edge; it only counts together with the hit rate. Natural targets are the opposite liquidity or the last structure level.
Count the costs as well. Spread, slippage and fees apply to every trade and weigh most on small timeframes. These steps are my preferred rules, not a tested system. Test your own rules on past data or in a demo account before you trade them with real money.
How I use liquidity sweeps in my own trading
In my daily preparation I mark a fixed map of price levels. Previous day’s high and low, weekly high and low, round numbers and open gaps. That is where I expect most stops, and that is where I watch how the market arrives: does it push through, or is it rejected?
A break of one of these levels is never a reason to enter on its own. I wait for the market to confirm the other direction before I act, and I place the stop beyond the extreme of the break. Without confirmation the trade does not happen. I trade these situations most often in forex majors and minors, in stock indices and in commodities such as gold.
Reversal or continuation: real SPY examples
The same first break can go either way. The examples come from daily bars of the S&P 500 ETF SPY (data: Yahoo Finance, US dollars) and follow the rules of the test further down. A swing low is a low whose two bars on each side have higher lows. We picked these cases afterwards as clear rule examples; they are not my trades.
Example A: rejection and reversal (May 2026)
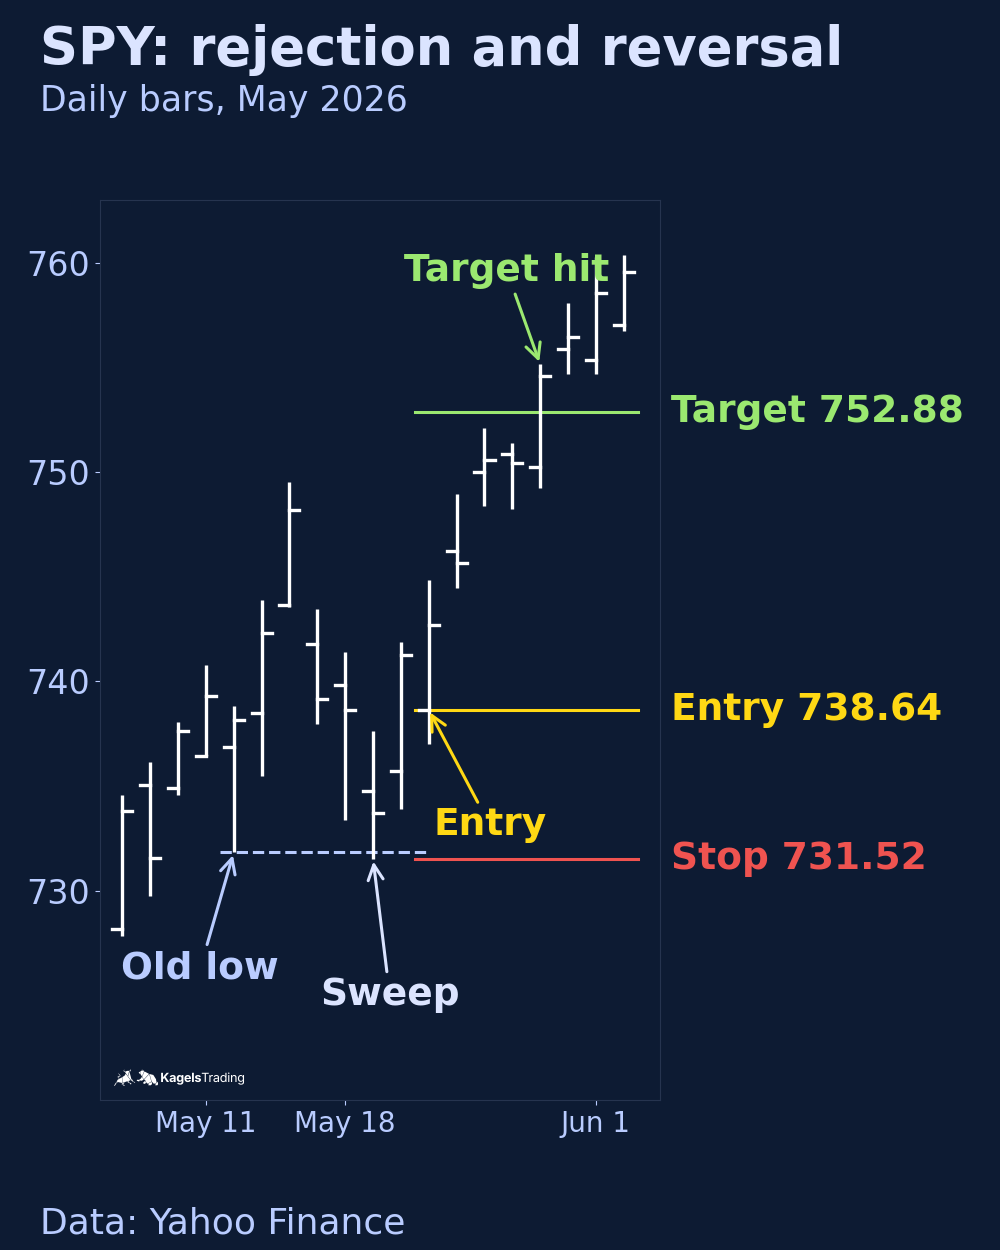
Rule: the break bar closes back above the low. Confirmation is a close above the break bar’s high within three bars. Entry at the next open, stop one cent below the break bar’s low, target at twice the risk. The reversal is invalid as soon as price trades below the break bar’s low, even before entry.
On May 19, 2026, SPY traded down to 731.53 dollars, just below the May 12 low of 731.83. It closed back above at 733.73. On May 20 it closed at 741.25, above the break bar’s high of 737.65. Entry on May 21 at 738.64, stop at 731.52, target at 752.88. The target was reached on May 28.
 Click to enlarge
Example B: acceptance and continuation (February 2025)
Rule: the break bar closes below the low. Confirmation is a close below the break bar’s low within three bars. Short entry at the next open, stop one cent above the break bar’s high, target at twice the risk. The continuation is invalid as soon as price trades above the break bar’s high, even before entry.
On February 24, 2025, SPY fell to 596.49 dollars, below the February 12 low of 598.51. It closed below at 597.21. On February 25 it closed at 594.24, below the break bar’s low. Short entry on February 26 at 595.93, stop at 603.04, target at 581.71. The target was reached on March 3, 2025, with a daily low of 579.90. A reversal order from Example A would never have triggered, because the break bar closed below the level.
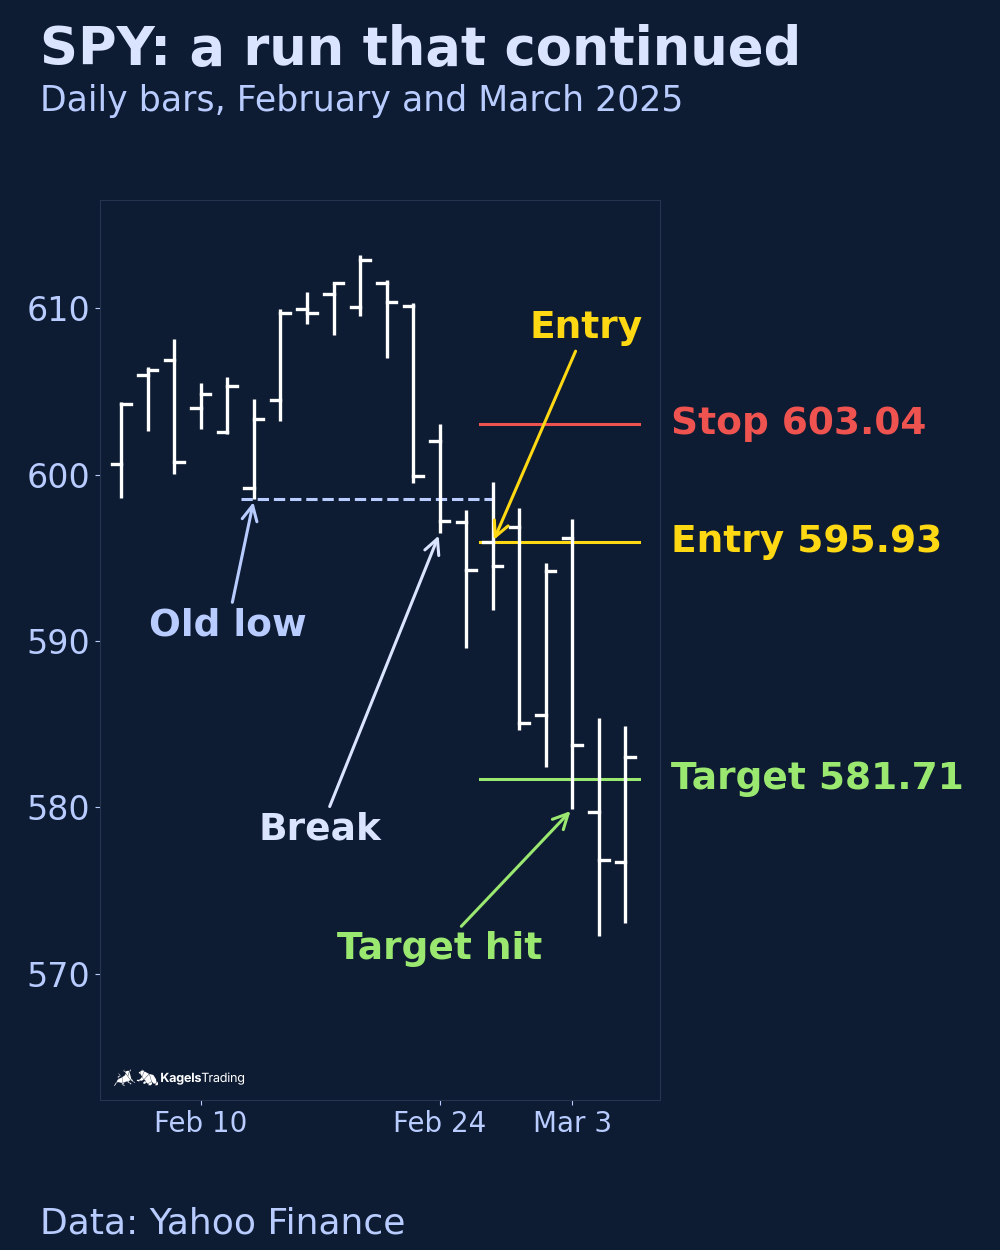 Click to enlarge
| Example A: reversal | Example B: continuation | |
|---|---|---|
| Broken low | 731.83 (May 12, 2026) | 598.51 (Feb 12, 2025) |
| Close of the break bar | 733.73, above the low | 597.21, below the low |
| Signal | close 741.25 on May 20 | close 594.24 on Feb 25 |
| Entry | 738.64 | 595.93 (short) |
| Stop | 731.52 | 603.04 |
| Target | 752.88 | 581.71 |
| Invalid at | below 731.53 | above 603.03 |
| Outcome | target on May 28, 2026 | target on Mar 3, 2025 |
When the reversal fails: July 2026
The same reversal rule failed in July 2026. On July 8 SPY traded down to 739.51, just below the July 2 low of 740.03, and closed above it. After the confirmation the entry on July 10 was 752.05, the stop 739.50. On July 23 SPY opened at 739.37, below the stop, and the loss was slightly larger than planned because of the gap.
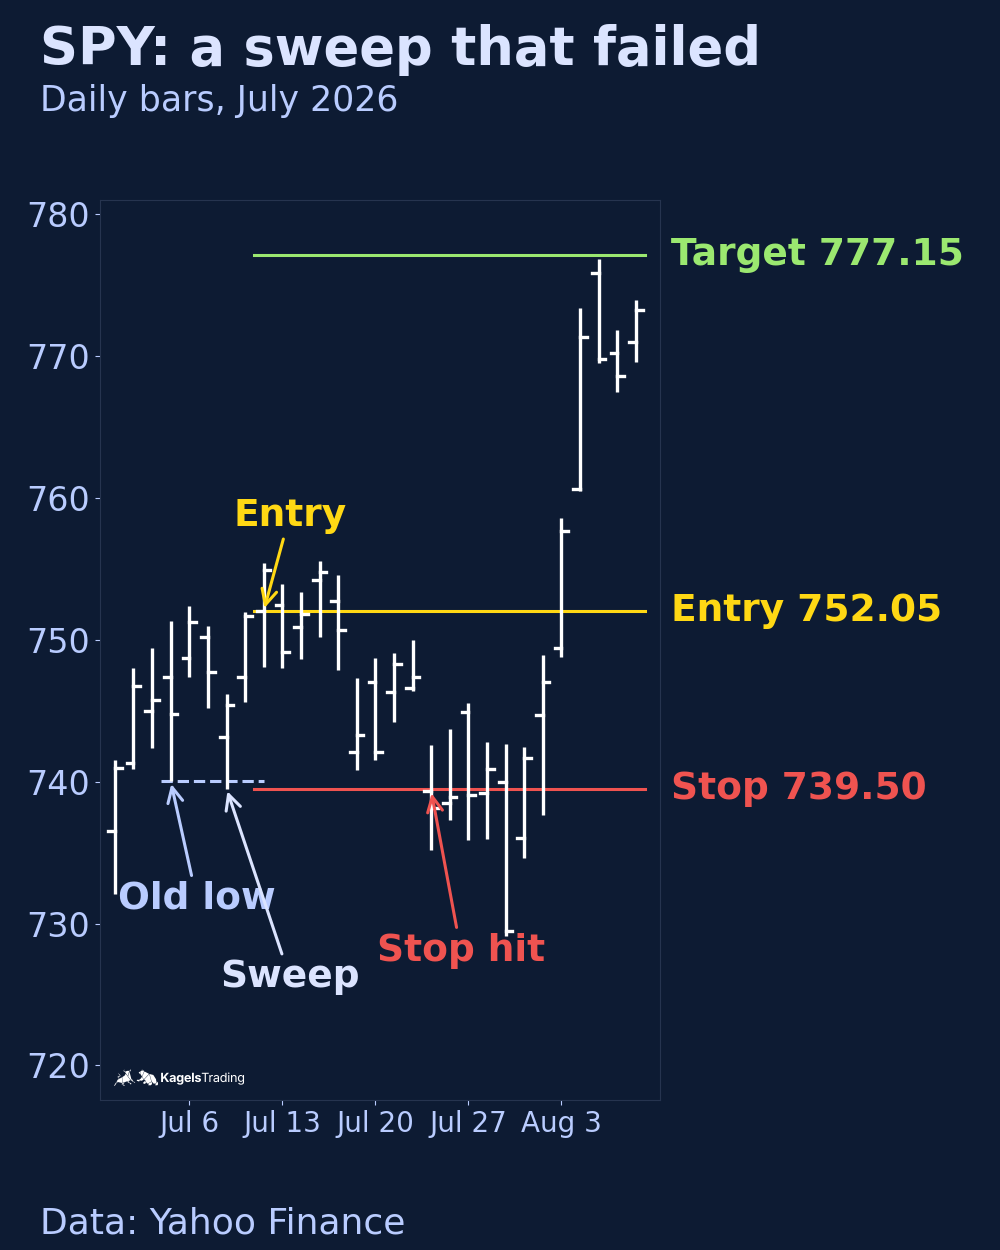 Click to enlarge
After that, both labels were wrong. On July 29 SPY closed at 729.46, below the July 23 low, which by the rule was a run. The continuation setup was invalid before entry, and within a week SPY was above 770. None of these examples proves an edge. They show what the rules look like and that the same first break can go either way.
What fixed rules did on SPY and gold
For this guide we tested historical daily data with fixed rules. The markets: the S&P 500 ETF SPY from January 2001 and the gold ETF GLD from its launch in November 2004, both to October 16, 2026 (Yahoo Finance, NYSE Arca, New York time, split-adjusted, without dividends). A swing high mirrors the swing low: a high whose two bars on each side have lower highs. Only the latest confirmed swing low or swing high of the last 60 bars is watched, and each level counts only at its first break.
The trade rules are the same in every case. Entry at the next open, stop one cent beyond the break bar, target at twice the risk (2R). If price touches the stop before entry, or opens beyond it on the entry day, there is no trade. A trade that hits neither stop nor target ends after 20 bars at the close. If price opens beyond the stop or the target, the open counts; if both are touched in the same bar, the stop counts. Fees and slippage are not included, trades can overlap in time, and only closed trades count; trades still open at the cut-off (one on SPY, two on gold) are left out.
| Break of a swing low | SPY: cases, avg. after 10 days | Gold: cases, avg. after 10 days |
|---|---|---|
| Sweep (close back above) | 153, +0.33% | 133, -0.01% |
| Run (close below) | 208, +0.71% | 213, +0.62% |
| All trading days | 6,476, +0.33% | 5,502, +0.45% |
After a sweep of a low, neither market rose more than on an ordinary day, and gold rose less. After a run, a close below the low, both rose more. A run down was not a reliable sign of continuation in either market. “All trading days” means every day with ten trading days after it; closes exactly at the level (one case each) are left out.
| Rule (2R target) | SPY: closed trades, avg. | Gold: closed trades, avg. |
|---|---|---|
| Long after a low sweep, no confirmation | 139, +0.04R | 109, -0.06R |
| Long after a low sweep, confirmed | 75, +0.23R | 57, -0.22R |
| Short after a run below a low, confirmed | 90, -0.20R | 85, -0.18R |
| Short after a high sweep, confirmed | 67, -0.26R | 56, -0.09R |
| Long after a run above a high, confirmed | 179, +0.07R | 148, +0.09R |
No stable edge for the sweep shows up. The long rule after a confirmed sweep of a low made +0.23R per trade on SPY and -0.22R on gold. In both markets the short after a run below a low was negative, and the long after a run above a high slightly positive. R is the planned risk per closed trade. The simple, unadjusted standard error is between 0.10R and 0.18R, about as large as the results themselves, so no row proves an edge.
What this test does not say. It covers two markets, one timeframe and one definition of swing, break and confirmation. It does not test a trend filter or a pullback entry. Futures intraday, the DAX or EUR/USD can look different. If you trade sweeps, write your exact rules down and test them, for example with our guide to backtesting. Testing many variants on the same data invites curve fitting, so decide the rules before you look at the results.
Liquidity sweeps on different timeframes
The same pattern shows up on every timeframe, but not with the same reliability. On a 5-minute chart, spread and fees weigh more than on a weekly chart, and our test only covers daily bars.
Day trading
Intraday, breaks of session levels often come around the opens. A classic: price breaks the Asian session high around the London open and then turns. The first minutes of the US session create such levels too. You find the times in our guide to trading sessions. On M1 to M15 charts these breaks are fast, and slippage matters most there.
Swing trading
For swing traders on daily and weekly charts, sweeps matter at key levels after strong trends. If an obvious weekly high is exceeded slightly and clearly rejected, it can start a medium-term reversal. If you wait for a structure break, you get a setup with a clear stop and target. More in our swing trading guide.
Position trading
Long-term traders see the same pattern at multi-year highs and lows. A brief break above an all-time high that is quickly rejected can mark the start of a larger correction. Such events are rare, so each one needs its own context, and a single wick on a monthly chart is not a signal.
The limits of the concept
The concept has clear limits. Whoever reads every spike as a smart money signal trades on impulse, not on a system. The four most common traps:
Not every break leads to a reversal
A common belief: once a high or low is broken, the market has to turn. In practice price often just keeps going, as a liquidity run. In our test more breaks of swing lows closed below the level than above it: 208 against 153 on SPY, 213 against 133 on gold.
Misreading without context
Sweeps only mean something in the right context. Without the larger timeframe, the market structure and the surrounding price action, a supposed sweep quickly becomes a trap. Beginners in particular treat every wick as an entry.
Trading against the trend stays risky
A sweep does not automatically mean a change of direction. Whoever stands against a strong trend needs especially clean confirmation. In our test, shorts after a confirmed sweep of a high also lost, -0.26R per trade on SPY; the test had no separate trend filter. Manage every trade with clear risk management.
Are liquidity sweeps even real?
The question comes up again and again, and it is fair. Nobody can look into the order books of the banks, and afterwards almost any move can be told as a “sweep”. That makes the concept hard to falsify. The mechanism is plausible all the same: for the currency market it is documented that stop-loss orders cluster at certain levels and can speed up moves there (Osler 2002). How many stops sit at a level in a single case, nobody can see from outside. Treat the sweep as a working hypothesis, not as proof of a plot against you.
Conclusion: a sweep shows where a level did not hold
Liquidity sweeps describe a plausible mechanism: stops at obvious levels can be triggered, and afterwards price sometimes turns. If you separate the three outcomes, rejection, acceptance and unclear, you read level breaks more clearly and avoid many false breakouts.
A sweep shows that a level did not hold, not who traded there. Our test on SPY and gold shows no stable edge for the sweep, with or without confirmation. I still work with context: the higher timeframe, internal and external levels, and a confirmation before entry. That this confirmation improves results is not shown by our test.
A liquidity sweep is not a guaranteed turning point, but a useful hint where the market could not hold a level. Whether that gives you a trading edge, you have to test with your own rules; more indicators do not replace tested rules and a deeper understanding of price and structure. This is market analysis for education, not investment advice.
Frequently asked questions about liquidity sweeps
What is a liquidity sweep in trading?
A liquidity sweep is a short break beyond an obvious high or low after which price closes back inside the range. Below lows traders expect sell-side liquidity, above highs buy-side liquidity. The break may have triggered stops there, but the chart does not show them, only the close back inside.
How do I know whether it is a real liquidity sweep?
The close decides: after the break it is back inside the range. A long wick alone is not enough. If the break bar closes beyond the level, it is a run. A structure break in the other direction afterwards is the confirmation I wait for before a trade, not part of the definition.
Is a liquidity sweep bullish or bearish?
It depends on the side. A sweep below an obvious low with a quick return points to rising prices, a sweep above a high with rejection to falling prices. Before a trade I wait for a confirmation such as a structure break; even then the expected move can fail.
What is the difference between a liquidity sweep and a liquidity grab?
Many traders use both terms for the same thing. Those who separate them mean by a grab a very fast break within a single wick candle, and by a sweep the broader move beyond the level with a return afterwards. That stops were triggered is an assumption in both cases.
What is the difference between internal and external liquidity?
External liquidity sits beyond the swing high and the swing low of the current range. Internal liquidity sits at the small highs and lows inside that swing. Price often breaks internal levels on its way, but there is no fixed order that predicts which level comes next.
Do I have to enter right after the sweep?
No. Waiting for confirmation is my preferred rule; this test does not establish that it improves results. Entering right after a sweep of a low made only +0.04R per trade on SPY and -0.06R on gold. With a confirmation it was +0.23R on SPY but -0.22R on gold, so test any rule before you trade it.
On which timeframe do liquidity sweeps work best?
The pattern looks the same on every timeframe, but it is not equally reliable. On small timeframes spread and fees weigh more. Our test only covers daily bars on two markets.
Are liquidity sweeps real or a myth?
The mechanism is plausible: large orders need counter-liquidity, and in currency markets stop orders are documented to cluster at certain levels. The myth is the idea that every move is aimed at retail traders. Use the concept as a working hypothesis and test your exact rules before you trade them.
This English edition is based on our German edition on kagels-trading.de and has been adapted for international readers.
More Chart Techniques guides
- Draw key levels
Support and Resistance: How to Draw and Use Key Levels
Where useful levels come from, how to draw zones with a stated rule and how to turn a level into a trade plan.
- Read price action
Price Action Trading: How to Read Charts Without Indicators
Market structure, key zones and three bar patterns, with a core setup and a real SPY example where the signal failed.
- Read candlestick charts
How to Read Candlestick Charts: Body, Wicks and Context
Open, high, low and close in one candle, body and wicks, two real Gold candles read step by step and how often patterns really occur.
- Know candlestick patterns
Candlestick Patterns: 10 to Know, Tested on Real Data
Ten patterns with rules and a cheat sheet, counted on DAX, S&P 500, EUR/USD and Gold since 2014: most are rare, none is a signal on its own.
- Trade breakouts
Breakout Trading Strategy: Entries and False Breakouts
How often breakouts fell back into the range in our count of 1,472, and how to plan entry, stop and position size.
- Draw and trade trendlines
Trendline Trading: How to Draw Trendlines and Trade Them
How to draw trendlines with a fixed rule, four strategies for bounces, breaks and retests, and a real SPY line break without a lasting reversal.
- Use Fibonacci levels
Fibonacci Retracement Levels: How to Draw and Trade Them
How to calculate and draw retracement levels, trade pullbacks with confluence and a stop at the structure, and what a ten-year test says about the levels.
- Set Fibonacci targets
Fibonacci Extension: Levels, How to Draw It and Calculator
Three-point extension targets from the end of a pullback, why they differ from levels beyond 100%, a free calculator and three SPY swings, one without a single target reached.
- Trade gaps
Gap Trading Strategy: How to Trade Gaps and When Gaps Fill
Opening and full gaps, the four classic gap types, how often SPY gaps filled in our count since 2001, and plans for gap fill and gap and go.
- Calculate pivot points
Pivot Points: Formulas, Types and How to Trade Them
Formulas for standard, Fibonacci, Woodie, Camarilla and DeMark pivots, a free calculator, which session counts and a real SPY day.
- Swing trade
Swing Trading: 4 Strategies, Risk and Real Examples
Four swing trading strategies on the daily chart, position size, gap risk and US rules, with two hypothetical SPY pullbacks: one hit its target, one was stopped out.
- Identify market stages
Stage Analysis: Stan Weinstein's Four Market Stages
Stan Weinstein's four stages on the weekly chart, a Stage 2 checklist and two TSMC breakouts: one ran for a year, one gapped through its stop.
- Read Wyckoff ranges
Wyckoff Method: Accumulation, Distribution and Springs
Accumulation and distribution with phases A to E, springs and upthrusts as optional tests, and two real TSMC ranges read with and without hindsight.
- Trade Darvas boxes
Darvas Box Strategy: Rules, Entries and Stop Losses
The box rules step by step, when the edges become known, where the stop goes, and a mechanical test on TSMC in 2024 with two honest results.
- Count Elliott waves
Elliott Wave Theory: Rules, Patterns and Fibonacci
The five-wave pattern, three hard rules, zigzags, flats and triangles, Fibonacci ratios and a real DAX count, from the first German translator of the standard work.
- Trade order blocks
Order Blocks: How to Spot, Draw and Trade the Zone
The three conditions behind a valid order block, entry and stop at the zone, two SPY cases from 2026 and a 25-year count where a fixed rule lost money.
- Trade fair value gaps
Fair Value Gap (FVG): How to Spot, Trade and Test It
The three-candle rule, bullish, bearish and inverse FVG, two SPY cases from 2026 and a 25-year count of how often gaps were revisited and traded.
- Interpret volume
Volume Analysis in Trading: How to Read Volume Honestly
What volume counts in stocks, futures, forex and crypto, how to read it against its own average, and our SPY test of high-volume days since 2001.