
How to Read Candlestick Charts: Body, Wicks and Context


Contents
- Candlestick charts in 30 seconds
- What is a candlestick chart?
- How a candlestick is built
- How to read a candlestick chart
- Example: two Gold candles read step by step
- Line chart or candlestick chart?
- Which time frame should you use?
- Setting up a candlestick chart
- The most common mistakes when reading candlestick charts
- The most common candlestick patterns
- How often candlestick patterns really occur
- Conclusion: what the chart can do and what it cannot
- Frequently asked questions about candlestick charts
- About the author
A line chart tells you where price closed, a candlestick chart also tells you where it opened and how far it reached. That difference sounds small, and it is the reason the candlestick chart is the default view on almost every trading platform. A line connects the closing prices and drops everything in between. A candle keeps the open, the high, the low and the close of each period, but not the order in which they were reached.
I have traded since 1980, and candlesticks have been part of my daily work for decades. Not because they look nice, but because each candle carries four prices at once and makes them readable at a glance. On this page I explain how a candle is built, how I read a candlestick chart step by step, where beginners go wrong and what our own count says about candlestick patterns. This article follows our editorial policy.
Candlestick charts in 30 seconds
- Four prices in one candle: every candle shows the open, high, low and close (OHLC) of one period.
- Body and wicks split the information: the body runs from open to close, the wicks mark the high and the low.
- Color is shorthand: green means the close is above the open, red means it is below. Nothing more.
- Context decides: a single candle is one data point. It gets weight only at support, resistance or after a clear move.
What is a candlestick chart?
A candlestick chart is a price chart that draws each period as one candle, built from the open, high, low and close of that period. The period can be a minute, an hour, a day or a week. In English the four prices are often shortened to OHLC: open, high, low and close.
The method comes from Japan. Japanese rice markets of the 18th century produced an early tradition of price analysis, and the rice merchant Munehisa Homma is traditionally associated with it, although historians doubt that he drew candle charts himself; the charts in today’s form developed later. Steve Nison made candlesticks popular in the West with his 1991 book Japanese Candlestick Charting Techniques. Since then they have become standard in practically every charting software.
The practical advantage is information density. A line chart keeps only the closing prices, so everything that happened inside a period disappears. A candlestick chart keeps the range of each period, so you see how far price stretched between the open and the close. What it cannot show is the path inside the period: whether the high came before the low, or how often price crossed the range. The Wikipedia article on candlestick charts gives a neutral overview of the history and the usual conventions.
How a candlestick is built
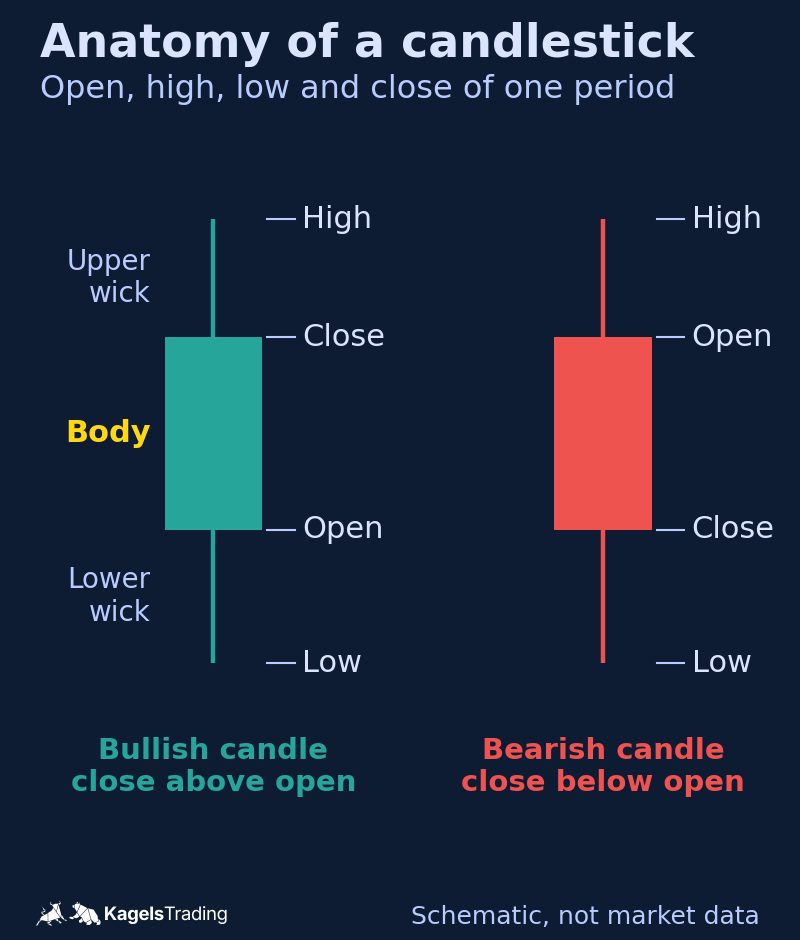
Every candle has two parts: the body in the middle and the thin lines above and below it. Both answer different questions, and that split is what makes the chart so useful. The graphic shows both parts on a bullish candle and a bearish candle.
 Click to enlarge
Source: Kagels Trading, own drawing.
The body
The body shows the distance between the open and the close. If the close is higher than the open, the body runs upward from the open; if it is lower, it runs downward. The length of the body tells you how clearly one side won the period. A long body stands for a clear direction, a short one for indecision.
The wicks
The thin lines are called wicks, or shadows, and they mark the high and the low of the period. A long upper wick means price traded up there and was sold back down. A long lower wick means the opposite: buyers stepped in below. For me these rejected prices are often the more important information, because they show where someone in the market had interest.
Wicks are also the fastest check against a false breakout. A level that only the wick crosses, while the close stays on the other side, has not really been broken. I explain how I trade such levels in the guide on breakout trading, and where the levels come from in the guide on support and resistance.
The color
The color is a convention and adds no information of its own. Green for rising candles and red for falling ones is the most common setting; older charts use white and black. The color only repeats what the body already shows, and every charting software lets you change it.
How to read a candlestick chart
Read from right to left. The most recent candle stands on the right, and it is your starting point. From there you work backward and check where the move came from. If you start on the left, you get lost in details that no longer matter for the current situation.
The second question is about location. Is the candle standing at a price level where the market has turned before? Then it can be a signal. Is it in the middle of a move with no reference point? Then it is usually noise. In my experience this is the most overlooked point in the whole topic.
The third question is about the time frame. The same candle means something completely different on a five-minute chart than on a weekly chart. The larger the time frame, the more trading stands behind each candle, and the more context it needs before you act on it.
When you look through a chart, watch three things. First the size of the bodies: large bodies mean one side dominated the period. Second the length of the wicks: long wicks show prices that were rejected. Third the sequence: several candles in the same direction tell a different story than constant back and forth.
Example: two Gold candles read step by step
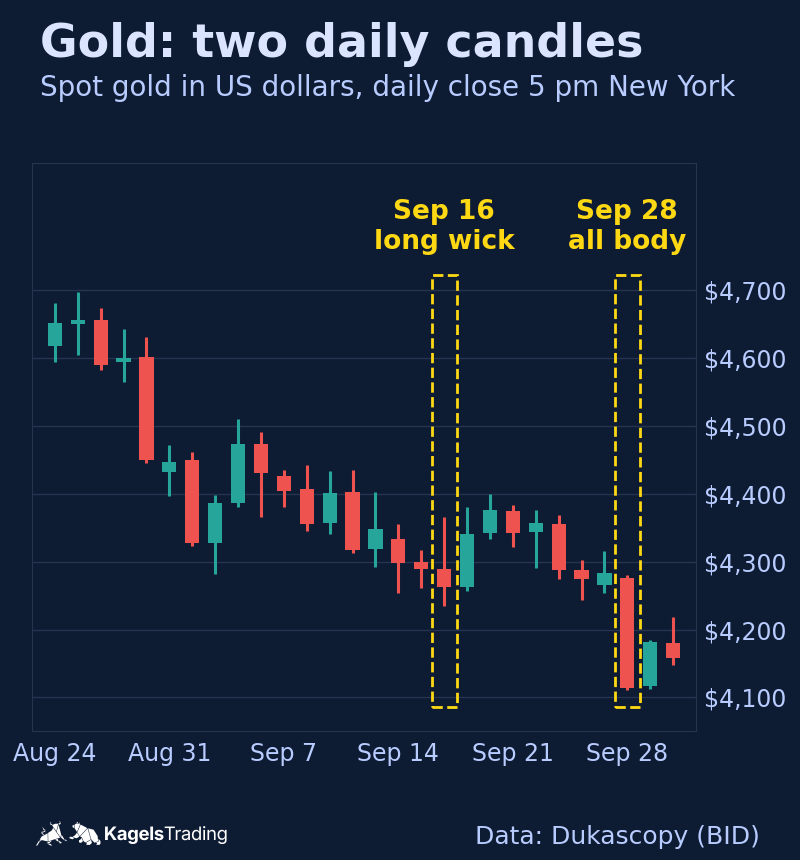
Real numbers teach faster than any drawing. The table shows two daily candles of spot gold from September 2026, in US dollars per ounce, with the trading day ending at 5 pm New York time. The chart below shows both candles in their surroundings.
| Value | September 16, 2026 | September 28, 2026 |
|---|---|---|
| Open | $4,289.62 | $4,275.88 |
| High | $4,366.52 | $4,280.18 |
| Low | $4,234.66 | $4,110.59 |
| Close | $4,262.94 | $4,114.03 |
| Body | $26.69, bearish | $161.84, bearish |
| Upper wick | $76.90 | $4.30 |
| Lower wick | $28.27 | $3.45 |
 Click to enlarge
The candle of September 28 is almost all body. From the open to the close Gold fell $161.84, and the whole range of the day was $169.59. The body therefore makes up about 95% of the range. The open was only $4.30 below the high and the close only $3.45 above the low. The day closed clearly in one direction; traders call such a candle a marubozu.
The candle of September 16 looks very different. Gold traded up to $4,366.52 during the day and closed at $4,262.94, below the open. The upper wick of $76.90 is almost three times as long as the body. Many traders read that as a rejected rally. The next day Gold still closed $78.12 higher. That is exactly why you never read a candle alone, but always together with its surroundings.
Line chart or candlestick chart?
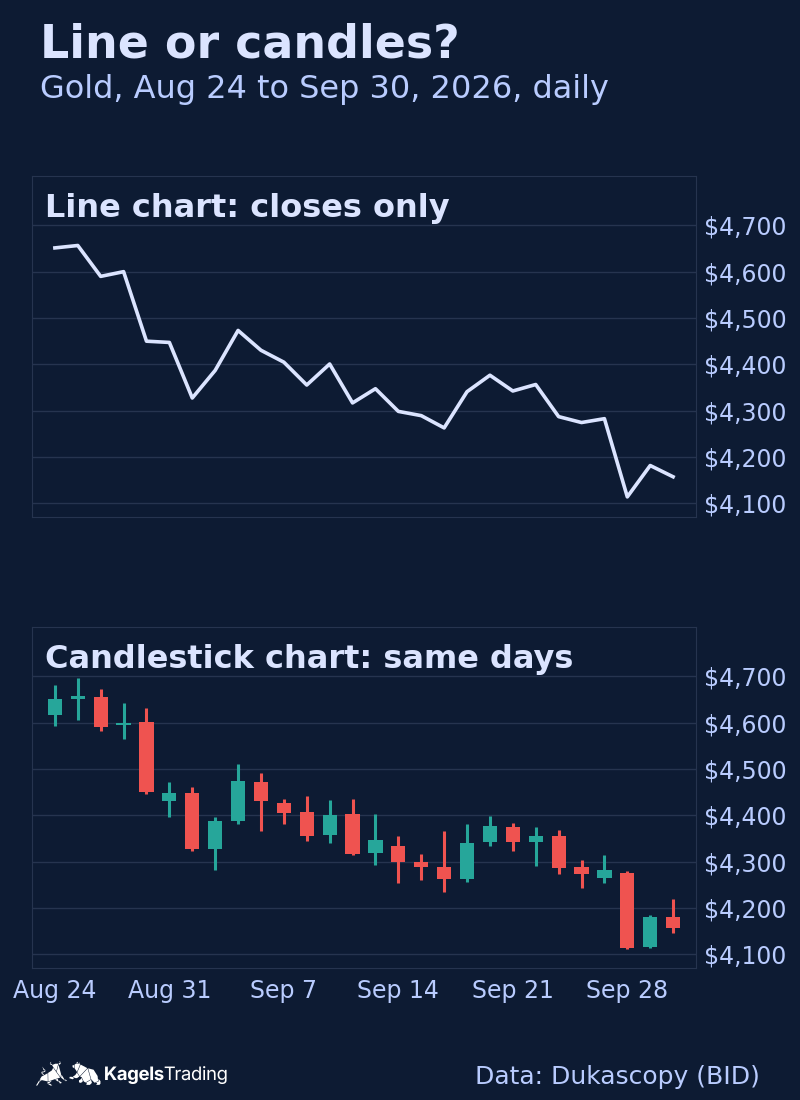
Both have their place, and the comparison is easiest on the same data. The upper panel shows the same Gold days as a line chart through the closes, the lower panel as candlesticks. The line looks calm and shows the general direction. The candles show the rejected rally of September 16 and the one-way day of September 28, which the line turns into ordinary points.
 Click to enlarge
| Candlestick chart | Line chart |
|---|---|
| Shows all four prices of a period | Shows only the close |
| Makes calm and hectic periods visible | Smooths the picture, easier to read at a glance |
| Needed for candlestick patterns | No patterns, only the overall path |
| Can tempt you to read a signal into every candle | Hides wicks that mark rejected prices |
| Takes some practice | Understood immediately |
There is a third family of charts that ignores time altogether. Charts such as point and figure only draw a new mark when price moves by a fixed amount, which filters out small swings. They can complement a candlestick chart for swing traders, but they do not replace it.
Which time frame should you use?
The time frame decides what a single candle represents. On a daily chart one candle sums up a whole trading day, on an hourly chart one hour. Both are correct; they answer different questions.
To learn, I recommend the daily chart. It has enough movement to show patterns and little enough noise that you do not mistake every random swing for a signal. If you trade shorter time frames, still look at the daily and weekly chart regularly so you do not lose sight of the bigger direction. For holding positions over several days, the guide on swing trading shows how I plan them on daily bars.
Setting up a candlestick chart
Practically every trading platform shows candlesticks by default. Where it does not, the way is almost always the same: open the chart settings, choose candles or candlesticks as the chart type and confirm. Then set the time frame.
Three further settings are worth a minute. First, show enough history that important price levels are visible at all. Second, use a logarithmic scale for long periods, because percentage moves otherwise look distorted. Third, keep enough space between candles that you can tell bodies and wicks apart.
You do not need expensive software for this. A free chart is enough to learn to read candles. Which platform I use every day, and what the paid plans add, is in my guide to TradingView.
The most common mistakes when reading candlestick charts
The first mistake is looking at a candle in isolation. A candle is read, interpreted and traded without anyone asking where it stands. In practice the location decides its meaning. The same hammer is a hint at a level that has held several times and a random shape in the middle of nowhere.
The second mistake is looking for confirmation. If you already have an opinion about the market, you will always find a candle that fits it. It helps to turn the question around: which candle would contradict my expectation? If you cannot name it, your expectation is not yet an analysis.
The third mistake is the wrong time frame. On a one-minute chart formations appear all the time that do not exist on the daily chart. If you hunt for patterns on very small time frames, you mostly trade noise. The shorter the period, the more random the shape.
The fourth mistake is treating a pattern as a signal. A formation describes what has happened. A pattern alone does not establish a tradable edge. Without a defined entry, a stop and a target, every pattern stays an interesting observation without consequences.
The most common candlestick patterns
Single candles and short sequences form recurring patterns. They are not automatic signals, but they hint at a shift in the balance between buyers and sellers. Four of them you will meet most often.
The hammer is a candle with a small body and a long lower wick at the end of a decline. It shows that lower prices were rejected during the period. Its mirror image after a rise is the hanging man: the same shape, a different place.
The doji has almost no body, because open and close are nearly equal. It stands for a stalemate between buyers and sellers. Its variants, from the dragonfly to the gravestone doji, are named after the wicks.
The engulfing pattern consists of two candles, and the second body covers the first body completely. A bullish engulfing after a decline and a bearish engulfing after a rise are among the best-known reversal patterns.
The harami is the counterpart: the second body sits inside the first. It shows a move that suddenly stalls. A close relative is the inside bar, where the whole range of the second candle stays inside the first.
All of these, with rules, examples and our own numbers, are in the guide to candlestick patterns. There you will find ten patterns, each with how it looks, what it means, how traders handle it and what the data showed after it. How I use such bars as timing at key zones is in the guide on price action trading.
How often candlestick patterns really occur
Textbooks give the impression that patterns appear all the time, so we counted. We used daily candles of the DAX and the S&P 500 (Yahoo Finance) and of EUR/USD and Gold (Dukascopy, day ending 5 pm New York) from January 2014 to September 2026, between 3,205 and 3,318 trading sessions per market. Every pattern got a fixed rule, and reversal patterns counted only after a matching move before them.
Only evaluable cases are counted. Days with a data gap nearby, the first weeks after a gap and signals without ten complete following sessions drop out. Count more loosely and you will find more cases. The table gives the range across the four markets; the last column is a rough average from sessions per market divided by cases.
| Pattern | Cases per market | Roughly once every |
|---|---|---|
| Inside bar | 344 to 494 | 7 to 9 trading days |
| Doji | 283 to 318 | 10 to 12 trading days |
| Bullish engulfing | 24 to 118 | 1 to 6 months |
| Hammer | 9 to 31 | 5 to 17 months |
| Morning star (without gap) | 4 to 9 | 1.4 to 3.2 years |
| Three white soldiers | 0 to 6 | not once in the DAX |
For doji and inside bar there are enough cases for a comparison. We measured how much price moved afterward: the range from the highest high to the lowest low of the next five sessions, divided by the ATR of the signal candle. The ATR (average true range) is the 14-period average true range with Wilder’s smoothing, including gaps from the prior close. We compared that with days of the same year, the same market state and similar volatility without the pattern.
The table shows the difference to that comparison group in ATR. A positive value means the following sessions moved more than usual. In brackets is the 95% interval from a block bootstrap, which describes the uncertainty of the estimate. The rules were set before the evaluation and developed on 2014 to 2021; 2022 to 2026 serves as the test period.
| Pattern, market | 2014 to 2021 | 2022 to 2026 |
|---|---|---|
| Doji, DAX | −0.01 (−0.18 to +0.16) | +0.03 (−0.14 to +0.21) |
| Doji, S&P 500 | −0.07 (−0.22 to +0.11) | −0.11 (−0.26 to +0.11) |
| Doji, EUR/USD | −0.06 (−0.18 to +0.10) | +0.03 (−0.13 to +0.25) |
| Doji, Gold | +0.14 (−0.04 to +0.30) | +0.28 (−0.05 to +0.50) |
| Inside bar, DAX | +0.12 (−0.07 to +0.21) | −0.13 (−0.26 to +0.06) |
| Inside bar, S&P 500 | +0.11 (−0.07 to +0.27) | +0.05 (−0.16 to +0.27) |
| Inside bar, EUR/USD | −0.03 (−0.16 to +0.08) | −0.01 (−0.15 to +0.14) |
| Inside bar, Gold | +0.09 (−0.04 to +0.18) | +0.04 (−0.14 to +0.19) |
In all 16 comparisons the interval contains zero. The average differences lie between −0.13 and +0.28 ATR. With this many comparisons across several patterns and markets, a few eye-catching numbers are expected by chance alone.
These numbers have clear limits. They apply only to daily candles of these four markets, without costs, and they measure movement, not trading success. The DAX and S&P 500 are indexes and cannot be traded directly; EUR/USD and Gold are bid prices. For Gold the opening price depends on the data source, so patterns close to a body threshold can come out differently with another provider. For Gold we also set the minimum coverage of a session to 18 hours after the case counts were known, so the Gold results are descriptive and not an untouched out-of-sample check. The basis is our measurement protocol, version 3.2.
My own practice adds a different observation. I never use a candle as a signal on its own. It gets weight for me only at support, at resistance or at the end of a clear move. That view comes from trading, not from the measurement above.
Conclusion: what the chart can do and what it cannot
A candlestick chart is a tool for showing price, not a trading strategy. It shows you cleanly and densely what has happened in the market. It does not tell you what happens next. That distinction is where most beginners go wrong.
Use it as a foundation, not as a signal generator. Once you understand how a candle is built and that a pattern only matters at a relevant price level, you have most of the benefit. The rest is practice on live charts, and for that you need screen time, not expensive software.
Frequently asked questions about candlestick charts
What does a candlestick chart show?
A candlestick chart shows the open, high, low and close of every period as one candle. The body spans the open and the close, the wicks reach to the high and the low. Each candle stands for one period of the chosen time frame.
How do you read a candlestick chart as a beginner?
Start with the most recent candle on the right and work backward. Then check whether that candle stands at an important price level, and note which time frame the chart shows. A candle in the middle of a move without a reference point is usually noise.
What do the colors of the candles mean?
Green or white means the close is above the open; red or black means it is below. The color only summarizes what the body already shows. In every charting software you can change the colors.
What is the difference between the body and the wick?
The body shows the range between the open and the close. The wicks mark the high and the low of the period and with them the prices the market rejected. A long upper wick means a rally was sold, a long lower wick means a decline was bought.
Which time frame is best for candlestick charts?
For learning, the daily chart is the best start. It shows enough movement to see patterns and little enough noise that you do not read a signal into every random swing. Shorter time frames produce more patterns, but each candle says less.
Is a candlestick chart better than a line chart?
It contains more information, because it shows all four prices of a period instead of only the close. In exchange it is busier and can tempt you to see a signal in every candle. For the general direction a line chart is often enough, for entries and stops the candles help more.
Do candlestick patterns work on their own?
Our count measured what followed the two most common patterns, not whether trading them works. Over four markets since 2014, we compared the movement after an inside bar or a doji with similar days without the pattern, and the 95% interval of the difference included zero in all 16 comparisons. That does not prove the patterns are useless, and we did not test any trading approach; it is the reason I look at a pattern’s location before anything else. More results are in the patterns guide.
This English edition is based on our German edition on kagels-trading.de and has been adapted for international readers.
More Chart Techniques guides
- Draw key levels
Support and Resistance: How to Draw and Use Key Levels
Where useful levels come from, how to draw zones with a stated rule and how to turn a level into a trade plan.
- Read price action
Price Action Trading: How to Read Charts Without Indicators
Market structure, key zones and three bar patterns, with a core setup and a real SPY example where the signal failed.
- Know candlestick patterns
Candlestick Patterns: 10 to Know, Tested on Real Data
Ten patterns with rules and a cheat sheet, counted on DAX, S&P 500, EUR/USD and Gold since 2014: most are rare, none is a signal on its own.
- Trade breakouts
Breakout Trading Strategy: Entries and False Breakouts
How often breakouts fell back into the range in our count of 1,472, and how to plan entry, stop and position size.
- Draw and trade trendlines
Trendline Trading: How to Draw Trendlines and Trade Them
How to draw trendlines with a fixed rule, four strategies for bounces, breaks and retests, and a real SPY line break without a lasting reversal.
- Use Fibonacci levels
Fibonacci Retracement Levels: How to Draw and Trade Them
How to calculate and draw retracement levels, trade pullbacks with confluence and a stop at the structure, and what a ten-year test says about the levels.
- Set Fibonacci targets
Fibonacci Extension: Levels, How to Draw It and Calculator
Three-point extension targets from the end of a pullback, why they differ from levels beyond 100%, a free calculator and three SPY swings, one without a single target reached.
- Trade gaps
Gap Trading Strategy: How to Trade Gaps and When Gaps Fill
Opening and full gaps, the four classic gap types, how often SPY gaps filled in our count since 2001, and plans for gap fill and gap and go.
- Calculate pivot points
Pivot Points: Formulas, Types and How to Trade Them
Formulas for standard, Fibonacci, Woodie, Camarilla and DeMark pivots, a free calculator, which session counts and a real SPY day.
- Swing trade
Swing Trading: 4 Strategies, Risk and Real Examples
Four swing trading strategies on the daily chart, position size, gap risk and US rules, with two hypothetical SPY pullbacks: one hit its target, one was stopped out.
- Identify market stages
Stage Analysis: Stan Weinstein's Four Market Stages
Stan Weinstein's four stages on the weekly chart, a Stage 2 checklist and two TSMC breakouts: one ran for a year, one gapped through its stop.
- Read Wyckoff ranges
Wyckoff Method: Accumulation, Distribution and Springs
Accumulation and distribution with phases A to E, springs and upthrusts as optional tests, and two real TSMC ranges read with and without hindsight.
- Trade Darvas boxes
Darvas Box Strategy: Rules, Entries and Stop Losses
The box rules step by step, when the edges become known, where the stop goes, and a mechanical test on TSMC in 2024 with two honest results.
- Count Elliott waves
Elliott Wave Theory: Rules, Patterns and Fibonacci
The five-wave pattern, three hard rules, zigzags, flats and triangles, Fibonacci ratios and a real DAX count, from the first German translator of the standard work.
- Trade order blocks
Order Blocks: How to Spot, Draw and Trade the Zone
The three conditions behind a valid order block, entry and stop at the zone, two SPY cases from 2026 and a 25-year count where a fixed rule lost money.
- Trade fair value gaps
Fair Value Gap (FVG): How to Spot, Trade and Test It
The three-candle rule, bullish, bearish and inverse FVG, two SPY cases from 2026 and a 25-year count of how often gaps were revisited and traded.
- Interpret volume
Volume Analysis in Trading: How to Read Volume Honestly
What volume counts in stocks, futures, forex and crypto, how to read it against its own average, and our SPY test of high-volume days since 2001.