
Volume Analysis in Trading: How to Read Volume Honestly


Contents
- Volume analysis in 30 seconds
- What is trading volume?
- Which volume does your chart show?
- How to read volume on a chart
- Dow theory and volume
- Volume indicators in brief
- What research says about volume
- Our measurement: what happens after a high-volume day?
- Where to go next: methods built on volume
- Limits of volume analysis
- My conclusion on volume analysis
- Frequently asked questions about volume analysis
- About the author
Volume is the one number on a chart that tells you how much was traded, not just at what price. It shows whether a move came with heavy trading activity or happened in a quiet market. But the volume bar under your chart does not always count the same thing: in some markets it is complete, in others it is only a small slice or not real volume at all.
This guide starts with that question: what does the volume on your chart actually count? Then it explains how to read volume against its own average, what Dow theory and common indicators such as OBV, relative volume and the volume profile add, and what research and our own SPY measurement since 2001 show. Methods that build on volume, such as Wyckoff, have their own guides; this page links to them. This article follows our editorial policy.
Volume analysis in 30 seconds
- What volume is: the number of shares or contracts traded in a period. Every trade has a buyer and a seller, so volume does not show who was more eager.
- Know your data: US stocks have a complete consolidated count, futures a count per exchange. Spot forex has no central volume, and crypto volume differs by exchange.
- Read it relatively: compare volume with its own average, not with another market.
- Three common readings: volume that confirms a move, a climax with extreme volume, and volume that dries up in a range.
- What our test shows: after very high volume days, SPY’s next-day range was about twice as wide since 2001: a historical link to volatility, not a direction signal.
What is trading volume?
Trading volume is the number of shares, contracts or units of an asset that change hands in a given period, for example one day or one 5-minute bar.
Each unit traded has a buyer and a seller, so volume always counts both sides of the same trades. The Nasdaq glossary points out that there is a seller for every buyer. That is why the common phrases “buying volume” and “selling volume” need care: on a day with high volume and a falling price, just as many shares were bought as sold. What the price shows is which side was more urgent, not which side traded more.
Volume is also not the number of traders. One large fund can create more volume than thousands of small accounts, and a few fast trading firms can trade the same shares many times a day. For futures, volume counts contracts traded; the related figure open interest counts contracts that are still open at the end of the day.
Which volume does your chart show?
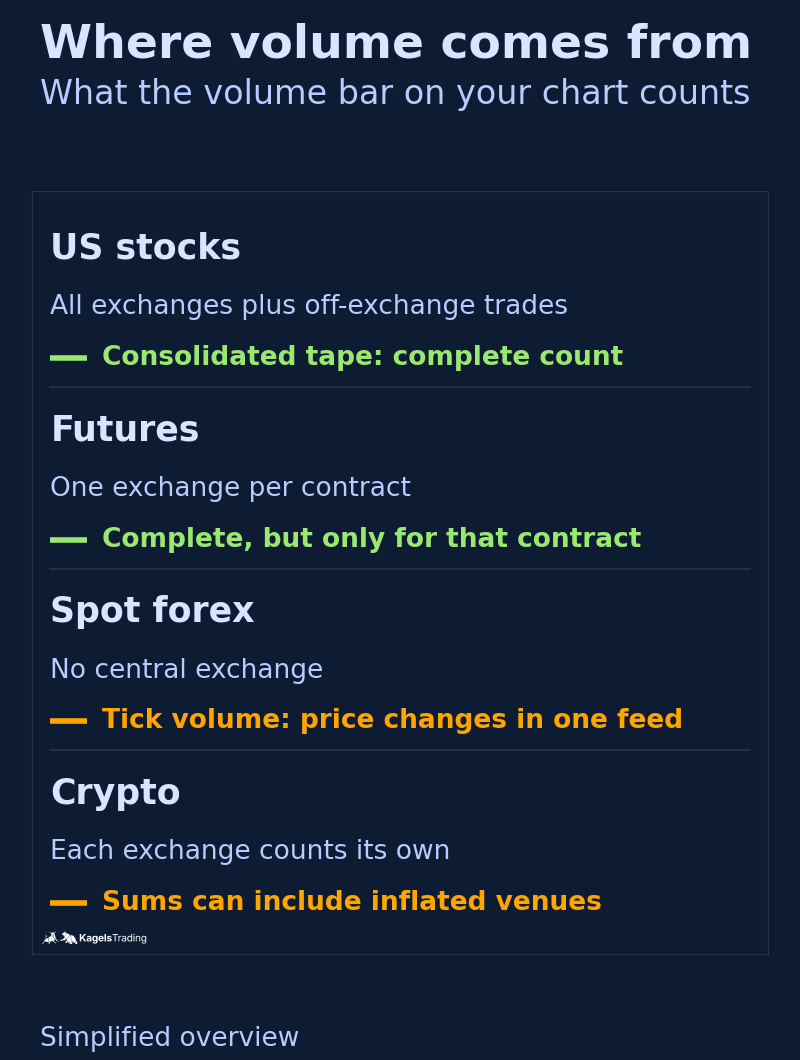
Before you read volume, check where the number comes from, because it differs by market. This is the question most guides skip, and it decides how much weight volume deserves on your chart.
 Click to enlarge
Source: Kagels Trading, own drawing.
US stocks: consolidated volume and off-exchange trading
For US stocks, the complete volume comes from the consolidated tape, which combines the trades of all exchanges and of trading away from the exchanges. Trades that do not happen on an exchange, for example in dark pools or with wholesale brokers, must be reported to a FINRA Trade Reporting Facility and flow into the same consolidated figure. That share is large: according to Rosenblatt Securities, about 50.6 % of US stock volume traded away from the exchanges in 2025, and dark pools alone accounted for about 17.7 %.
The practical consequence: a chart fed by one exchange shows only part of the volume. Daily volume on most charting sites is the consolidated figure. Some free real-time feeds show only the trades of one venue, so intraday volume can look much lower than it is. Stocks with several listings, such as an ADR, also show only the volume of that listing; our Wyckoff guide shows this with TSMC.
Futures: one contract, one exchange
Futures volume is complete for the contract you look at, because each futures contract trades on one exchange. The exchange reports the contracts traded across its own venues; CME, for example, publishes preliminary figures after the close and official ones the next day. But similar contracts on another exchange are separate markets, the E-mini and the Micro are separate contracts, and volume moves from one expiry to the next during the roll. A continuous chart that splices contracts can show jumps in volume that have nothing to do with interest in the market.
Spot forex: no central volume, only tick volume
The spot currency market has no central exchange and therefore no complete volume figure. The wider over-the-counter currency market, spot and derivatives such as swaps and forwards together, averaged $9.6 trillion per day in April 2025, according to the survey the Bank for International Settlements published on September 30, 2025. Spot trading is only part of that, and it is spread across banks and platforms. Retail platforms show tick volume instead: the number of price changes in their own feed. That is a proxy for activity, not a count of traded money. A 2007 Federal Reserve paper notes that the frequency of indicative Reuters quotes, an older proxy similar in spirit to tick volume, was only loosely related to actual interbank trading, especially over short intervals. That is not a test of today’s broker feeds, so the quality of any single tick-volume feed remains an open question. If you need real volume for a currency, currency futures give you exchange volume, but only for that futures market.
Crypto: every exchange counts its own
Crypto volume is the volume of one exchange, or the sum an aggregator builds from many exchanges, and those sums can be inflated. A study by Cong, Li, Tang and Yang in Management Science (2023), also available as an NBER paper, estimated that wash trading, trades with oneself to fake activity, made up more than 70 % of reported volume on the unregulated exchanges they examined. For volume work in crypto, use one large regulated venue or exchange-traded futures, and say which one.
How to read volume on a chart
Volume only means something in comparison with its own normal level. A million shares is a lot for a small stock and very little for SPY. Read every volume bar against an average of the same instrument, for example the mean of the last 50 sessions on a daily chart.
Relative volume puts that comparison into one number. It is the current volume divided by an average volume, so 1.0 is normal and 2.0 is twice normal. Intraday, compare with the average at the same time of day, because volume is usually high after the open and before the close and low around midday; TradingView’s built-in Relative Volume at Time works this way. Thresholds such as 1.5 or 2.0 are rules of thumb, not laws.
Most volume readings fall into three groups. None of them is a signal on its own; each is context for the price action and the key levels you already use.
- Confirmation: a breakout or a trend move on rising volume shows more trading activity behind the move. Traditionally this counts as stronger evidence than a breakout on low volume, but test that on your own market.
- Climax: extreme volume after a long move, often with a wide bar, can mark exhaustion of that move. It can also start a new phase of high volatility.
- Drying up: volume that falls during a sideways range or a pullback suggests that pressure is fading. What happens at the end of the range decides the reading.
 Click to enlarge
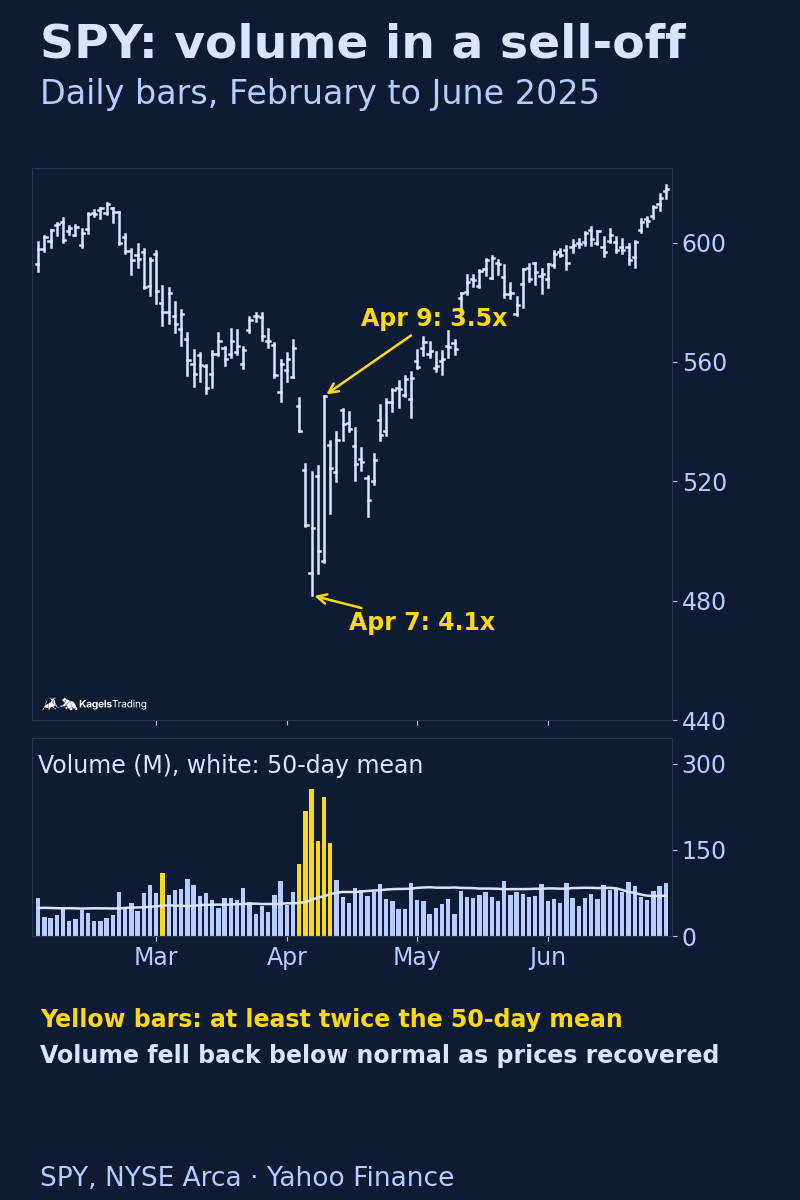
The spring of 2025 shows all three in one chart. After the US tariff announcements of April 2, 2025, SPY fell sharply. On April 7 it traded 257 million shares, 4.1 times its 50-day mean, a typical selling climax. Two days later, after a 90-day pause of most of the new tariffs was announced, SPY closed 10.5 % higher on 242 million shares, 3.5 times normal. As prices recovered in May and June, volume fell back below its mean: the rebound came with much less trading than the sell-off. With hindsight this is a textbook pattern; at the time, nobody could know from the volume alone that April 7 was the low.
Dow theory and volume
The idea that volume should confirm the trend goes back to Dow theory. As summarised by Robert Rhea in his 1932 book The Dow Theory, volume is expected to expand in the direction of the main trend: rising on advances in a bull market, rising on declines in a bear market. In Dow theory, volume supports the signal from the price averages; it does not replace it. That is still the most useful way to treat volume: as a second witness for what price already shows.
Volume indicators in brief
Volume indicators condense volume into a line or a profile, but they cannot add information that the data does not contain. If the volume input is a single venue or tick volume, every indicator built on it has the same limit. These four are the most common.
On-balance volume (OBV)
On-balance volume adds the day’s volume when the close is higher and subtracts it when the close is lower. Joseph Granville popularised it in his 1963 book Granville’s New Key to Stock Market Profits. Traders watch the direction of the OBV line and look for divergences, for example a price that makes a new high while OBV does not. Because a whole day’s volume counts as up or down depending only on the close, OBV is a rough measure.
Relative volume
Relative volume compares the current volume with an average of past volume, as explained above. It is the simplest volume tool and the one we used in our measurement below. Scanners often use it to find stocks with unusual activity, which is a starting point for a chart review, not a reason to trade.
Volume profile and Market Profile
A volume profile shows how much volume traded at each price level over a period, as a horizontal histogram next to the chart. The price with the most volume is called the point of control, and the value area is the range that holds a set share of the volume, by default 70 % in TradingView’s volume profile tools. Most charting tools build the profile from smaller bars, so it is an approximation of trading at each price. Its ancestor is the Market Profile, which J. Peter Steidlmayer developed at the Chicago Board of Trade in the early 1980s and which counts time spent at a price rather than volume.
VWAP
The volume-weighted average price shows the average price paid during a session, weighted by volume. It is a reference line for the trading day rather than a volume indicator in the narrow sense, and we explain it in our guide to the VWAP indicator together with its anchored version.
What research says about volume
Academic studies find that volume carries information, but over weeks and months and across many stocks, not as a simple entry signal. Two well-known studies point in different directions, which is a good reason for caution.
Gervais, Kaniel and Mingelgrin found a high-volume return premium. In their 2001 study in the Journal of Finance, stocks with unusually high volume over a day or a week tended to rise over the following month, and stocks with unusually low volume tended to fall. The authors explain this with visibility: a stock with a burst of trading attracts attention and new buyers.
Lee and Swaminathan found that high past turnover goes with lower future returns. In their 2000 study, also in the Journal of Finance, stocks with high trading activity over the past months behaved like popular glamour stocks and later earned lower returns, while past volume helped to predict how strong and how lasting price momentum was. Short bursts of volume and long periods of heavy trading are different things.
Our measurement: what happens after a high-volume day?
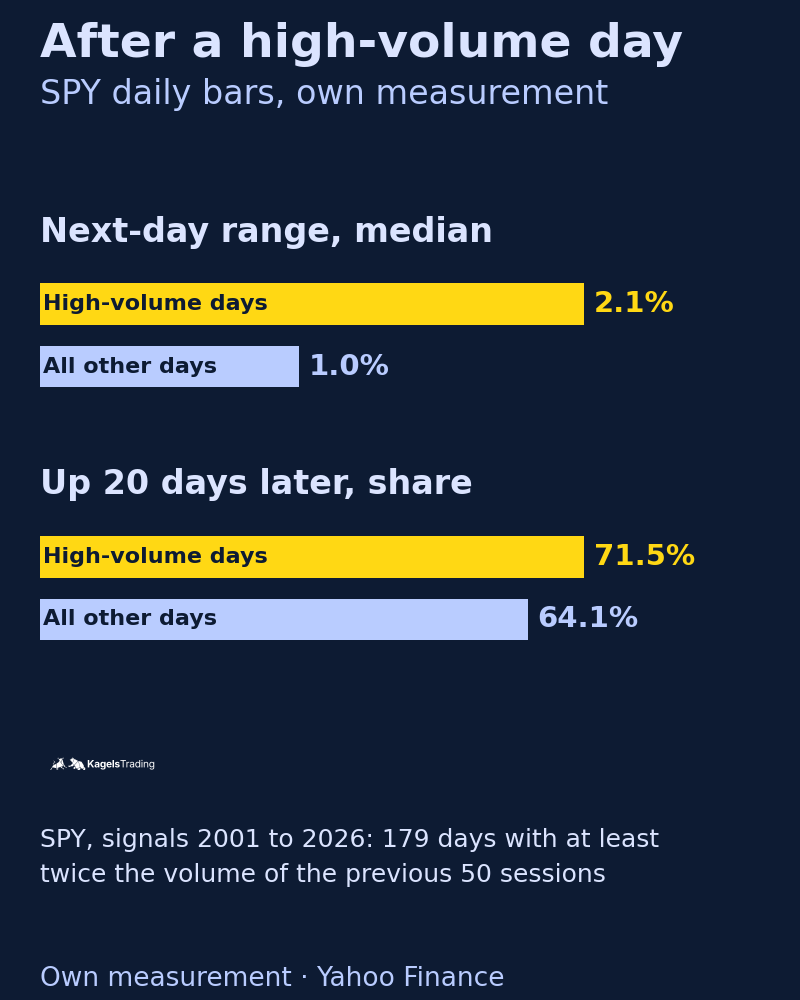
We tested on SPY what follows a day with at least twice the normal volume. We used daily bars from January 2, 2001 to October 9, 2026 with the consolidated volume from Yahoo Finance; the first 50 sessions only served to build the average, so signal days start on March 15, 2001. A day counted as a high-volume day if its volume was at least twice the mean of the 50 sessions before it. That happened on 179 days, 2.8 % of all days. Counting days less than 20 sessions apart as one episode, they form 60 episodes, but all results below use the 179 days. Seven of the 179 days fell on quarterly expiration Fridays, when volume is high for technical reasons.
 Click to enlarge
The clearest result is about volatility, not direction. After a high-volume day, the median range of the next session was 2.1 % of the price, against 1.0 % after all other days. Without the years 2008 and 2020 the gap was similar: 1.8 % against 1.0 %. High volume tends to come in turbulent phases, and turbulence tends to continue for a while, so this is a historical association rather than a forecast. We did not compare days with similar volatility before the signal.
The direction result looks positive but is weak evidence. Twenty sessions after a high-volume day, SPY was higher in 71.5 % of cases, against 64.1 % after other days. Without 2008 and 2020 the gap was even larger, 79.3 % against 64.7 %. But 138 of the 179 days were down days, the 20-day windows overlap, and the days cluster in turbulent periods. The result fits the idea that heavy selling often comes near the end of a sell-off, but it is not a trading signal: the next crisis could start with a high-volume day that is followed by much lower prices. All figures are price changes before costs and dividends.
Where to go next: methods built on volume
Several methods on this site use volume as one of their main inputs. Each of them goes deeper than this overview.
- Wyckoff method: reads accumulation and distribution ranges from price and volume, including climaxes and springs. See our guide to the Wyckoff method.
- Breakouts: how much breakout volume matters, and why we found too few cases to publish a volume filter, in our guide to breakout trading.
- Stage Analysis: uses volume on the weekly chart together with the 30-week average in Stage Analysis.
- Darvas box: compares breakout volume with the 50-day mean in two real examples of the Darvas box strategy.
For a reading list of free articles and books on volume, Galen Woods has put together a useful guide. His Learning Guide For Trading With Volume Analysis on Trading Setups Review collects sources on Dow theory, volume patterns, frameworks and indicators. Our German site publishes a translation of that guide.
Limits of volume analysis
Volume is useful context, but it has clear limits. It cannot tell you who bought or sold, only how much changed hands. In markets without a central count, the data may be a proxy, and indicators inherit that weakness. Very high volume can mark the end of a move or the start of a larger one, and the difference is often visible only later.
Treat volume as a second witness, never as the only one. Decide first what price and your key levels say, then ask whether volume supports or contradicts that reading. Test any volume rule on your own market before you rely on it, and remember that our SPY results describe one ETF over 25 years, not every stock.
My conclusion on volume analysis
I have traded discretionary price action since 1980, and volume has always been a supporting actor in my analysis, not the lead. The most important step is the one most traders skip: knowing what the volume on your screen actually counts. In US stocks and futures it is a solid number; in spot forex it is a proxy, and in crypto it can be distorted.
Used that way, volume earns its place. Traditionally, a breakout on strong volume earns more trust than one in a quiet market, a climax deserves attention, and a range in which volume dries up deserves patience; each of these readings is worth testing on your own market. Our measurement adds one historical observation: on SPY, extreme volume days were followed by wider daily ranges, which is a good reason to check your position size after such a day.
Frequently asked questions about volume analysis
What does volume mean in trading?
Volume is the number of shares, contracts or units traded in a period. High volume means many units changed hands, low volume means a quiet market. Because every trade has a buyer and a seller, volume shows activity, not which side won; the price shows that.
How do you read volume?
Compare each volume bar with the average volume of the same instrument, then ask whether it supports the price move. Rising volume on a breakout shows more trading activity, extreme volume after a long move can signal exhaustion, and falling volume in a range shows fading pressure. Volume is context, not a signal on its own.
Which volume indicator is best?
No volume indicator is best in general; the simplest one, volume compared with its average, is often the most useful. Relative volume puts that into one number, OBV turns it into a running line, and a volume profile shows where trading concentrated. All of them are only as good as the volume data behind them.
What is volume spread analysis?
Volume spread analysis (VSA) studies single bars by comparing their volume with their range, the spread, and their close. It grew out of the Wyckoff method and looks, for example, for high volume with little price progress. Our Wyckoff guide, linked above, explains the underlying idea of effort and result.
Can you use volume analysis in forex?
Only with care, because spot forex has no central volume figure. Retail platforms show tick volume, the number of price changes in their feed, which is a proxy for activity. For real exchange volume, look at currency futures, keeping in mind that they cover only that futures market.
More Chart Techniques guides
- Draw key levels
Support and Resistance: How to Draw and Use Key Levels
Where useful levels come from, how to draw zones with a stated rule and how to turn a level into a trade plan.
- Read price action
Price Action Trading: How to Read Charts Without Indicators
Market structure, key zones and three bar patterns, with a core setup and a real SPY example where the signal failed.
- Trade breakouts
Breakout Trading Strategy: Entries and False Breakouts
How often breakouts fell back into the range in our count of 1,472, and how to plan entry, stop and position size.
- Draw and trade trendlines
Trendline Trading: How to Draw Trendlines and Trade Them
How to draw trendlines with a fixed rule, four strategies for bounces, breaks and retests, and a real SPY line break without a lasting reversal.
- Use Fibonacci levels
Fibonacci Retracement Levels: How to Draw and Trade Them
How to calculate and draw retracement levels, trade pullbacks with confluence and a stop at the structure, and what a ten-year test says about the levels.
- Set Fibonacci targets
Fibonacci Extension: Levels, How to Draw It and Calculator
Three-point extension targets from the end of a pullback, why they differ from levels beyond 100%, a free calculator and three SPY swings, one without a single target reached.
- Trade gaps
Gap Trading Strategy: How to Trade Gaps and When Gaps Fill
Opening and full gaps, the four classic gap types, how often SPY gaps filled in our count since 2001, and plans for gap fill and gap and go.
- Calculate pivot points
Pivot Points: Formulas, Types and How to Trade Them
Formulas for standard, Fibonacci, Woodie, Camarilla and DeMark pivots, a free calculator, which session counts and a real SPY day.
- Swing trade
Swing Trading: 4 Strategies, Risk and Real Examples
Four swing trading strategies on the daily chart, position size, gap risk and US rules, with two hypothetical SPY pullbacks: one hit its target, one was stopped out.
- Identify market stages
Stage Analysis: Stan Weinstein's Four Market Stages
Stan Weinstein's four stages on the weekly chart, a Stage 2 checklist and two TSMC breakouts: one ran for a year, one gapped through its stop.
- Read Wyckoff ranges
Wyckoff Method: Accumulation, Distribution and Springs
Accumulation and distribution with phases A to E, springs and upthrusts as optional tests, and two real TSMC ranges read with and without hindsight.
- Trade Darvas boxes
Darvas Box Strategy: Rules, Entries and Stop Losses
The box rules step by step, when the edges become known, where the stop goes, and a mechanical test on TSMC in 2024 with two honest results.