
Price Action Trading: How to Read Charts Without Indicators


Contents
- Price action trading in 30 seconds
- What is price action trading?
- Why I trade without indicators
- Reading market structure: highs, lows and trends
- Support and resistance: the key zones
- Bar patterns: signals at the right place
- Three price action strategies with clear rules
- Bar by bar: how I read a chart
- A real SPY example: the signal fails, the structure turns
- Learning price action trading: a realistic plan
- Myths and common mistakes
- Pros and cons of price action trading
- Conclusion: a craft, not a trick
- Frequently asked questions about price action trading
- About the author
A chart without a single indicator looks to many traders like a car without a dashboard. I have worked with charts like that for decades, and for my trading they show what I need. Price-based indicators such as moving averages, RSI and MACD transform the price data that is already on the chart. I prefer to read the price movement directly.
This guide explains price action trading from the ground up. You will learn how to read market structure, where the important price zones are, which three bar patterns are enough to start and how I build a trade plan from them. It ends with a realistic learning plan and a real SPY chart in which a clear signal failed. This article follows our editorial policy.
Price action trading in 30 seconds
- Price action trading means making trading decisions from price movement alone: highs and lows, bar patterns and key price zones, without technical indicators.
- Market structure is the base: higher highs and higher lows form an uptrend, lower highs and lower lows a downtrend.
- Support and resistance zones give clear entry areas and logical places for a stop.
- Bar patterns such as the pin bar or the engulfing bar matter only at the right place: the zone gives the reason, the pattern gives the timing.
- Suitable for beginners, but not a shortcut: expect several months of practice before you risk real money.
What is price action trading?
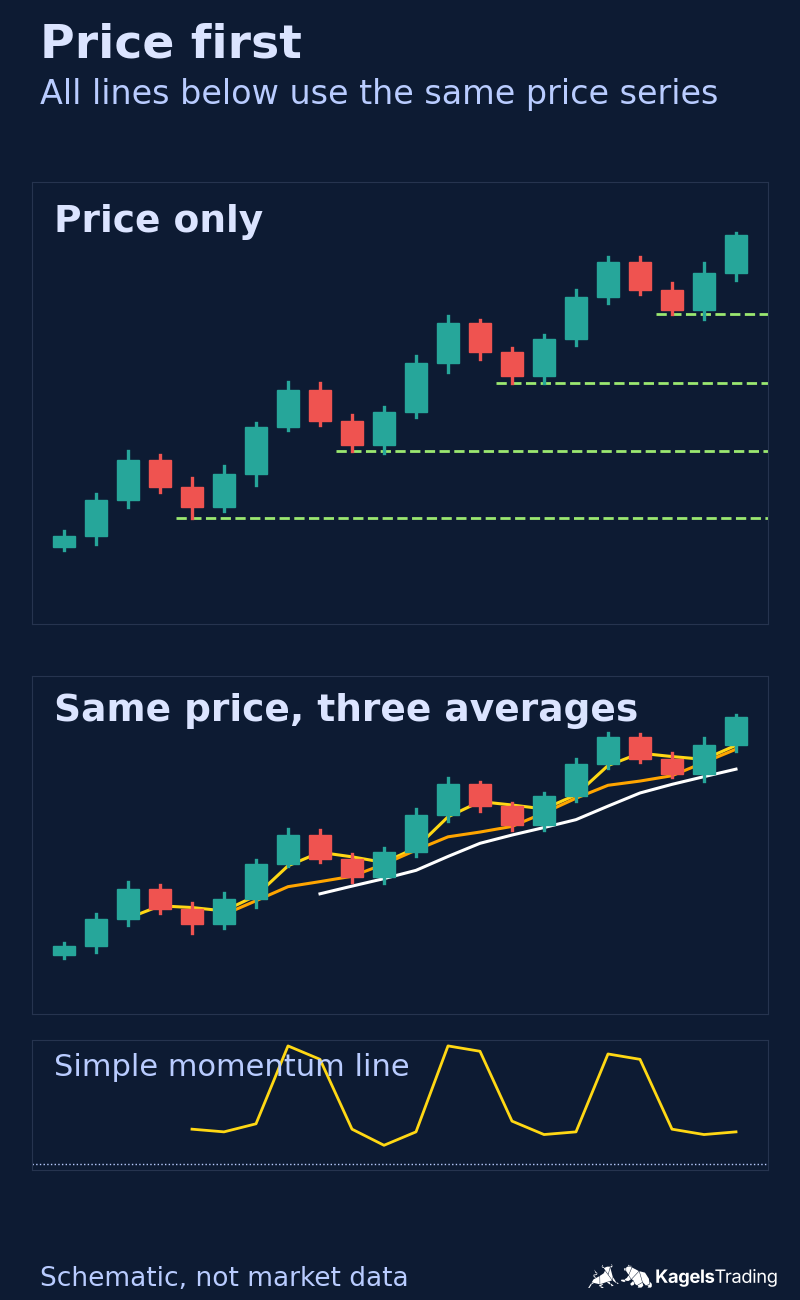
Price action trading is an approach in which buy and sell decisions come from price movement alone. The inputs are highs and lows, bar and candlestick patterns and important price zones, not technical indicators. Some traders also call it “naked” chart trading.
The idea behind it is simple: many popular indicators work with the same prices you see on the chart. A moving average, an RSI, a MACD: they process past prices, often smoothed and therefore with a delay. The price action trader skips that step and reads the original. Volume indicators and some other tools use additional inputs, and many traders use indicators sensibly to organize their decisions.
 Click to enlarge
Source: Kagels Trading, own drawing.
The approach is older than any chart indicator. In his newspaper editorials around 1900, Charles Dow described how trends are built from highs and lows; others later summarized his ideas as the Dow Theory. Jesse Livermore started as a teenager in the early 1890s, posting prices at a Boston brokerage, and later read speed and volume from the ticker tape. He did not use charts in today’s sense; in his 1940 book he described recording prices by hand in columns. Candlestick charting is traditionally associated with the 18th-century rice trading of Munehisa Homma in Japan, and Steve Nison popularized it in the West with his 1991 book.
Price action is a toolbox, not a finished strategy. It gives you a way to read the market. What you make of it depends on your rules, your risk management and your discipline. That is why this guide goes beyond definitions.
Why I trade without indicators
I started in the markets in 1980, with charts drawn on paper. If you update prices by hand, you develop a feel for how supply and demand show up in the bars: where the market gets sticky, where it speeds up, where it stops. That feel was the start of my way to price action.
There were detours, and I will not hide them. In the late 1980s I translated Robert Prechter’s standard works on the Elliott Wave theory into German and used the wave method intensively for years. I no longer trade it: the wave counts are too often ambiguous, and ambiguity is poison for fast decisions. Later I represented Joe Ross in Germany for more than 17 years and translated and published his books. The idea that shapes my style to this day comes from him: the chart shows you what you need to know.
Today my charts are completely empty. No indicators, no oscillators, only price and the market structure with its important zones. I trade forex, stock indexes, commodities and interest rate markets this way. Not because indicators are forbidden, but because the price-based ones give me no information that I do not already see in the bars.
An honest addition belongs here: trading without indicators is no proof of quality. There are profitable traders with indicators and losing traders with naked charts. The difference is in rules, risk control and experience, not in the tool. Price action is my way because it is direct. Whether it becomes yours, only your own screen time will tell.
Reading market structure: highs, lows and trends
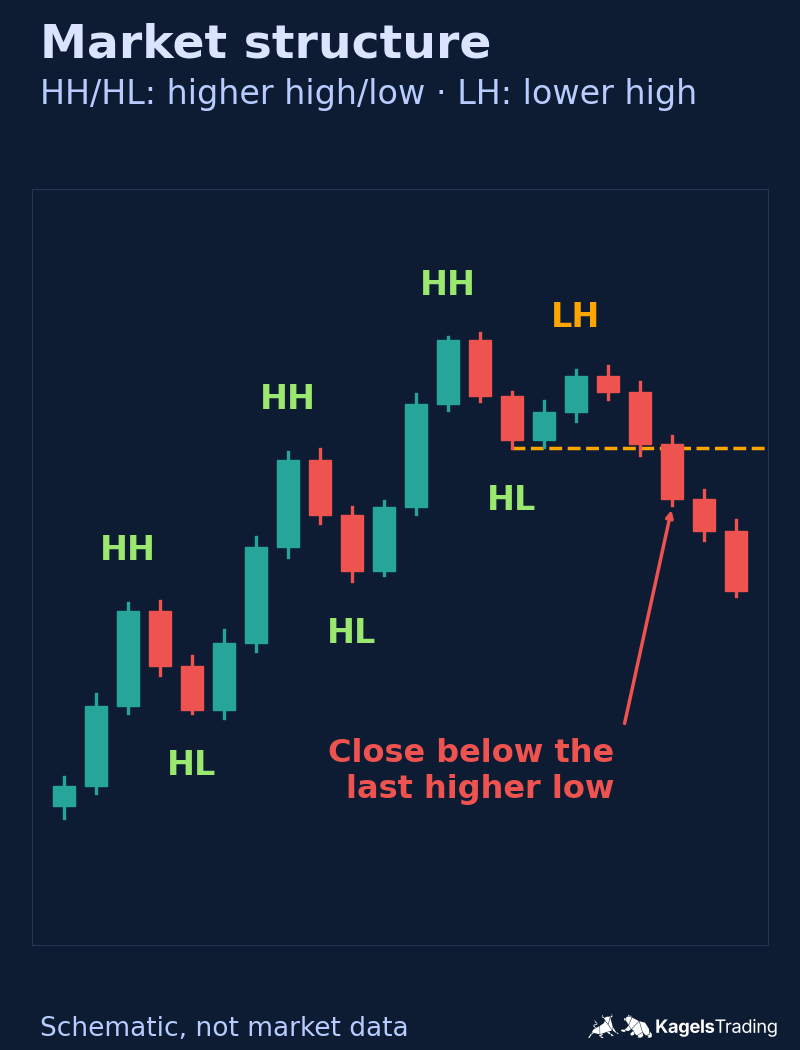
Market structure is the sequence of highs and lows a market moves in. Higher highs and higher lows form an uptrend, lower highs and lower lows a downtrend. When neither holds, the market moves sideways in a range.
This sounds trivial, but it is half of price action trading. Before I look at any pattern, I answer one question: is the market making higher highs and higher lows, lower highs and lower lows, or is it swinging in a range? That answer decides in which direction I look for trades at all. If you connect the higher lows, you get an uptrend line; our guide to trendline trading shows how to draw and trade it.
 Click to enlarge
Source: Kagels Trading, own drawing.
It gets interesting at the transitions. A trend does not end with an opinion, but with a structure break: the market makes no new high and then closes below the last higher low. Such breaks, often called a market structure shift today, are among the earliest objective hints of a trend change. Objective, because you can measure them on the chart instead of feeling them.
I always read structure from the larger time frame down. First the daily or weekly chart for the big picture, then the smaller time frame for the entry. An uptrend on the hourly chart can be a simple pullback on the daily chart. If you look at only one time frame, you can easily trade against the larger trend without noticing it.
Support and resistance: the key zones
Support is a price zone where falling prices have met buyers and turned more than once. Resistance is a price zone where rising prices have met sellers. These zones are the heart of my own trading, and our guide to support and resistance explains in detail where useful levels come from and how to draw them.
Many market participants bought or sold in these zones before. Open positions, orders and simply memory sit in the market there. That is why it pays to watch for a reaction at these zones, and that reaction is what I trade.
Two craft rules make the difference. First: think in zones, not lines. The market rarely turns to the cent, but within a price area. Second: watch for role reversal. A broken support often acts as resistance, a broken resistance as support. The retest of a broken zone from the other side is one of the patterns I trust most.
The market often pokes briefly below obvious lows before it turns. Many traders place their stop orders just below such levels, and a short push there can trigger them. This kind of move looks like a breakout, but it is often the opposite. That is why my stop never sits exactly on the low, but below it, with room for the usual volatility of the market.
Bar patterns: signals at the right place
Bar and candlestick patterns are what most people think of as price action. My view after decades at the screen: patterns are triggers, not reasons. In my experience, a perfect pattern in the middle of nowhere is worth little. The same pattern at a tested zone and in the direction of the trend is a trade candidate.
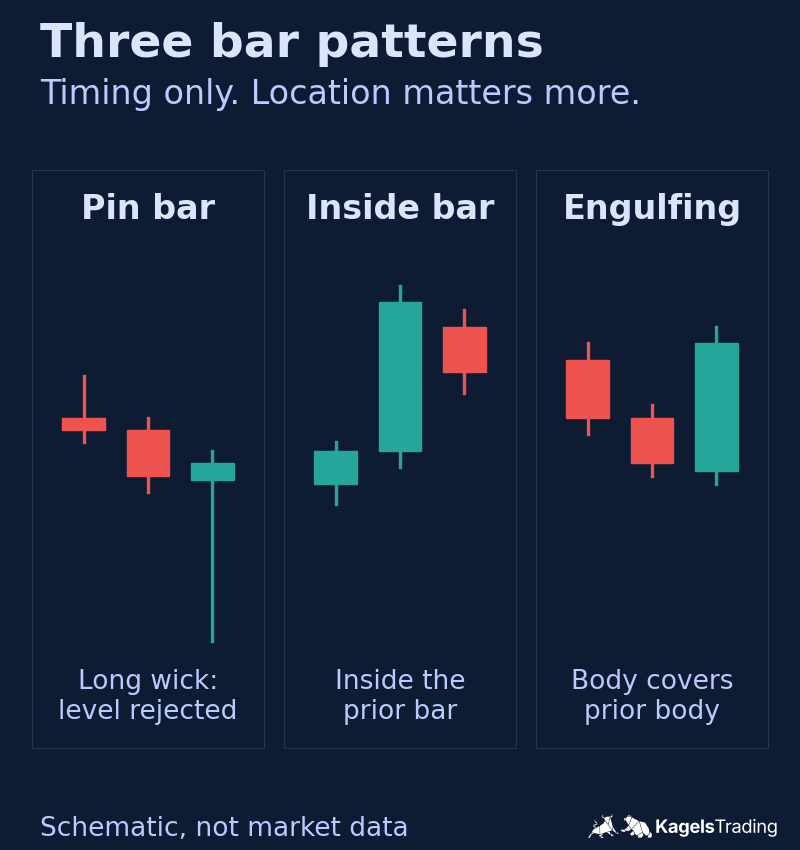
Three patterns are enough to start:
- Pin bar: a bar with a long wick and a small body. The wick shows that the market tested a price level and clearly rejected it. At support, with the wick pointing down, it is a possible buy signal.
- Inside bar: a bar whose high and low lie within the previous bar’s range. The market pauses. In this guide I wait for a completed bar that closes beyond the inside bar in the direction of the trend, then apply the same next-open check as in the strategies below. The stop can sit beyond the other end of the inside bar.
- Engulfing pattern: a candle whose real body covers the real body of the previous candle of the opposite color. A bullish engulfing follows a bearish candle, a bearish engulfing a bullish one. At a key zone it can mark a turn; in the middle of a move it means little.
 Click to enlarge
Source: Kagels Trading, own drawing.
A pattern name alone does not tell you its win rate. Results depend on its exact definition, the market, the sample and your exit rules. Test any pattern in your own market before you trade it with money.
Three price action strategies with clear rules
A strategy only counts as one if you can write it down and repeat it. These three setups cover the most common market situations and need no indicators. I keep the rules simple so they are easier to follow. In all three, the signal is a closed bar. After it closes, I define the invalidation level and the planned stop. At the next session’s open I check whether the setup is still valid before I submit an order; the actual fill can differ from the opening print. If price has already crossed my invalidation level, I skip the trade.
Strategy 1: reversal at support or resistance
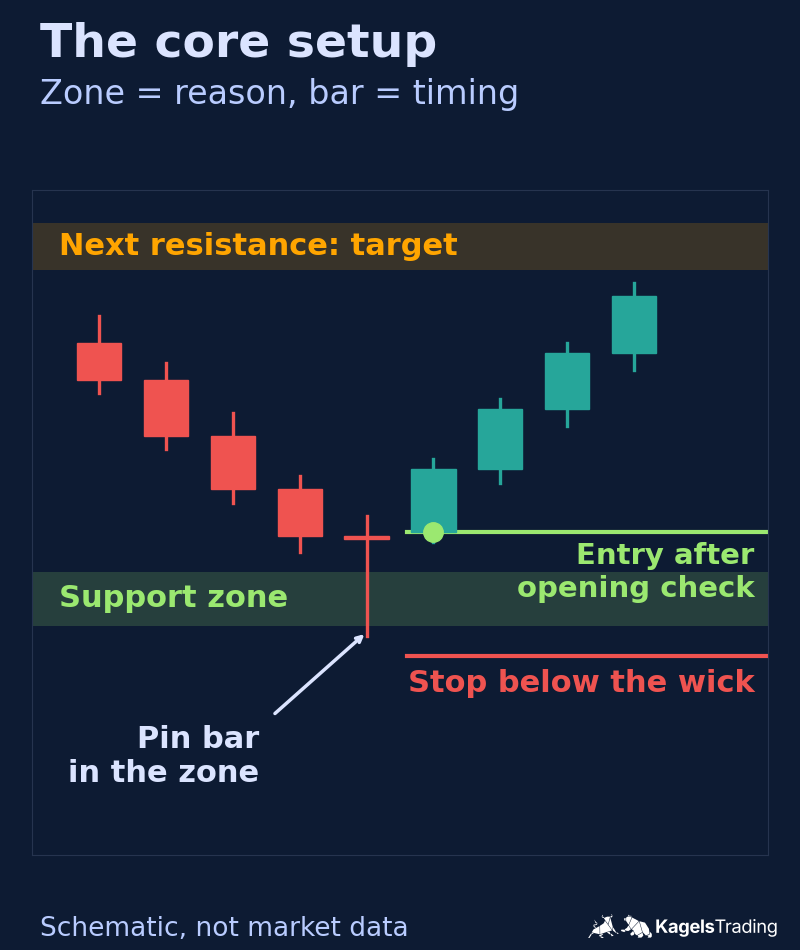
This has been my core setup for decades. I mark the zones on the daily and hourly chart where the market has turned several times recently, and then I wait. When price comes back to such a zone, I want to see a rejection: a pin bar, an engulfing bar, clearly fading selling pressure. Only then do I enter.
- Entry: a rejection signal at the zone, in the direction of the larger structure.
- Stop: beyond the extreme of the signal bar or beyond the zone, not inside it. That is where the setup is objectively proven wrong.
- Target: the next significant zone on the other side. Before I enter, I check whether the distance to that zone is worth the risk; if not, I skip the trade.
 Click to enlarge
Source: Kagels Trading, own drawing.
Strategy 2: pullback in a trend
In a trend, do not chase price; buy the pullback. I wait until a market with clear higher highs and higher lows comes back to its last breakout level or its last higher low, and I enter there on a rejection signal. The possible advantage: if the entry is near the pullback low and the target stays the same, the stop is closer, so the possible gain can be larger in relation to the risk than when buying at the high. Our guide to swing trading turns this idea into exact rules on the daily chart, with two SPY examples.
Strategy 3: breakout with retest
Breakouts are tempting and treacherous at the same time. In our historical sample of 1,472 breakouts across three stock indexes, about two thirds closed back inside the range within ten trading days. That is a return-to-range measure, not a trading loss rate or proof that retest entries perform better; the sample and its limits are explained in our guide to breakout trading. My own preference is not to buy the breakout itself, but the retest: price breaks above resistance, comes back to the broken zone, and only when it holds as support do I enter. I miss some of the fastest breakouts that way. In return, the stop has a logical place below the reclaimed zone.
Planning the loss before the entry
Every setup needs a planned loss in money before the order goes in. The formula is: planned loss = shares × stop distance × point value. For stocks the point value is 1. With 100 shares and a stop $2.00 away, the planned loss is 100 × $2.00 × 1 = $200. A gap or a fast market can make the real loss larger, so keep each planned loss to a small, fixed share of your account.
Bar by bar: how I read a chart
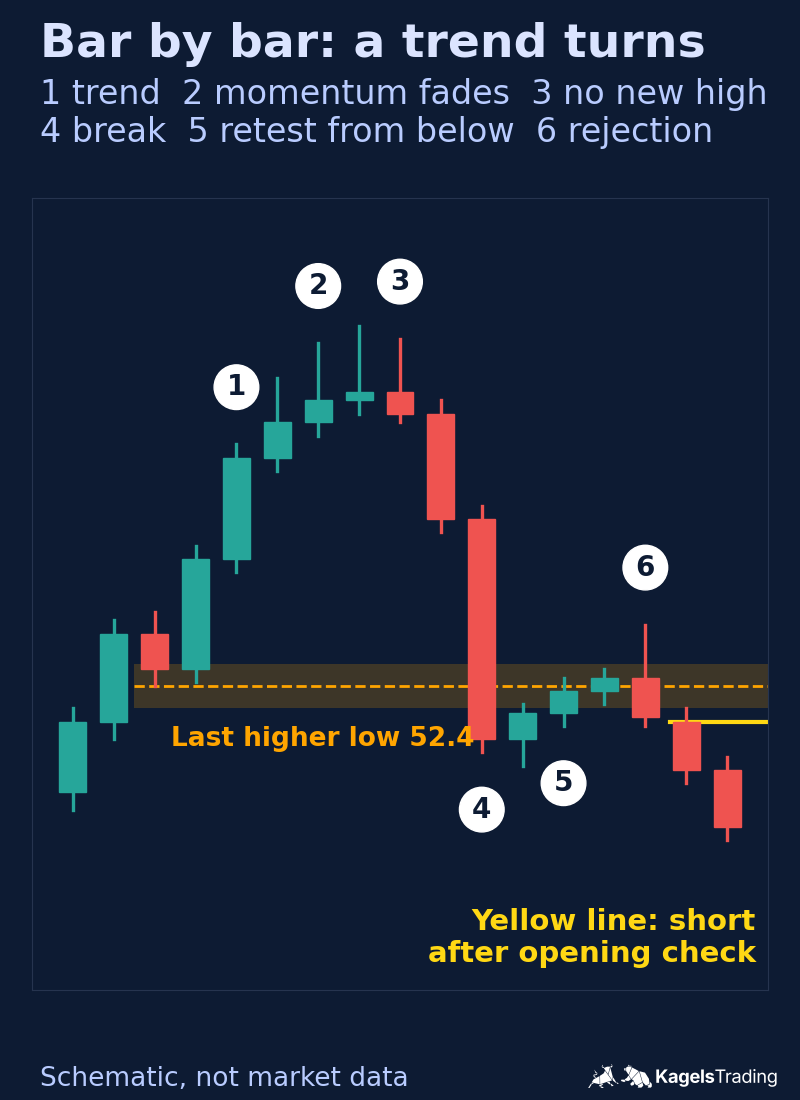
The difference between theory and skill shows when you read a chart bar by bar. Here are the six stations of the drawing below, the way I would comment on them at the screen.
- The trend runs: higher highs, higher lows, large bodies in the direction of the move, small counter bars. As long as that holds, there is no reason to think against the market.
- Momentum fades: the up bars get smaller, the upper wicks longer. Buyers are still pushing, but they move price less. This is not a sell signal, but a reason to pay attention.
- No new high: the market fails to make a higher high. From now on the structure is vulnerable.
- Structure break: price closes below the zone around the last higher low, with a large down bar rather than hesitation. The sellers have taken control for now.
- The retest from below: the market recovers into the broken zone in small, tired bars, and the closes stay below its top. This is where a short setup under strategy 1 can form.
- The rejection: a bar trades above the zone and closes back below the broken low and the zone. At the next open I check the setup and enter short, with the stop above the wick and the target at the next significant low.
 Click to enlarge
Source: Kagels Trading, own drawing.
That is how unspectacular price action is in practice: observe, classify, wait, act. A price-based indicator would have been calculated from exactly these bars, so I prefer to read the price itself. And the story does not always end the way the drawing suggests, as the next example shows.
A real SPY example: the signal fails, the structure turns
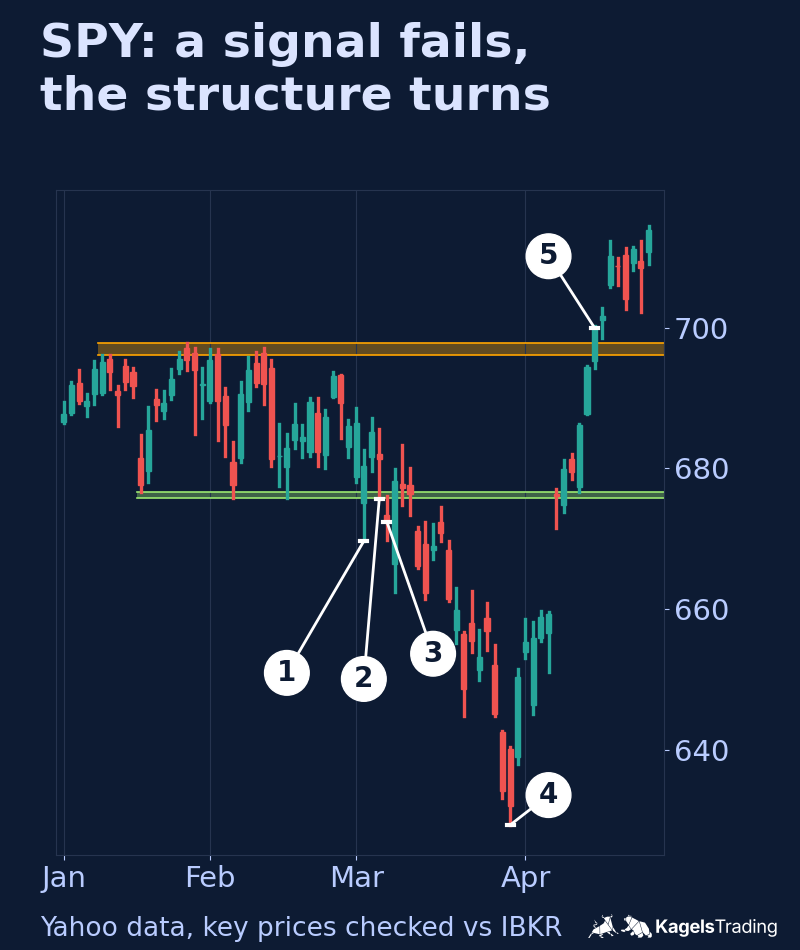
A clear signal at a clear zone can still fail. From mid January to early March 2026, SPY moved in a range. Support formed from the lows of January 20, February 5 and February 17, between 675.78 and 676.57. Resistance formed from the highs of January 12 and 13, January 28 and February 11, between 696.09 and 697.84.
 Click to enlarge
On March 3, SPY dipped to 669.66, below the support zone, and closed back above support, inside the broader range, at 680.33. On March 5 it formed a small-body bar with a long lower wick at the zone: low 675.61, close 681.31. It is not a perfect pin bar, because its upper wick is also long, but it is the kind of rejection bar I would watch. By the rules of strategy 1, the invalidation level is the March 5 low. On March 6, SPY opened at 673.41, below that low, so the opening check rejects the trade. That is not a claim that a market-on-open order could have been canceled after its fill was known. The day closed at 672.38, below the zone.
After that, the structure turned down. Lower highs and lower lows followed until a low of 629.28 on March 30. Then the market reversed. On April 15, SPY closed at 699.94, above the old resistance zone, which was a break of the down structure in the other direction.
What does the example teach? First: a pattern at a zone is a probability, not a promise. Second: define the invalidation level before the next session and check the open against it; a gap can make any planned loss larger. Third: this example shows why I assess the surrounding market structure as well as the signal bar. It does not measure which method is more reliable. I chose it because it shows a failure. It is one selected case, not a statistic.
Learning price action trading: a realistic plan
Here comes the part that sales pages like to skip: you do not learn price action in a weekend. You learn to recognize behavior, and that takes repetition. Think in months, not days. In return, what you build is not tied to a product or an indicator, but belongs to you.
My plan for getting started:
- One market, one time frame: choose a liquid market and stay with it, for example a major index or a major forex pair. Each market has its own character, and you want to know one well, not five halfway.
- Mark the structure every day: highs, lows, trend direction and the two or three most important zones. Twenty minutes a day beats a weekend marathon, because repetition trains the eye.
- Observe setups first, then simulate: write down every setup you see, with entry, stop and target, without money. TradingView’s Bar Replay and paper trading help here. Move to small real positions only after a documented evaluation that includes costs, losses and enough examples to judge your rules. There is no fixed time to profitability.
- Keep a journal: a screenshot before the trade, a screenshot after, one sentence on the reason. Without a trading journal you repeat mistakes; with a journal you see them.
- Risk first: risk only a small, fixed share of your account per trade and place the stop where your setup is proven wrong. No chart reading replaces risk management, mine included.
Myths and common mistakes
Price action is surrounded by a surprising number of half-truths. Here are the five most stubborn myths, as short as possible, each with a short answer:
- “Price action no longer works.” As long as markets consist of supply and demand, both leave traces in price. What does not work is trading patterns blindly and hoping for luck.
- “A good pattern is enough.” A pattern name alone does not tell you its win rate. For me, a pattern without context is noise; zone plus structure plus pattern make a setup.
- “Price action is only for day traders.” The same reading applies to weekly charts and minute charts. I use it on all time frames, from the long-term picture to the entry.
- “Without indicators you lack information.” Price-based indicators compress the price information on the chart and drop details on the way. The naked chart keeps the price bars unobscured, just uncomfortably raw. Volume or market breadth are separate data you can add if your method uses them.
- “A naked chart means gut feeling.” The goal is the opposite. Because no indicator takes responsibility, you need written rules. Whoever stares at bars without rules trades moods.
The most common real mistake is none of these myths, but impatience. Trading when there is no setup, just because the screen is on. The ability to do nothing is a discipline of its own in price action trading, and it protects your account more than any pattern.
Pros and cons of price action trading
Like every approach, price action trading has two sides. Here is my honest balance after more than 45 years:
| Pros | Cons |
|---|---|
| Straight from the source: you read price itself instead of a delayed derivative | Long learning curve: the eye for structure and zones takes months of screen time |
| Applicable to many markets: one approach for many liquid markets and time frames; each version needs its own testing | Room for interpretation: two traders do not always see the same thing; without written rules it gets arbitrary |
| Logical stop places: stops sit at the market structure, not at an arbitrary indicator line | Hard to automate fully: the approach lives on judgment |
| No tool race: no paid indicators or signal packages, just a clean chart | A test of patience: good setups are rare; whoever needs action every day overtrades |
Conclusion: a craft, not a trick
After more than 45 years in the markets, price action is not one style among many for me, but the base of everything. In my experience, whoever can read market structure, zones and the behavior at those zones also understands price-based indicators better, because they know what those indicators are calculated from.
Just as clearly: a naked chart does not make you profitable automatically. Price action gives you the ability to read. It becomes working trading only with rules, consistent risk management and a journal that keeps you honest. That is less glamorous than any indicator promise, but it is the part that lasts.
My advice to finish: start smaller than your ambition wants. One market, one time frame, twenty minutes of structure work a day. In a few months you will read charts that look like noise to you today. That is how I learned it, only with paper instead of a screen.
Frequently asked questions about price action trading
What does price action mean in trading?
Price action is the movement of price on a chart: its highs, lows, bars and the zones where it turns. Price action trading means basing trading decisions on that movement alone, without technical indicators.
Does price action trading really work?
Price action works as a way of reading the market, not as a money machine. Price shows where supply and demand meet. Clear rules, consistent risk management and practice are necessary safeguards, but they do not establish a profitable edge on their own; test your rules before you rely on them.
Is price action trading good for beginners?
Yes, price action is a good starting point, because you learn to read the market itself from the start. Plan several months of practice: first mark structure and observe, then simulate, and only then use real money with a small risk.
Which time frame is best for price action?
I prefer daily and four-hour charts for learning, because they require fewer decisions. Each bar summarizes a longer interval, while hiding detail you would see on lower time frames. Later you can transfer the approach to other time frames; you read structure, zones and rejection the same way.
What is the difference between price action and Smart Money Concepts?
Smart Money Concepts (SMC) overlap with classic price action in their use of swings, support and resistance and breakouts. SMC adds its own terminology, including order blocks and fair value gaps, and often interprets patterns as institutional activity. Those labels are interpretations; a price chart alone does not show who traded or why.
Which markets are suitable for price action trading?
Liquid markets work best: major forex pairs, stock indexes such as the S&P 500, major commodities and heavily traded stocks. In illiquid markets with large price jumps, structure and zones are less reliable, because single orders can distort the picture.
Do you need indicators to trade profitably?
No, indicators are optional. Price-based indicators are calculated from past prices, so they add no price information that is not already on the chart; volume and other indicators use additional data. Many traders use indicators sensibly as a filter or for confirmation. In my view, rules and risk control matter more than the choice of tools.
Which price action books are worth reading?
In my view, the most demanding classic is “Reading Price Charts Bar by Bar” by Al Brooks. It is a hard but rewarding book. Easier to read are the books by Joe Ross on reading charts, which I translated into German and published, and for candlestick patterns the standard work by Steve Nison. A wider selection by goal is in my guide to trading books.
This US edition is based on our German edition on kagels-trading.de and has been adapted for US readers.
More Chart Techniques guides
- Draw key levels
Support and Resistance: How to Draw and Use Key Levels
Where useful levels come from, how to draw zones with a stated rule and how to turn a level into a trade plan.
- Trade breakouts
Breakout Trading Strategy: Entries and False Breakouts
How often breakouts fell back into the range in our count of 1,472, and how to plan entry, stop and position size.
- Draw and trade trendlines
Trendline Trading: How to Draw Trendlines and Trade Them
How to draw trendlines with a fixed rule, four strategies for bounces, breaks and retests, and a real SPY line break without a lasting reversal.
- Use Fibonacci levels
Fibonacci Retracement Levels: How to Draw and Trade Them
How to calculate and draw retracement levels, trade pullbacks with confluence and a stop at the structure, and what a ten-year test says about the levels.
- Set Fibonacci targets
Fibonacci Extension: Levels, How to Draw It and Calculator
Three-point extension targets from the end of a pullback, why they differ from levels beyond 100%, a free calculator and three SPY swings, one without a single target reached.
- Trade gaps
Gap Trading Strategy: How to Trade Gaps and When Gaps Fill
Opening and full gaps, the four classic gap types, how often SPY gaps filled in our count since 2001, and plans for gap fill and gap and go.
- Calculate pivot points
Pivot Points: Formulas, Types and How to Trade Them
Formulas for standard, Fibonacci, Woodie, Camarilla and DeMark pivots, a free calculator, which session counts and a real SPY day.
- Swing trade
Swing Trading: 4 Strategies, Risk and Real Examples
Four swing trading strategies on the daily chart, position size, gap risk and US rules, with two hypothetical SPY pullbacks: one hit its target, one was stopped out.
- Identify market stages
Stage Analysis: Stan Weinstein's Four Market Stages
Stan Weinstein's four stages on the weekly chart, a Stage 2 checklist and two TSMC breakouts: one ran for a year, one gapped through its stop.
- Read Wyckoff ranges
Wyckoff Method: Accumulation, Distribution and Springs
Accumulation and distribution with phases A to E, springs and upthrusts as optional tests, and two real TSMC ranges read with and without hindsight.
- Trade Darvas boxes
Darvas Box Strategy: Rules, Entries and Stop Losses
The box rules step by step, when the edges become known, where the stop goes, and a mechanical test on TSMC in 2024 with two honest results.
- Count Elliott waves
Elliott Wave Theory: Rules, Patterns and Fibonacci
The five-wave pattern, three hard rules, zigzags, flats and triangles, Fibonacci ratios and a real DAX count, from the first German translator of the standard work.
- Trade order blocks
Order Blocks: How to Spot, Draw and Trade the Zone
The three conditions behind a valid order block, entry and stop at the zone, two SPY cases from 2026 and a 25-year count where a fixed rule lost money.
- Trade fair value gaps
Fair Value Gap (FVG): How to Spot, Trade and Test It
The three-candle rule, bullish, bearish and inverse FVG, two SPY cases from 2026 and a 25-year count of how often gaps were revisited and traded.
- Interpret volume
Volume Analysis in Trading: How to Read Volume Honestly
What volume counts in stocks, futures, forex and crypto, how to read it against its own average, and our SPY test of high-volume days since 2001.