
Darvas Box Strategy: Rules, Entries and Stop Losses


Contents
- The Darvas box strategy in 30 seconds
- Who was Nicolas Darvas?
- What is a Darvas box?
- The Darvas box rules step by step
- What Darvas added and what came later
- Example 1: TSMC in March 2024, a breakout and a gap
- Example 2: TSMC in July 2024, a breakout on low volume
- Finding Darvas box stocks: screeners and indicators
- Can you day trade the Darvas box?
- Advantages and limits of the Darvas box
- My conclusion on the Darvas box strategy
- Frequently asked questions about the Darvas box
- About the author
Few trading stories are as well known as that of a professional dancer who made a fortune in the stock market of the 1950s. Nicolas Darvas traded from hotel rooms around the world, read his prices in weekly newspapers and sent his orders by telegram. His tool was a simple pattern: the Darvas box.
This guide explains the box rules step by step and tests them on a real stock. You learn how a box is drawn, at which moment its top and bottom become known, where the buy order and the stop loss go, and why we separate the original method from later additions such as RSI filters. Two hypothetical TSMC trades from 2024 show the rules at work, including the result many guides leave out. This article follows our editorial policy.
The Darvas box strategy in 30 seconds
- Origin: Nicolas Darvas, a dancer who described his method in the 1960 book How I Made $2,000,000 in the Stock Market.
- The box: a price range between a new high that holds for three days and a low that holds for three days.
- Entry: a buy stop just above the top of the box, ideally on rising volume.
- Exit: a stop just below the bottom of the latest box, moved up as new boxes form.
- Best conditions: strong stocks in a bull market. In sideways markets, false breakouts pile up.
- The catch: stops can be gapped, and boxes in volatile stocks are often wide or shake you out. Darvas’s own returns prove nothing about yours.
Who was Nicolas Darvas?
Nicolas Darvas was a Hungarian-born dancer who studied economics at the University of Budapest and came to the United States in 1951. According to a TIME report from 1959, he had fled to Turkey during the war and performed with his sister Julia as a dance duo in theatres and clubs around the world.
His start in the market was an accident. In 1952 a nightclub owner in Toronto paid him in shares of a small Canadian mining company, Brilund. Darvas writes that he had bought 6,000 shares for $3,000 at 50 cents and later sold them at $1.90. After that he traded with tips and rumours, lost money, and gradually developed his own rules.
In his book he describes four stages of his learning: the gambler, the fundamentalist, the technician and the techno-fundamentalist. He ended up combining a technical rule, the box, with a fundamental filter for growing companies. TIME reported that he held only five or six stocks at a time, no blue chips, and followed prices through Barron’s and a nightly telegram from his broker. Among the stocks he named were E.L. Bruce, Universal Controls, Thiokol, Zenith Radio and Texas Instruments.
How much money he really made is disputed. His 1960 book How I Made $2,000,000 in the Stock Market became a bestseller. In December 1960 the New York Attorney General called the book’s central claim, from $37,000 to $2.25 million by July 1959, false: by the office’s count the traceable profit was about $216,000, and Darvas had used about $1.07 million in loans. Darvas fought the investigation, and in 1961 New York’s highest court allowed it to proceed; we found no reliable record of its final outcome. Read his story as a personal account, not as audited performance.
What is a Darvas box?
A Darvas box is a price range that a rising stock builds after a new high: the high that is not exceeded for three days forms the top, and the low that is not undercut for three days forms the bottom.
The box makes a pause in a trend visible. Its edges come from the stock’s own highs and lows, not from an indicator, so they work like a short-term support and resistance zone. As long as the price stays inside, the stock is consolidating. A move above the top shows that buyers are in control again, a move below the bottom that the trend is in doubt.
Darvas called his approach the box theory: a rising stock moves in a series of boxes, one above the other. He wanted to own the stock only while it climbed from box to box, and to be out as soon as it fell through the floor of its current box. That is a pure trend-following rule: buy strength, sell weakness, and never average down.
The Darvas box rules step by step
Darvas described the box in his book, but the precise three-day rule that most guides use comes from later editions and codifications. We could not confirm the exact three-day wording in a scan of the 1960 first edition; it appears in later reprints and in definitions such as Thomas Bulkowski’s. The steps below follow that common version. Where sources differ, as with the stop, we say so.
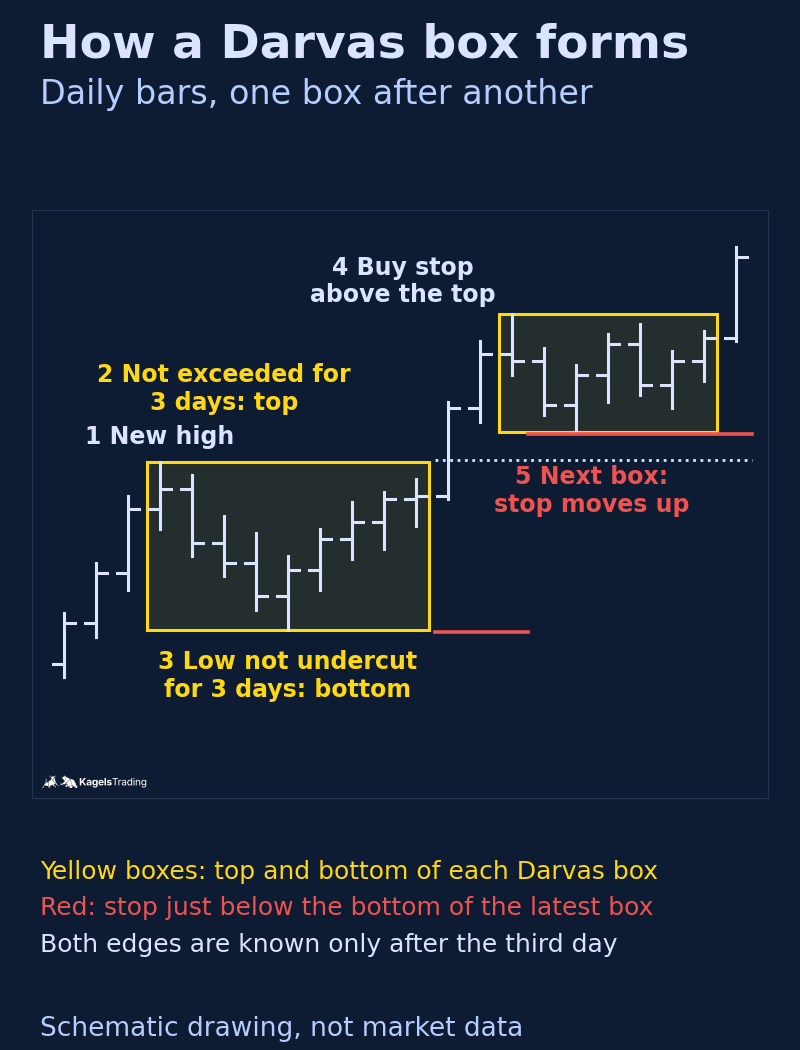 Click to enlarge
Source: Kagels Trading, own drawing.
- Select the stock: a stock that trades at or near a new high, preferably with rising volume. Darvas later added rising earnings as a second filter.
- Set the top: after a new high, wait until the price has not exceeded that high on three consecutive days. The high becomes the top of the box.
- Set the bottom: after the top, the lowest low becomes the bottom once it has not been undercut on three consecutive days.
- Place the buy order: a buy stop a little above the top. It only triggers if the price breaks out.
- Place the stop: a sell stop a little below the bottom of the box. If the price falls back through the box, you are out.
- Move the stop up: when the stock forms a new, higher box, the stop moves to just below its bottom. It never moves down.
Timing matters more than most guides admit: the edges of a box are known only after the third confirming day. Until then the top can still be replaced by a higher high, and the bottom by a lower low. If the price breaks out before the bottom is confirmed, there is no complete box yet, and in our model no trade. Drawing boxes on an old chart is easy; drawing them bar by bar, without seeing the future, is the real test.
What Darvas added and what came later
The core of the original method is the box plus an automatic stop-loss order with every purchase. In his book Darvas writes that every buy order was coupled with an automatic stop-loss order. Over time he added a fundamental filter: he preferred growing companies with improving earnings, which he called his techno-fundamentalist approach.
Sources differ on where Darvas placed his stop. TIME reported in 1959 that his stops sat just below the breakout point, the old top of the box. Many modern versions put the stop below the bottom of the box, as in our examples. The difference is large: with a stop one cent below the breakout level, both TSMC trades below would have ended two trading days after the entry at about break-even.
Everything else is a later addition. Moving averages, the RSI or MACD as filters, intraday boxes and automatic box drawing are modern variants, not Darvas’s rules. The term “Neo Darvas” is a generic label for such variants; we found no specific, documented system of that name. The best-known named adaptation is Daryl Guppy’s Darvas-style trading, published in Stocks & Commodities in 2005.
There is little independent testing. The most detailed public test we found is by Thomas Bulkowski, who applied his definition of the box to 557 stocks and 104 ETFs from 2001 to 2010. In his results, stocks on daily charts came out roughly flat, and buying the breakout at the intraday high, as Darvas did, did worse. It is a practitioner test, not a peer-reviewed study, but it is a useful warning against the famous story.
Example 1: TSMC in March 2024, a breakout and a gap
To test the rules without picking a flattering chart, we applied them mechanically to TSMC in 2024, the same stock we use in our guides to Stage Analysis and the Wyckoff method. We use the American depositary shares (TSM) on the NYSE and daily bars from Yahoo Finance. TSM rose strongly that year, so these are favourable conditions for a trend method. The rules and the full calculation are in our notes; the trades are hypothetical.
 Click to enlarge
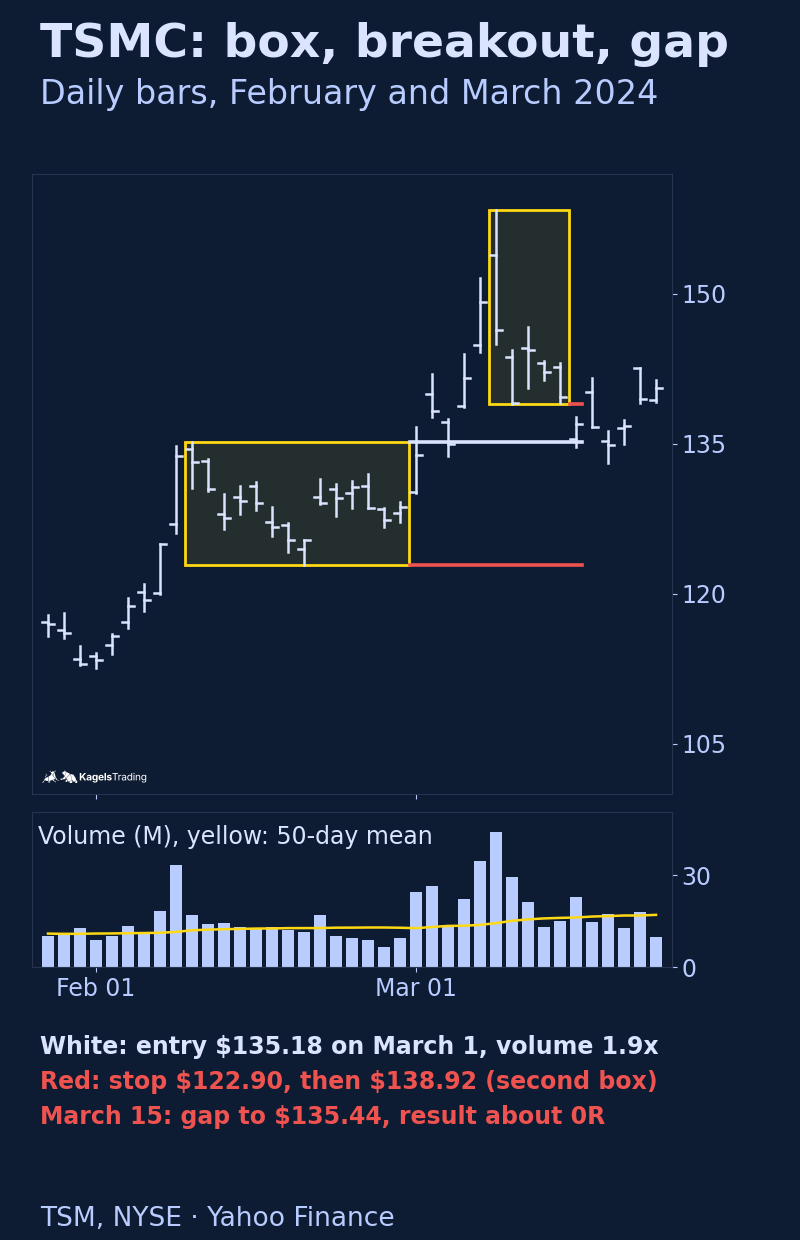
The first complete box of 2024 formed in February. TSM reached a new high of $135.17 on February 9 and did not exceed it on the next three days, which set the top. The low of $122.91 on February 21 was not undercut on the next three days, so both edges were known at the close of February 26. On March 1 the buy stop at $135.18 was triggered, on 24.4 million shares, 1.9 times the 50-day mean. The initial risk was $12.28 per share.
The stock then ran: in one week it climbed to $158.40, and a second, higher box formed. Its bottom of $138.93 was confirmed at the close of March 14, so the stop moved up to $138.92, above the entry price. The next morning, March 15, TSM opened at $135.44, below the new stop. A stop-market order would have been filled near that open, for a result of $0.26 per share, about 0R instead of a locked-in gain. A stop is a trigger, not a price guarantee.
Example 2: TSMC in July 2024, a breakout on low volume
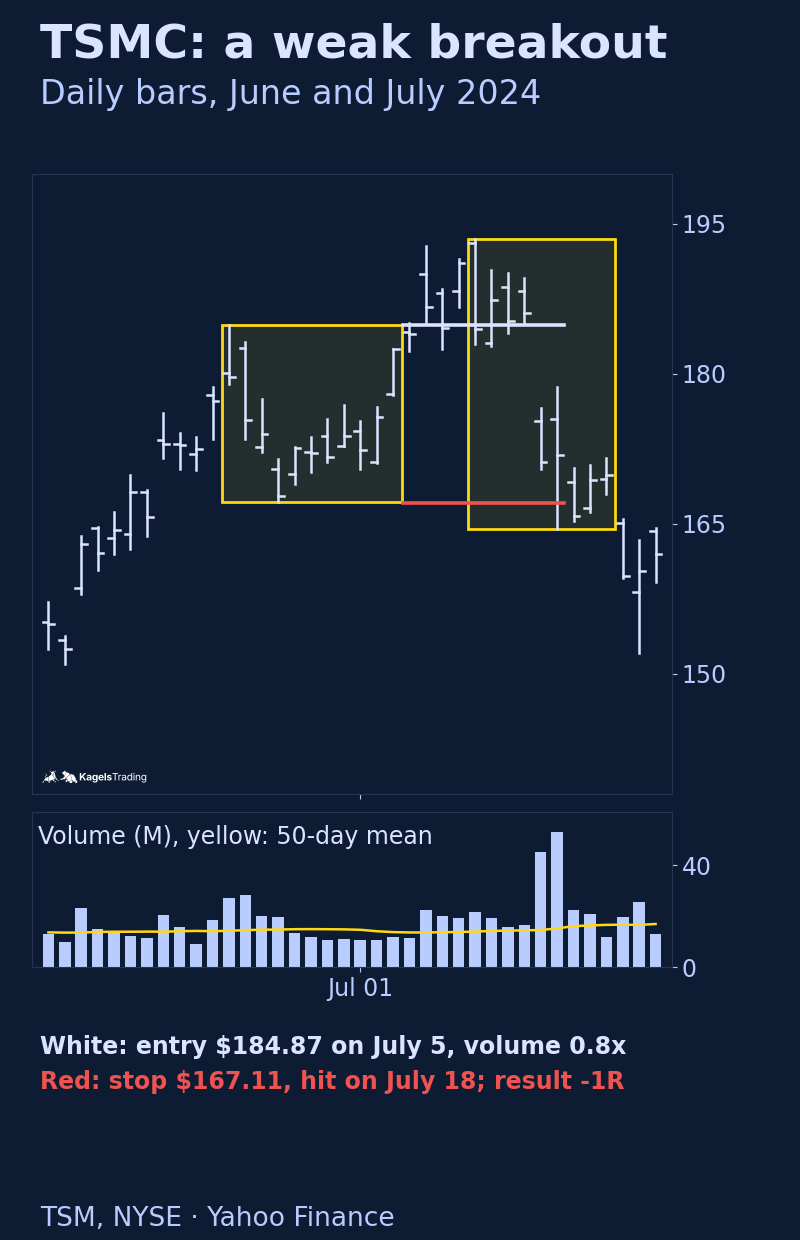
Under the same rules, the next complete box formed in June 2024 between $167.12 and $184.86. Both edges were known at the close of June 27. On July 5 the buy stop at $184.87 was triggered. This time volume was only 11.4 million shares, below the 50-day mean of 13.6 million.
 Click to enlarge
The breakout did not last. TSM reached $193.47 on July 11, then fell sharply on July 17 and 18. The stop at $167.11 was hit on July 18 without a gap, a loss of $17.76 per share, exactly the planned 1R. Darvas paid close attention to volume; a rule that requires breakout volume above the 50-day mean would have skipped this trade. We did not include such a filter in the test, because it is our choice, not a rule that is documented in this exact form.
Over the whole of 2024 the mechanical rules produced these two trades: about 0R and minus 1R. In the same year the price of TSM rose by about 90 %, from $104.00 to $197.49. Wide swings inside a strong trend repeatedly reached the bottom of the latest box. This is not a verdict on the method, but a reminder: boxes that fit a calm stock of the 1950s can be too narrow for a volatile stock today, and a rule set needs a test on many stocks, not one chart.
Finding Darvas box stocks: screeners and indicators
A screener can do the first step that Darvas did by hand: find stocks near a new high with rising volume. Filters such as “price within 5 % of the 52-week high” and “volume above the 50-day average” are available in most screeners. Our TradingView screener guide shows what the free plan can filter. A screener produces candidates, not boxes.
TradingView’s list of built-in indicators has no Darvas box, but its community library contains many scripts that draw boxes automatically. They differ in how they define the three days, the bottom and the breakout, so check the code or the description before you trust one. Automatic boxes are often drawn with hindsight, so watch how a script behaves bar by bar, not only on the finished chart.
Can you day trade the Darvas box?
The box logic can be applied to intraday charts, but this is an adaptation, not Darvas’s method. He worked with daily prices from newspapers and held positions for weeks or months. On a 15-minute chart, three bars are 45 minutes, spreads and costs matter much more, and the number of false breakouts rises. If you try it, test the rules first on a demo account and keep the risk per trade small.
Advantages and limits of the Darvas box
The box’s main strength is clarity: entry, stop and exit are fixed before the trade. The rules are easy to learn, the risk is defined from the first day, and the method forces you to buy strength and to cut losses early. It also combines well with a simple market filter and the breakout planning from our guide to breakout trading.
Its limits are just as clear. The entry comes after the breakout, so part of the move is gone. In sideways markets, false breakouts and whipsaws pile up, and each one costs a small loss plus trading costs. Gaps can move the exit far past the stop. And there is no independent proof of a lasting edge: Darvas’s own results come from one bull market and his own account.
My conclusion on the Darvas box strategy
I value the Darvas box for its discipline more than for its signals. Buy the breakout, sell the break, move the stop up: this simple order protects beginners from the most expensive habits, averaging down and hoping. In strong bull markets that is a real advantage.
The market phase decides, and so does the stock. Used on everything, the method gets ground down in sideways markets. Our TSMC test shows that even a strong trend can shake out a narrow box twice. Combine the box with a market filter, a check of breakout volume and a position size that survives a series of small losses, and treat every rule you add as something to test, not as a guarantee.
Frequently asked questions about the Darvas box
What is the Darvas box strategy?
The Darvas box strategy is a breakout method by Nicolas Darvas that buys a rising stock when it breaks out of a box above a new high and sells it when it falls below the box. The box is defined by a high and a low that each hold for three days. The stop moves up with every new, higher box.
How do you draw a Darvas box?
Start at a new high and wait three days: if the high is not exceeded, it becomes the top of the box. Then take the lowest low after the top; if it is not undercut on the next three days, it becomes the bottom. Both edges are known only after the third confirming day.
Does the Darvas box strategy still work?
The rules still produce clear entries and exits, but there is no independent proof that they beat the market today. Results depend on the market phase, the volatility of the stock and costs. In our mechanical test on TSMC in 2024 the method produced about 0R and minus 1R while the stock rose, so test it on many stocks before you use real money.
Is there a Darvas box indicator for TradingView?
TradingView offers no built-in Darvas box indicator, but community scripts in its public library draw the boxes automatically. Their rules differ, so read the description first. Check how a script behaves bar by bar, because many boxes look perfect only with hindsight.
Which stocks suit the Darvas box?
Darvas looked for stocks making new highs with rising volume, and later also for rising earnings. Liquid stocks with a clear uptrend in a rising market give the cleanest boxes. Very volatile stocks often form wide boxes or hit the stop inside a trend.
What is the Neo Darvas strategy?
“Neo Darvas” is a loose label for modern versions of the box method, not a specific documented system. Such versions add indicators such as moving averages, the RSI or MACD, use software to draw the boxes or apply them to intraday charts. Each addition changes the rules, so it needs its own test.
This English edition is based on our German edition on kagels-trading.de and has been adapted for international readers.
More Chart Techniques guides
- Draw key levels
Support and Resistance: How to Draw and Use Key Levels
Where useful levels come from, how to draw zones with a stated rule and how to turn a level into a trade plan.
- Read price action
Price Action Trading: How to Read Charts Without Indicators
Market structure, key zones and three bar patterns, with a core setup and a real SPY example where the signal failed.
- Trade breakouts
Breakout Trading Strategy: Entries and False Breakouts
How often breakouts fell back into the range in our count of 1,472, and how to plan entry, stop and position size.
- Draw and trade trendlines
Trendline Trading: How to Draw Trendlines and Trade Them
How to draw trendlines with a fixed rule, four strategies for bounces, breaks and retests, and a real SPY line break without a lasting reversal.
- Use Fibonacci levels
Fibonacci Retracement Levels: How to Draw and Trade Them
How to calculate and draw retracement levels, trade pullbacks with confluence and a stop at the structure, and what a ten-year test says about the levels.
- Set Fibonacci targets
Fibonacci Extension: Levels, How to Draw It and Calculator
Three-point extension targets from the end of a pullback, why they differ from levels beyond 100%, a free calculator and three SPY swings, one without a single target reached.
- Trade gaps
Gap Trading Strategy: How to Trade Gaps and When Gaps Fill
Opening and full gaps, the four classic gap types, how often SPY gaps filled in our count since 2001, and plans for gap fill and gap and go.
- Calculate pivot points
Pivot Points: Formulas, Types and How to Trade Them
Formulas for standard, Fibonacci, Woodie, Camarilla and DeMark pivots, a free calculator, which session counts and a real SPY day.
- Swing trade
Swing Trading: 4 Strategies, Risk and Real Examples
Four swing trading strategies on the daily chart, position size, gap risk and US rules, with two hypothetical SPY pullbacks: one hit its target, one was stopped out.
- Identify market stages
Stage Analysis: Stan Weinstein's Four Market Stages
Stan Weinstein's four stages on the weekly chart, a Stage 2 checklist and two TSMC breakouts: one ran for a year, one gapped through its stop.
- Read Wyckoff ranges
Wyckoff Method: Accumulation, Distribution and Springs
Accumulation and distribution with phases A to E, springs and upthrusts as optional tests, and two real TSMC ranges read with and without hindsight.