
Multi-Timeframe Analysis: A Weekly and Daily Workflow


Contents
Multi-timeframe analysis is looking at the same market on two charts, one for context and one for entry, with a stated rule for each. This guide uses the weekly chart for context and the daily chart for entry. The example is a hypothetical SPY case from June 2025 under one illustrative rule, retrospectively selected. This article is educational, not personal advice. This article follows our editorial policy.
Multi-timeframe analysis in 30 seconds
- Context on the weekly chart, entry on the daily chart. Two or more frames can work; this guide stays with two for the explanation.
- One illustrative rule, written before the chart. Setup, trigger, entry, close-based exit, broker-side stop, target and expiry are all stated before the trade.
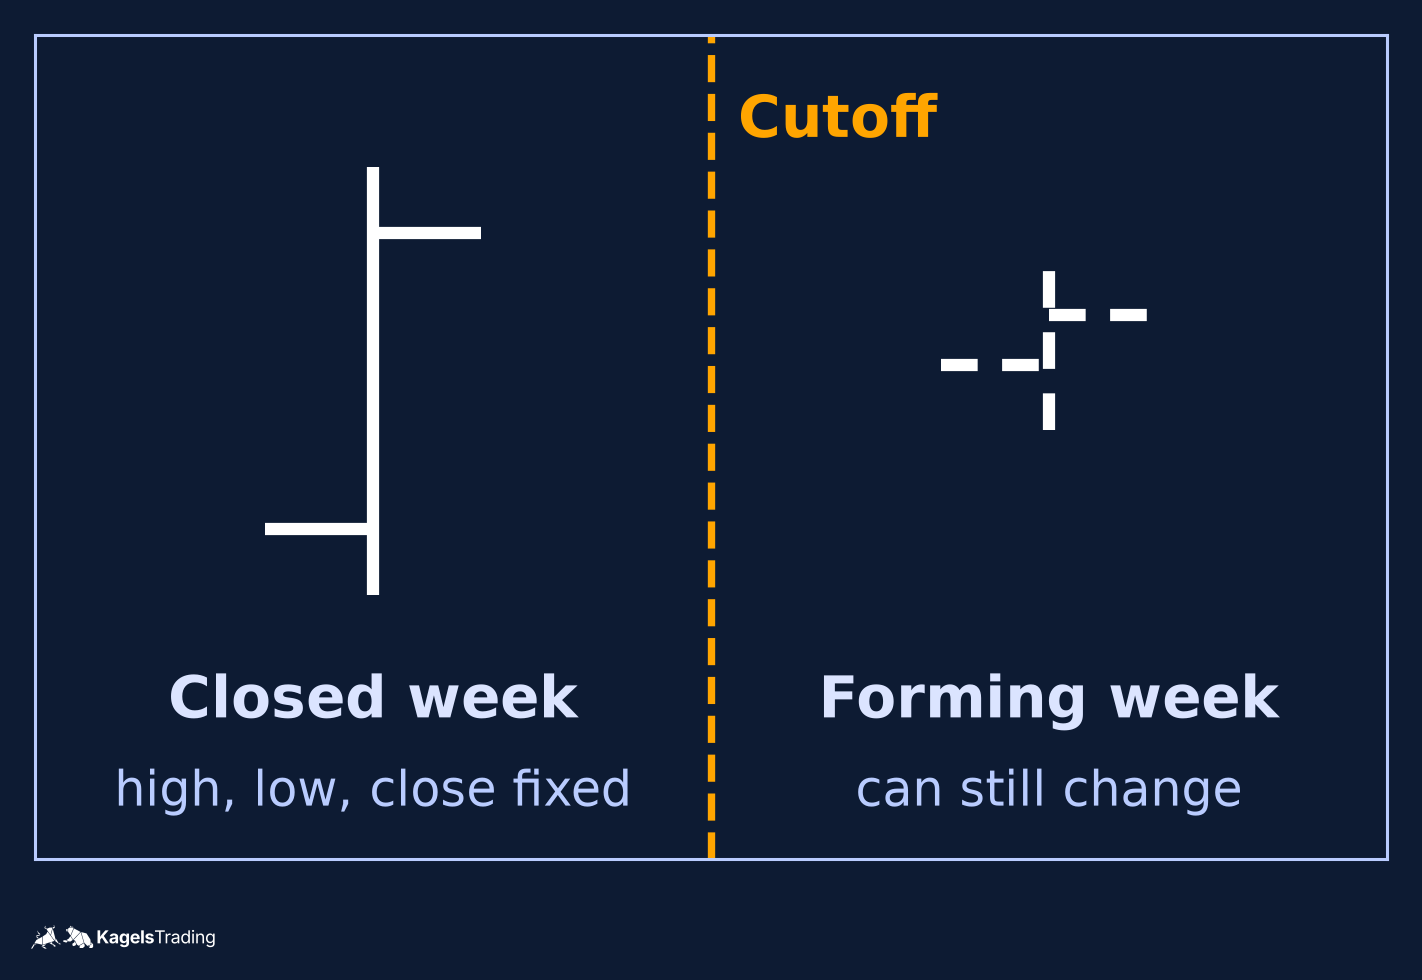
- Higher-frame intrabar is provisional. The weekly bar’s high, low and close are unknown until the week has closed; a decision inside the week uses the last confirmed weekly bar.
- A no-trade week is not a failed trade. When the rule says nothing, the plan says nothing.
What multi-timeframe analysis is
Multi-timeframe analysis is reading the same market on more than one chart with a stated reason for each chart. The higher frame carries context: where price is inside a larger structure and which level is in play. The lower frame carries the trigger: the bar close that turns a plan into an order.
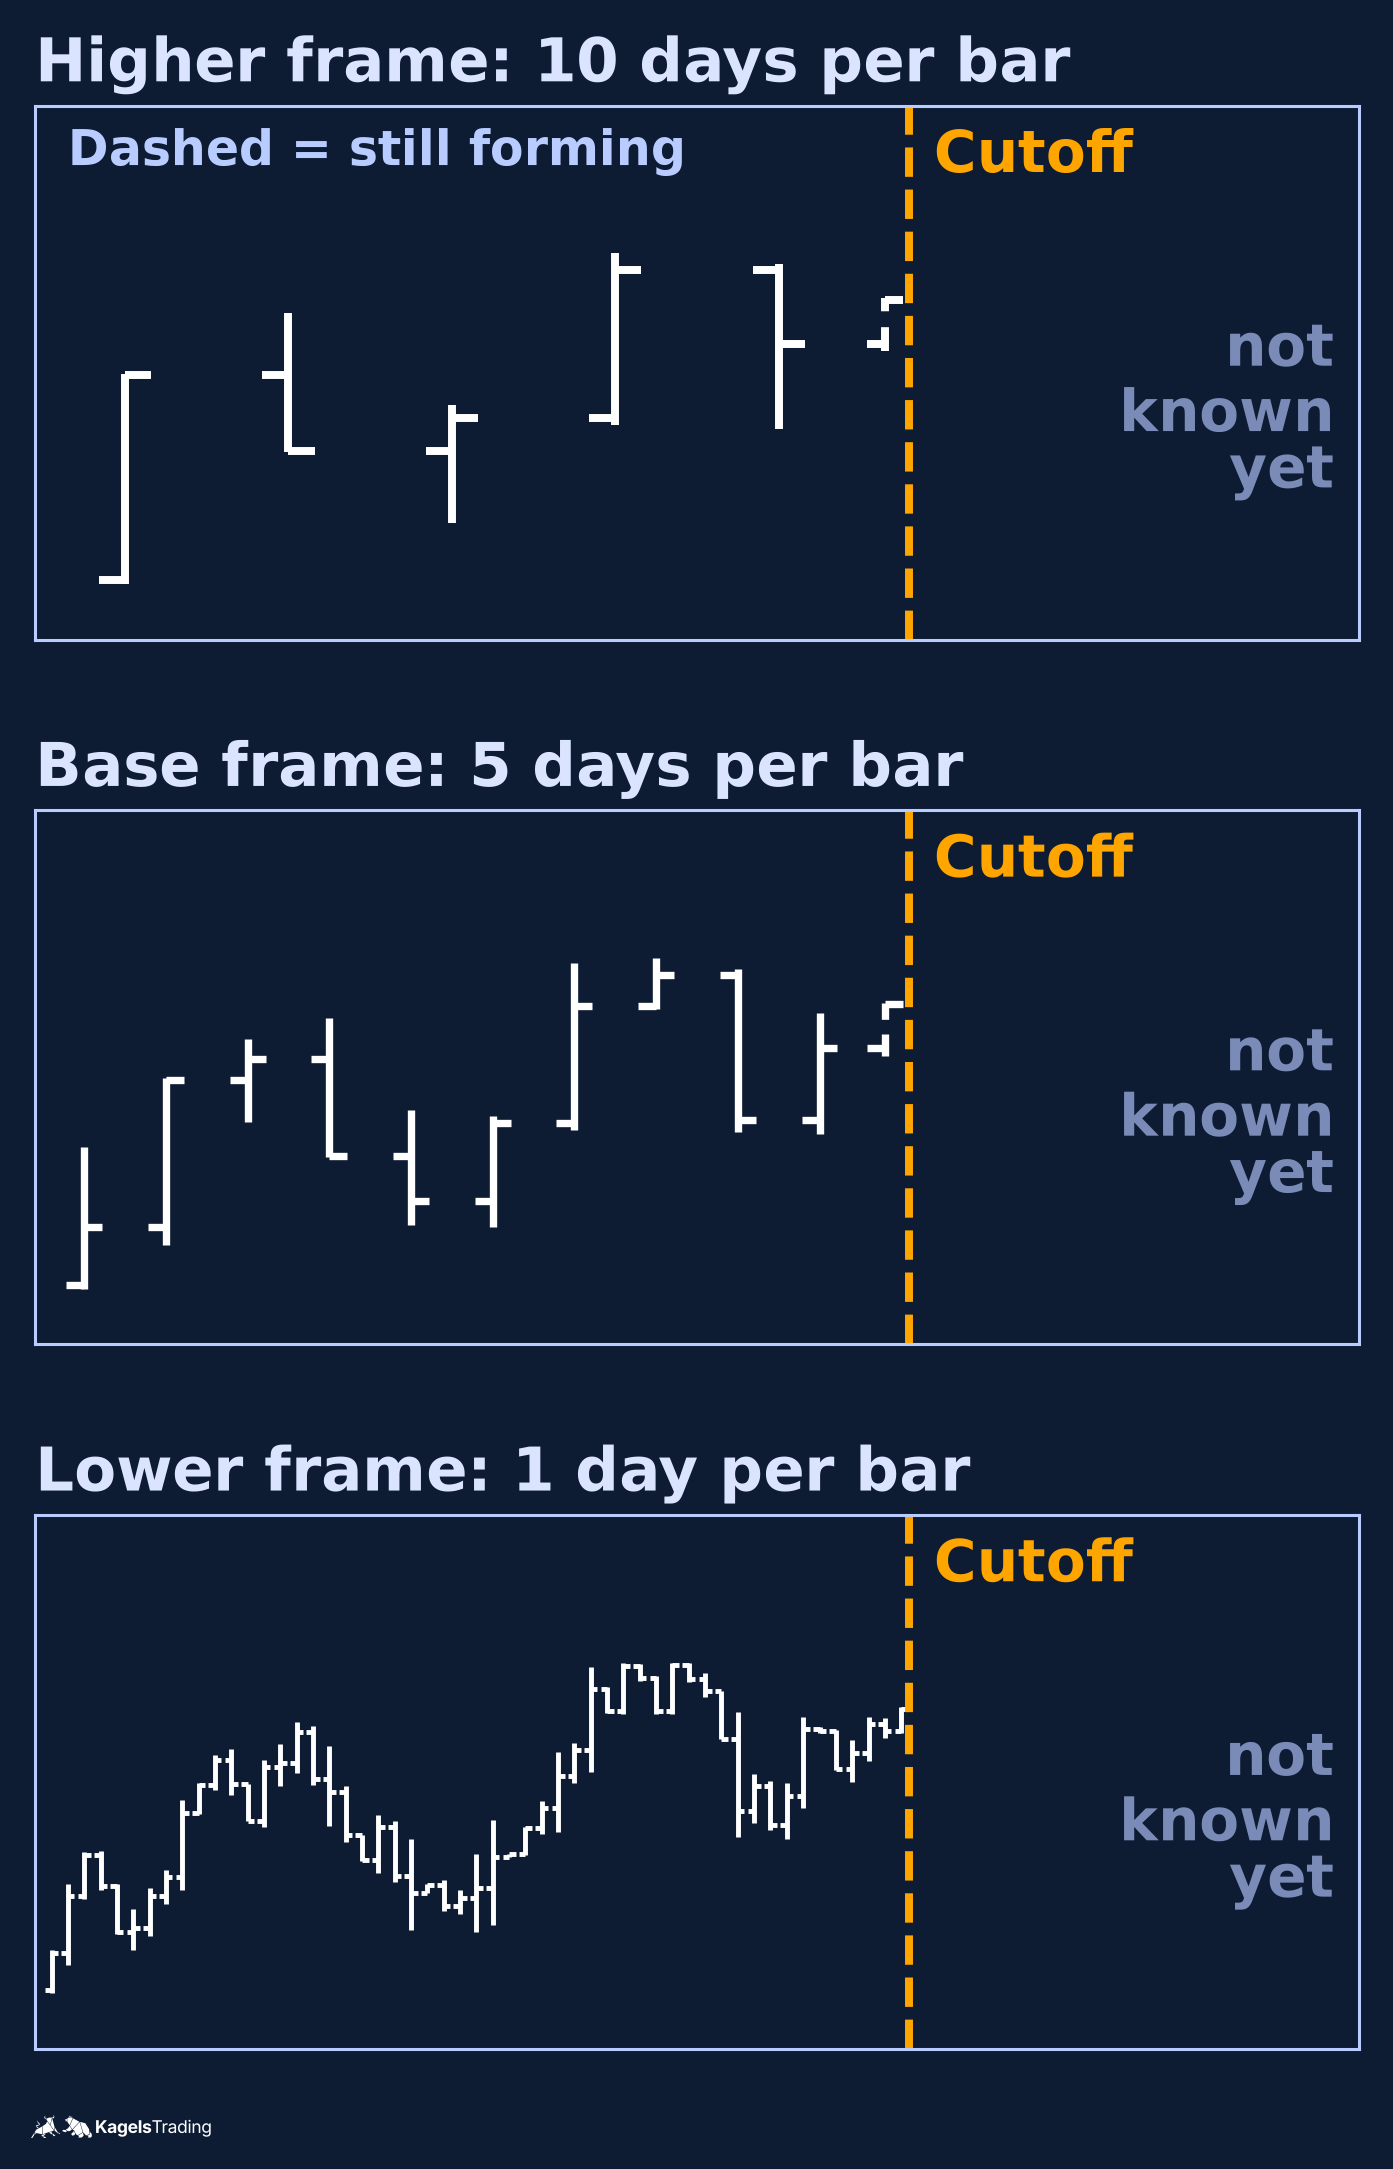
Higher and lower frames describe the same prices, aggregated differently. A weekly bar’s open is the first daily open of the week; its high is the maximum of that week’s daily highs; its low is the minimum of that week’s daily lows; its close is the last daily close. Agreement between frames is the same data at two zoom levels, not independent evidence.
Choose the base frame
 Click to enlarge
Source: Kagels Trading, own drawing.
The base frame follows the holding period, not personal taste. A trader who holds for a few days to a few weeks uses a daily base and a weekly context frame. A trader who holds for a few hours uses an intraday base and a daily context. The daily and weekly pair in this guide is a conventional starting point for a swing trader; the mechanics are the same at other scales.
One higher frame sits above the base. It answers one question: is the market in the structure where the plan is supposed to work. The higher frame is read; it is not traded on its own. Price action covers how to read structure directly on the chart.
Three or more frames add decisions. Each extra chart is another place where the plan can be second-guessed. The ratio between adjacent frames in this guide is one weekly bar against typically five daily bars; a holiday week has fewer, as in the SPY case below. The ratio is a counting convention, not an optimisation target.
| Style | Context frame | Base frame |
|---|---|---|
| Position | Monthly | Weekly |
| Swing | Weekly | Daily |
| Day trading | Daily | Intraday |
The top-down workflow
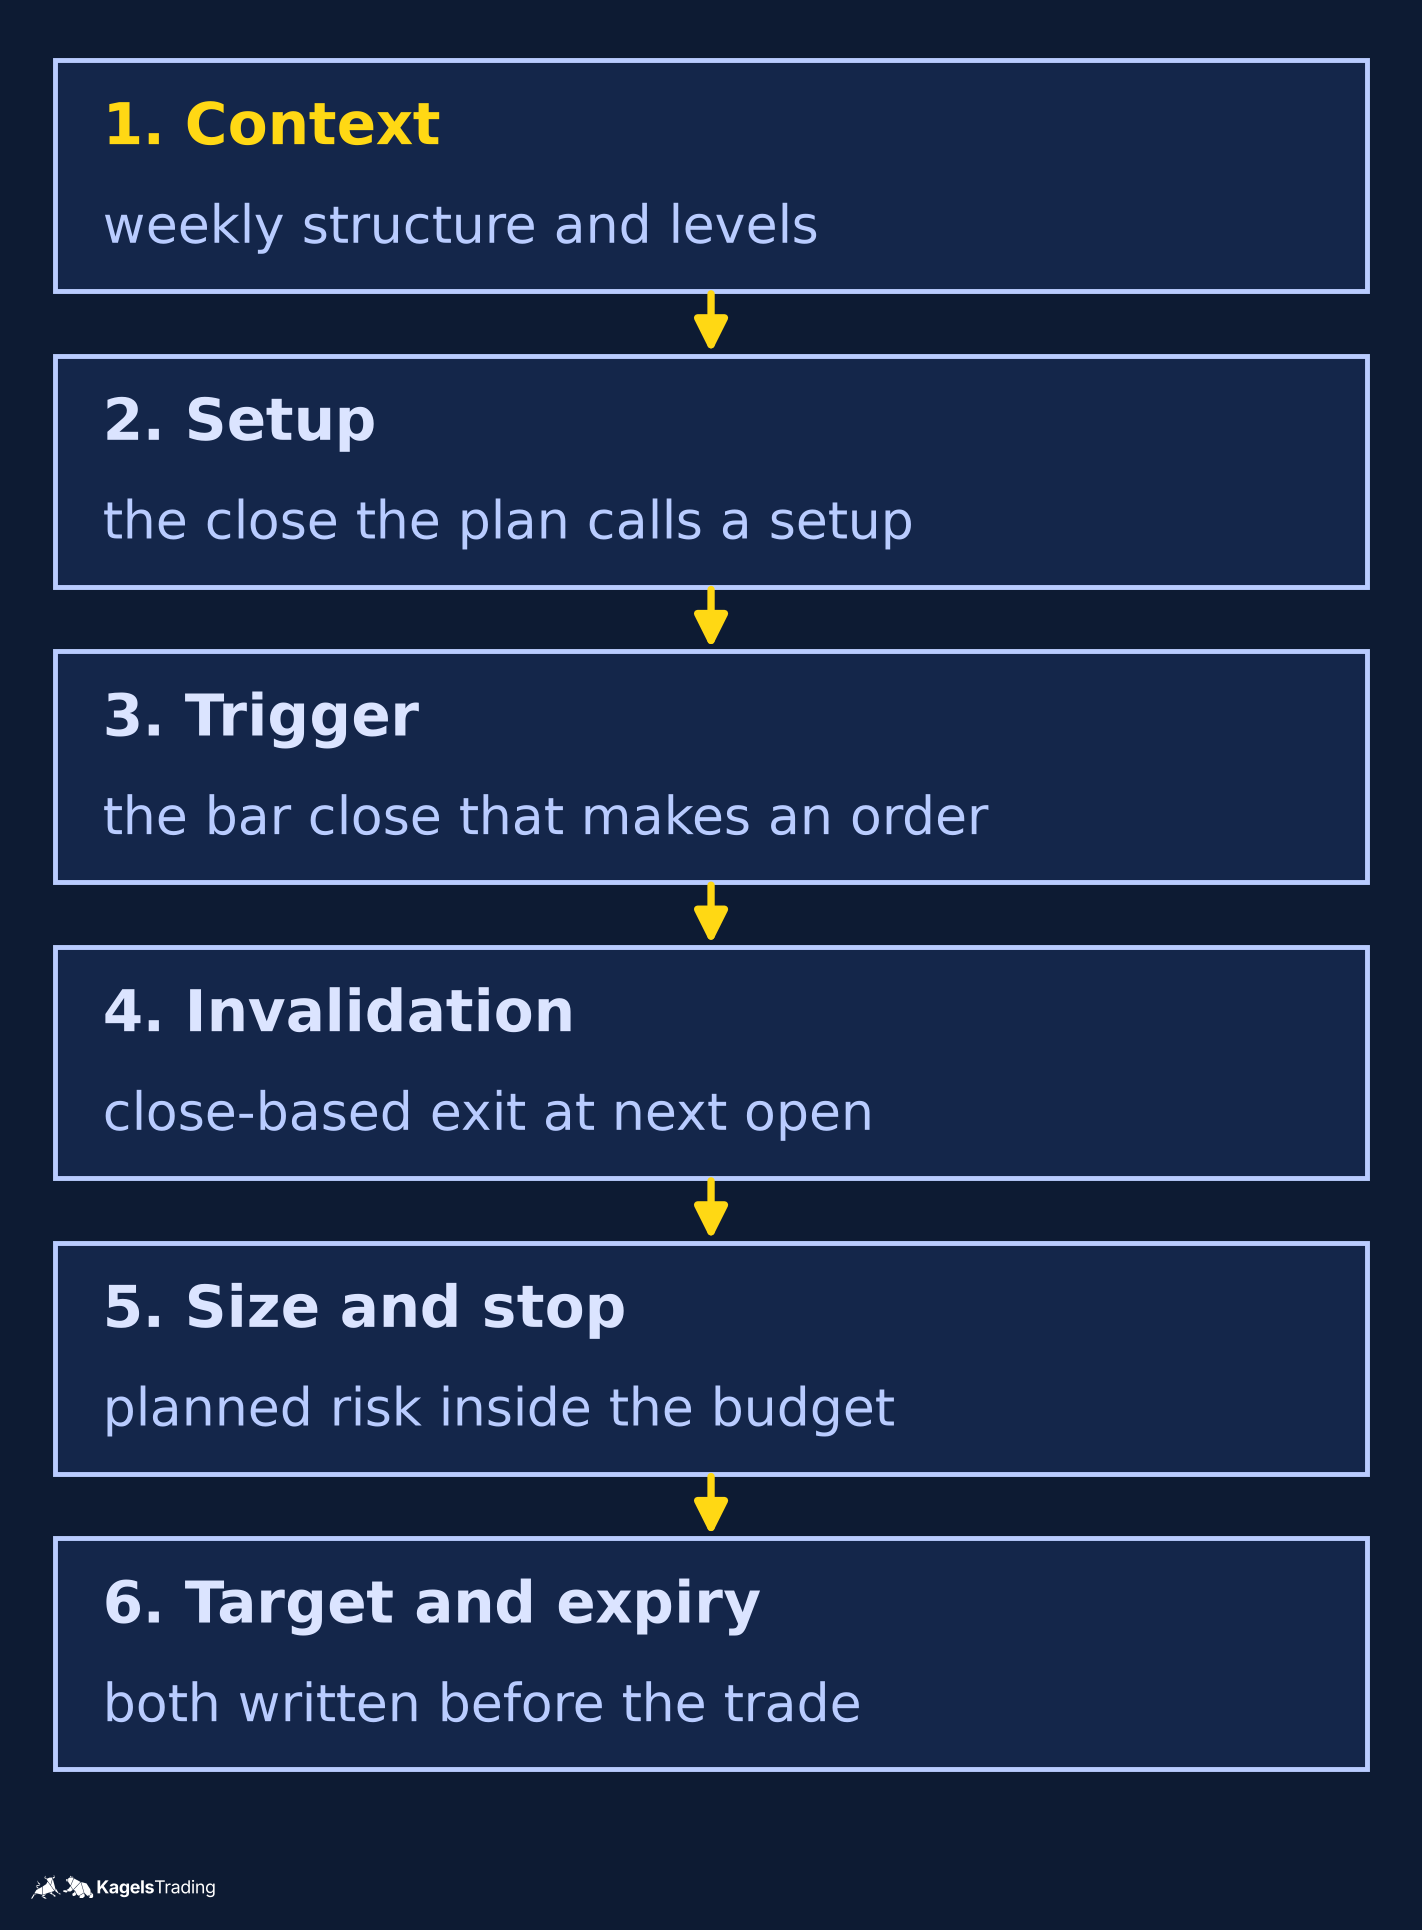
The top-down workflow is a stated order of six steps. It is a plan with each step written before the trade; a missing step is a shortcut, not a trade.
- Context on the higher frame. The weekly structure: a prior weekly high, a prior weekly low, the direction between them.
- Setup on the base frame. The pattern or close that the plan calls a setup.
- Trigger on the base frame. The specific bar close that turns the setup into an order.
- Close-based invalidation. The price at which the setup is wrong, as decided at a bar close; exit at the next open.
- Position size and broker-side stop. The size keeps the planned cash risk inside the per-trade budget. The resting broker stop is a conditional order whose fill can be worse than its trigger price in a gap or fast market; the planned stop distance is the intended loss, not a cap on the possible loss. Position sizing is a separate calculation; see our risk management guide.
- Target and expiry. At least one target and the rule for exit if the target is not reached inside the expiry.
When the frames disagree
 Click to enlarge
Source: Kagels Trading, own drawing.
When the context frame and the base frame disagree, the plan has three stated options. Skip the trade; wait for a named level on the higher frame to resolve; or trade a separately defined counter-trend setup with its own rule. A fourth option is to redefine the plan, which is permitted but is itself a rule change, not a trade.
Higher-frame intrabar is provisional. The right-hand weekly bar on the chart changes until the week has closed. A decision inside the week uses the last confirmed weekly bar, not the forming one. A forming weekly bar can be read as provisional, as long as the plan does not act on an eventual-close value that is not yet known.
 Click to enlarge
Source: Kagels Trading, own drawing.
One SPY case in June 2025
 Click to enlarge
The illustrative rule is written before the chart. On SPY daily bars, with weekly bars aggregated by trading week (first open, maximum high, minimum low, last close), and under one swing-high convention:
- Weekly swing high (left-1, right-1 pivot). A weekly bar is a swing high when the prior weekly bar has a lower high and the next weekly bar has a lower high. The pivot is confirmed only when the next weekly bar closes.
- Lower reference. The lower end of the measured-move calculation is the minimum low of exactly two completed weeks ending with the pivot week: the pivot week itself and the week before it. This is a named selection, not a confirmed swing low.
- Setup. A weekly close above the confirmed weekly swing high (both conditions required at the close of the setup week).
- Entry. Market order at the next US cash open after the setup week closes.
- Close-based exit. A daily close back below the confirmed weekly swing high triggers a market exit at the next US cash open. The close-based exit is a decision, not an order; it cannot be guaranteed to fill at any specific price.
- Protective broker-side stop (optional). A resting sell stop below the lower reference can be placed. A gap can print and fill below the stop price, so the planned loss is not capped at the stop distance.
- Target. A hypothetical sell-limit at the measured move: the vertical distance between the swing high and the lower reference, projected upward from the swing high.
- Expiry. 10 trading days, counting the entry day as day 1. If the target has not filled and no exit has fired by the close of day 10, a market order exits at the next US cash open.
- Educational caveat. This is a hypothetical illustration of mechanics, retrospectively selected, not a backtest, not a recommendation to trade.
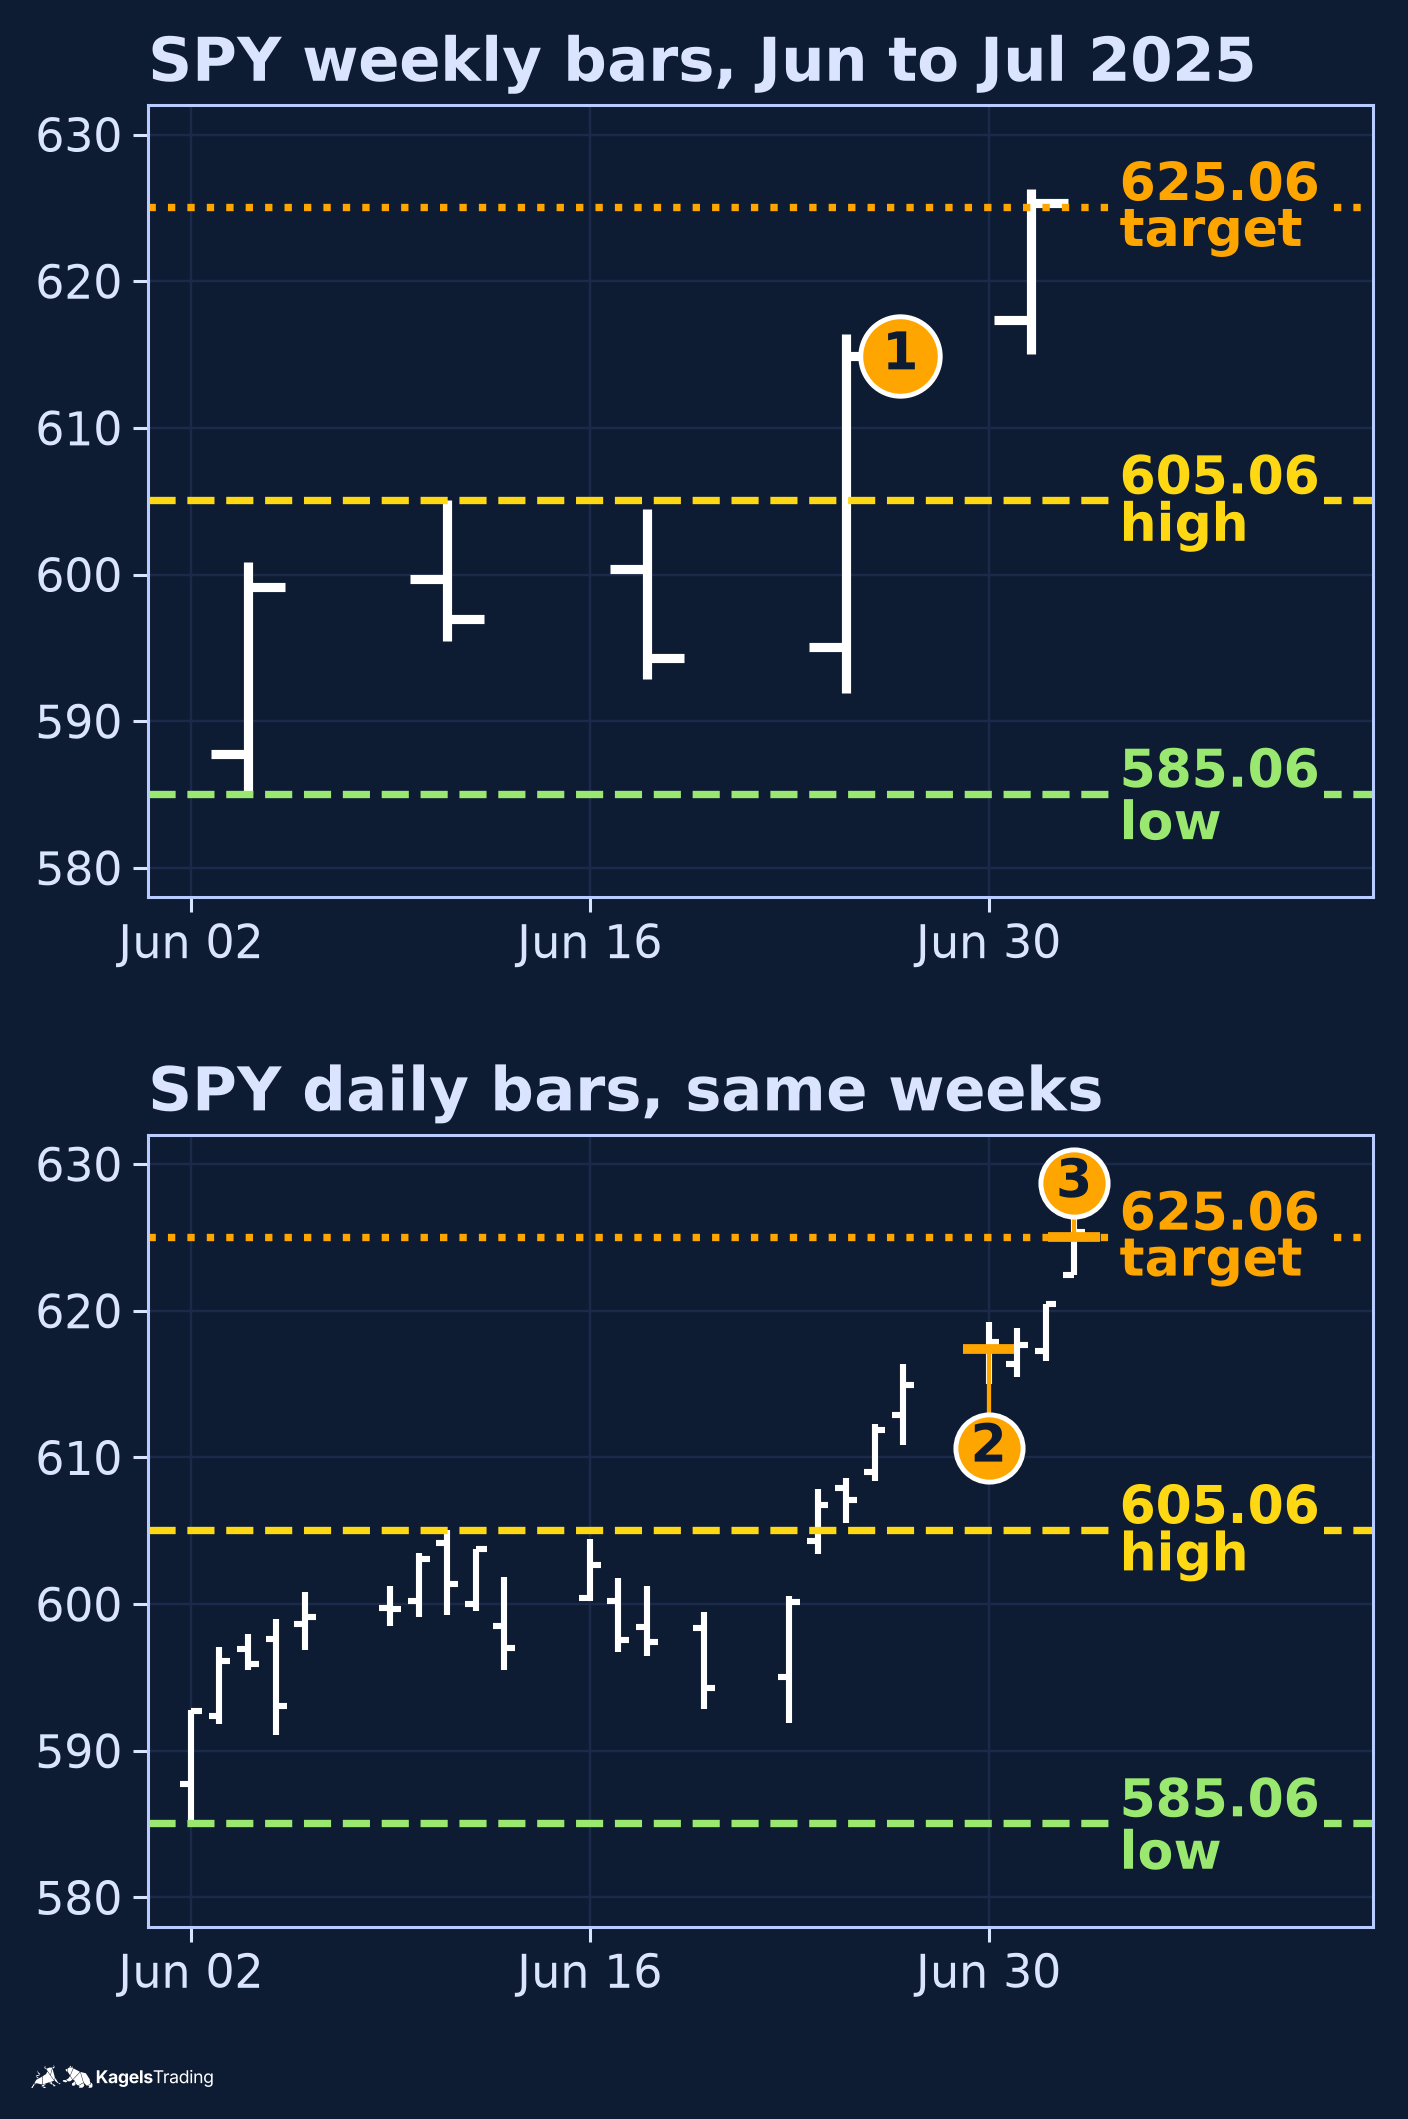
Applied to the June 2025 window. The weekly bar 2025-06-09 to 2025-06-13 had a high of 605.06. The next weekly bar 2025-06-16 to 2025-06-20 had a lower high of 604.45. Under the left-1 right-1 rule, the 2025-06-09 to 2025-06-13 week is a confirmed weekly swing high only after the next weekly bar closes on 2025-06-20.
- Lower reference: the minimum low of the two weeks ending with the pivot week. Pivot week (2025-06-09 to 2025-06-13) low 595.48; prior week (2025-06-02 to 2025-06-06) low 585.06. Lower reference equals the minimum, 585.06.
- Measured move: 605.06 minus 585.06 equals 20.00 points, projected from 605.06 gives 625.06.
- The weekly bar 2025-06-23 to 2025-06-27 closed at 614.91, above the 605.06 confirmed swing high. The setup fires at the weekly close on 2025-06-27.
- Entry at the next US cash open: 2025-06-30 open 617.38.
- Close-based invalidation watched on the daily frame: no daily close back below 605.06 between entry and the target fill on 2025-07-03.
- A hypothetical sell-limit at 625.06 is on the chart from the day of entry. The 2025-07-03 intraday high reached 626.28; the illustration assumes the hypothetical limit fills at 625.06. That session was an early close at 13:00 Eastern Time, and the week has four trading days because the market was closed on July 4.
- Hypothetical reward per share at the target: 625.06 minus 617.38 equals 7.68 points.
- A protective sell stop at 585.06 would have left a planned stop distance of 32.32 points; a gap below 585.06 at any session open would have filled lower, so the planned stop distance is the intended loss on the trade, not a cap on the possible loss. The reward-to-risk against the planned stop distance is roughly 1 to 4.2; a nearer stop would reduce the planned loss and raise the chance that an intraday wick triggers it.
One hypothetical case does not establish a win rate. It describes how one rule, written before the chart, would have played out on one window after the fact. On another window the same rule can give no setup, a stop-out or a target hit; all three are inside the plan.
When the rule gives no setup
This specific setup became available at the June 27 weekly close. At the close of the week ending 2025-06-13, the Jun 9-13 pivot was still unconfirmed, because the next weekly bar had not closed. At the close of the week ending 2025-06-20, the pivot was confirmed, but the weekly close of 594.28 was below 605.06, so there was no setup. At the close of the week ending 2025-06-27, the weekly close of 614.91 was above 605.06, and the setup was there. A trader following the rule had no trade from this setup before June 27, and that waiting was part of the plan: a no-trade week is not a failed trade. This covers only the weeks named here, not every earlier SPY week.
Checklist and limits
- One instrument across both frames, one timezone, one session.
- The weekly bar closes once per week. A decision inside the week uses the last confirmed weekly bar.
- The information cutoff is the close of the base bar at the moment of decision. Do not use an eventual later close during an earlier decision.
- One illustrative rule, written before the chart. The one documented case does not establish a win rate.
- Costs matter. Spreads, commissions and overnight financing cut into the measured-move target.
- The protective broker-side stop and the close-based exit are different orders. The first is a resting stop at a price; the second is a decision at a daily close acted on at the next open. State both before the trade.
- Switching the base frame mid-plan is a rule change. Treat it as one. Comparing results across different base frames is only informative when the comparison is itself stated in advance.
Frequently asked questions about multi-timeframe analysis
Which timeframe should a beginner start with?
The weekly chart for context and the daily chart for the base is a reasonable starting point for a swing trader. The weekly chart gives one bar close per week, which is enough time to read a structure. The daily chart gives one close per US cash session, which is enough detail for a swing trade.
Do more frames mean a better signal?
More frames do not add independent evidence on their own. Higher and lower frames carry the same prices at different magnifications. The number of frames in agreement is a story about your attention, not independent evidence.
What ratio between frames is right?
There is no single right ratio. A full trading week typically has five daily bars, and a holiday week can have fewer. An early close still produces one daily bar: the week of 2025-06-30 has four daily bars because the market was closed on July 4, not because July 3 closed early. Pick a ratio that gives the higher frame enough bars to read a structure without the lower frame producing noise on every bar.
Can I use the same indicator on each frame?
Yes, and the indicator reads a different number of bars on each frame. A 14-period Relative Strength Index on the daily frame reads 14 daily bars with Wilder smoothing, which has memory beyond the lookback. The same indicator on the weekly frame reads 14 weekly bars. The number on the screen is not the same quantity on both frames.
What if my base frame triggers and the higher frame does not?
Then the base frame triggered itself, not the plan. The plan is defined across both frames. A base-frame signal without a context-frame setup is a different trade, with its own rules.
Should I switch to a different base when the market phase changes?
Switching the base mid-plan is a rule change. It is permitted; it is not the same plan any more, and the results before and after the switch are not directly comparable without a stated comparison rule.
How often should I re-read the context frame?
At every setup and once per weekly bar close. Re-reading the weekly chart every day while a weekly bar is forming is noise on the base-frame decision, not context.
Does multi-timeframe analysis improve my win rate?
Multi-timeframe analysis does not improve a win rate by itself. It is a discipline for decisions, not an edge. Any claim that one timeframe pairing produces a higher win rate on its own needs the same evidence as a backtest: method, data, costs, out-of-sample.
This English edition is based on our German edition on kagels-trading.de and has been adapted for international readers.
More Chart Techniques guides
- Read price action
Price Action Trading: How to Read Charts Without Indicators
Market structure, key zones and three bar patterns, with a core setup and a real SPY example where the signal failed.
- Read candlestick charts
How to Read Candlestick Charts: Body, Wicks and Context
Open, high, low and close in one candle, body and wicks, two real Gold candles read step by step and how often patterns really occur.
- Know candlestick patterns
Candlestick Patterns: 10 to Know, Tested on Real Data
Ten patterns with rules and a cheat sheet, counted on DAX, S&P 500, EUR/USD and Gold since 2014: most are rare, none is a signal on its own.
- Trade the hammer candle
Hammer Candlestick: Spot It, Trade It, Know Its Limits
Three features, the difference to inverted hammer and hanging man, entry and stop, and how rarely the hammer appeared in four markets since 2014.
- Spot a morning star
Morning Star Candlestick: Rules, Real Cases, Limits
Three measurable rules, every morning and evening star in four markets since 2014, and two real cases: one reached its target, one hit its stop.
- Spot a topping tail
Topping Tail Candlestick: Rules, Silver Example and Limits
Six measurable rules for the bearish rejection candle, a silver candle from January 2026 checked step by step, the difference from the shooting star and how to trade it with a stop.
- Trade pullbacks
Pullback Trading: Entries, Stops and Failed Setups
Pullback or reversal, limit against confirmation entry, and one fixed rule set on three real QQQ cases: a target, a stop and a cancelled setup.
- Trade sideways ranges
Range Trading: Boundaries, Orders and Two Documented Fades
A 14-session rule to draw horizontal boundaries, three order-type variants and two Alpaca-verified SPY fades, one that reached the target and one that was stopped out.
- Read a consolidation
Consolidation in Trading: What the Range Tells You
What a consolidation is, why 25 years of index data showed no stable direction edge from narrow ranges or the prior trend, and two DAX breakouts from 2026.
- Read chart formations
Chart Patterns: Reversals, Continuations and Failures
Reversal, continuation and bilateral formations with the measured-move convention per pattern and two documented SPY rectangle cases.
- Trade rising and falling wedges
Rising and Falling Wedge Patterns: How to Trade Them
How to spot both wedges, where to set entry, stop and target, and why Bulkowski ranks the rising wedge with a downward breakout last of 36 patterns.
- Trade breakouts
Breakout Trading Strategy: Entries and False Breakouts
How often breakouts fell back into the range in our count of 1,472, and how to plan entry, stop and position size.
- Draw and trade trendlines
Trendline Trading: How to Draw Trendlines and Trade Them
How to draw trendlines with a fixed rule, four strategies for bounces, breaks and retests, and a real SPY line break without a lasting reversal.
- Draw a pitchfork channel
Andrews Pitchfork: How to Draw It, Trade It and Test It
Three pivots, a median line and two parallels, Schiff variants, a trade plan and how often price reached the median line in 746 cases.
- Use Fibonacci levels
Fibonacci Retracement Levels: How to Draw and Trade Them
How to calculate and draw retracement levels, trade pullbacks with confluence and a stop at the structure, and what a ten-year test says about the levels.
- Set Fibonacci targets
Fibonacci Extension: Levels, How to Draw It and Calculator
Three-point extension targets from the end of a pullback, why they differ from levels beyond 100%, a free calculator and three SPY swings, one without a single target reached.
- Trade gaps
Gap Trading Strategy: How to Trade Gaps and When Gaps Fill
Opening and full gaps, the four classic gap types, how often SPY gaps filled in our count since 2001, and plans for gap fill and gap and go.
- Calculate pivot points
Pivot Points: Formulas, Types and How to Trade Them
Formulas for standard, Fibonacci, Woodie, Camarilla and DeMark pivots, a free calculator, which session counts and a real SPY day.
- Swing trade
Swing Trading: 4 Strategies, Risk and Real Examples
Four swing trading strategies on the daily chart, position size, gap risk and US rules, with two hypothetical SPY pullbacks: one hit its target, one was stopped out.
- Identify market stages
Stage Analysis: Stan Weinstein's Four Market Stages
Stan Weinstein's four stages on the weekly chart, a Stage 2 checklist and two TSMC breakouts: one ran for a year, one gapped through its stop.
- Choose a chart type and timeframe
Trading Charts: Types, Timeframes and How to Read Them
Line, bar, candlestick and Heikin Ashi charts, charts without a time axis and the right timeframe for each trading style, with current EUR/USD, gold and DAX examples.
- Read Kagi charts
Kagi Charts: Reversal Amount, Shoulders and Signals
One line, one reversal amount, thick yang and thin yin: tested on DAX hourly data and compared with Renko and point and figure.
- Screen for growth leaders
CAN SLIM: William O’Neil’s Seven Rules for Growth Stocks
William O'Neil's seven CAN SLIM criteria with thresholds, his selling rules, a free screen with real counts and what the tests really show.
- Read Wyckoff ranges
Wyckoff Method: Accumulation, Distribution and Springs
Accumulation and distribution with phases A to E, springs and upthrusts as optional tests, and two real TSMC ranges read with and without hindsight.
- Trade Darvas boxes
Darvas Box Strategy: Rules, Entries and Stop Losses
The box rules step by step, when the edges become known, where the stop goes, and a mechanical test on TSMC in 2024 with two honest results.
- Count Elliott waves
Elliott Wave Theory: Rules, Patterns and Fibonacci
The five-wave pattern, three hard rules, zigzags, flats and triangles, Fibonacci ratios and a real DAX count, from the first German translator of the standard work.
- Understand Smart Money Concepts
Smart Money Concepts (SMC): What They Are and What Holds Up
The seven SMC building blocks, BOS vs CHoCH vs MSS, one labeled SPY sequence that held, one that failed, and what a chart can and cannot show.
- Understand ICT trading
ICT Trading: Silver Bullet, Killzones and What Holds Up
Michael Huddleston's Inner Circle Trader method: Silver Bullet, Judas Swing, the 2022 model and killzones in New York time, with one SPY setup that worked and one that failed.
- Trade order blocks
Order Blocks: How to Spot, Draw and Trade the Zone
The three conditions behind a valid order block, entry and stop at the zone, two SPY cases from 2026 and a 25-year count where a fixed rule lost money.
- Trade fair value gaps
Fair Value Gap (FVG): How to Spot, Trade and Test It
The three-candle rule, bullish, bearish and inverse FVG, two SPY cases from 2026 and a 25-year count of how often gaps were revisited and traded.
- Trade inverse fair value gaps
Inverse Fair Value Gap (IFVG): Rules, Examples and a Test
When a broken gap counts as inverted, three entry styles, one SPY retest that held, one that failed, and a 25-year test with trend and sweep filters.
- Trade failed breakouts with Turtle Soup
Turtle Soup Trading: Raschke Rules, ICT Version and a Test
Linda Raschke's original rules, Turtle Soup Plus One and the ICT version side by side, two SPY examples and a 25-year test on SPY and QQQ.
- Read a break of structure
Break of Structure (BOS): Rules, CHoCH vs MSS and a Test
Which swing counts, BOS vs CHoCH vs MSS under one stated convention, two SPY breaks that won and lost, and a 25-year test against ordinary days.
- Read a change of character
Change of Character (CHoCH): Rules, BOS vs MSS and Data
The first close against the trend, close versus wick, CHoCH vs BOS vs MSS, two SPY cases and what the trend did next after 287 CHoCHs on SPY and QQQ.
- Read a market structure shift
Market Structure Shift (MSS): Rules, BOS vs CHoCH and Data
MSS as a CHoCH with a sweep and a fair value gap, the comparison with BOS and CHoCH, two 2021 cases and what 14 daily MSS on SPY and QQQ did next.
- Draw supply and demand zones
Supply and Demand Trading: Zones, Rules and Real Data
Base and departure rules, the four base patterns, how zones differ from order blocks and SMC, two SPY cases and a fixed test of 86 zone trades on SPY and QQQ.
- Read liquidity sweeps
Liquidity Sweep: How to Spot It and Trade the Reversal
Sweep or run, buy-side and sell-side liquidity, internal and external targets, SPY reversal, continuation and failed-reversal examples and a 25-year count of a fixed sweep rule.
- Spot bull and bear traps
Bull Trap vs Bear Trap: How to Spot a Trapped Market
What bull traps and bear traps are, the two signs of trapped traders, how to trade the reversal with a defined stop, and two real SPY examples from 2025.
- Interpret volume
Volume Analysis in Trading: How to Read Volume Honestly
What volume counts in stocks, futures, forex and crypto, how to read it against its own average, and our SPY test of high-volume days since 2001.