
Trading Strategies: 7 Approaches and How to Pick the One That Fits


Contents
- The 7 trading strategies in 30 seconds
- What is a trading strategy?
- Which trading strategy suits you?
- Trend following: “the trend is your friend”
- Breakout strategies: using momentum
- Mean reversion strategies: back to the average
- News trading strategies: trading volatility
- Smart money concepts: on the trail of the big players
- Gap trading strategies: trading price gaps
- Crypto arbitrage: using price differences between exchanges
- Why most trading strategies fail in practice
- How do you develop and test your trading strategy?
- Personal conclusion on the best trading strategy
- Frequently asked questions about trading strategies
- About the author
There is no single best trading strategy. There are approaches that suit certain market phases, and traders whose daily routine suits certain approaches. If you bring the two together, you have done the hardest part. The rest is craft: write the rules down, test them and stick to them.
This guide compares seven strategies that are widely used in practice. Each one gets the same treatment: how you spot the setup on the chart, what a concrete version looks like and where the method reliably fails. Each section links to our detailed guide on that approach.
The selection covers different time frames and schools of thought on purpose. It runs from classic trend following to crypto arbitrage. A table at the start shows which approach fits which market phase and which time budget, so you do not have to try seven methods to find that five do not fit your life. This article follows our editorial policy.
The 7 trading strategies in 30 seconds
- Trend following: you trade in the direction of the existing trend and live off a few big winners.
- Breakout: you enter when price breaks out of a range or chart pattern.
- Mean reversion: you bet on a return to the average after price has moved unusually far from it.
- News trading: you trade the volatility around rate decisions and earnings.
- Smart money concepts: you follow the footprints of large players through order blocks and liquidity zones.
- Gap trading: you bet that a price gap closes again.
- Crypto arbitrage: you use price differences of the same coin between two exchanges.
What is a trading strategy?
A trading strategy is a fixed set of rules that decides before the trade when you enter, where your stop is, when you exit and how large the position is. It makes your decisions repeatable and therefore testable.
The difference from a trading idea is commitment. An idea says: the S&P 500 looks weak. A strategy says at which price you go short, where the stop sits and when you close the position. Only then can you tell afterwards whether the approach does not work or whether only a single trade went wrong.
Every robust set of rules answers four questions. If one is missing, you are trading on gut feeling with a few rules around it.
- Entry: which signal triggers the trade? A crossover of two moving averages, a break above the prior day’s high, a candlestick pattern. The signal must be described so that two traders recognize it identically.
- Exit at a loss: where is the stop loss, the level at which you close the position without discussion? It is fixed before the entry, not after.
- Exit at a profit: a fixed price target, a trailing stop or a time exit. If you leave this open, you regularly turn winners into break-even trades.
- Position size: how much capital do you risk per trade? The distance to the stop sets the size, not your feeling about the setup; our guide to position sizing shows the math.
A fifth point decides the hit rate but rarely appears in the rules: the market environment. A trend following strategy loses money in a sideways market without anything being wrong with its rules. That is why every strategy needs a statement of the market phase in which it is used at all.
An indicator is not yet a strategy. The RSI shows you a number between 0 and 100, nothing more. It only becomes a strategy once you decide which value under which conditions triggers a trade and where the stop is. Otherwise the same number can push two traders in opposite directions.
Which trading strategy suits you?
The question about the best strategy leads you astray. The right strategy is the one that fits your time budget, your temperament and the market you can actually watch. An approach with twenty signals a day is of little use if you sit in an office until 6 pm.
Two criteria sort out the most in practice. One is the market phase in which an approach works at all, the other the holding period it asks of you. The table is ordered by these two.
| Strategy | Market phase | Holding period |
|---|---|---|
| Trend following | Clear trend | Days to months |
| Breakout | Break out of a range | Minutes to days |
| Mean reversion | Sideways market | Hours to days |
| News trading | Scheduled release days | Minutes to hours |
| Smart money concepts | Liquid markets | Hours to days |
| Gap trading | After a price gap | Minutes to hours |
| Crypto arbitrage | Any phase | Seconds to minutes |
The seven strategies at a glance: market phase and holding period decide first.
Sort by your time budget first. If you only open the chart in the evening, you end up with swing trading on the daily or weekly chart, so with trend following and mean reversion. If your mornings are free, you can trade breakouts and gaps around the open.
Then comes temperament. Trend following demands patience, news trading demands quick reactions. Both can be learned, but trading against your own nature costs nerves and money. If three losses in a row make you restless, a method with many small wins suits you better than one that lives off a few big ones.
Two points apply whatever you choose. First, most of these approaches can be traded with stocks, futures or CFDs, so the choice of instrument often comes later; crypto arbitrage is the exception, because it needs crypto balances on two exchanges. Second, each of them needs clean risk management, or one bad run is enough to knock the strategy out of the race.
If you are just starting, this article is a map, not a starting point. For beginners, one simple method makes more sense than seven to choose from. Our guide to day trading strategies shows which one can work as a first method, and our guide on how to learn trading covers the first steps.
Trend following: “the trend is your friend”
Trend following is one of the oldest and best-known approaches. The principle fits in one sentence: you trade only in the direction of the existing trend. Behind it lies the assumption that established moves continue more often than they reverse. Our guide to trend following covers the tools and a test on S&P 500 data since 1950.
How do you recognize a trend?
Three ways to define a trend have become standard. The first is market structure: in an uptrend you look for higher highs and higher lows, in a downtrend for lower highs and lower lows. It needs no indicator and is therefore the most robust approach.
The second way uses indicators. If price is above the 200-day moving average, the bigger trend counts as up, below it as down. The advantage is clarity; the price is lag, because a moving average only reacts once the move is already under way.
The third way is trendlines, plus a strength filter. A trendline connects successive lows in an uptrend. The ADX measures trend strength: values above 25 are commonly read as a tradable trend, lower values as a sideways phase. In practice, most traders stick to market structure plus one moving average.
What does a trend following strategy look like?
The best-known example is the golden cross. The 50-day moving average crosses the 200-day average from below, which counts as a buy signal. The entry is clear, and the stop usually sits below the last swing low. Our golden cross guide shows the exact rules and their track record.
For stocks, a second version works on the weekly chart: Stan Weinstein’s four-stage approach. It only buys once a stock moves from its base into the advancing stage, and so filters out many of the false signals short-term trend following produces. Our guide to stage analysis explains the four stages.
Trend following delivers few but large winners. If you trade it, you should know the downside as well as the upside.
Pros of trend following
- Clear principle: the rules fit in a few sentences and are easy for beginners to follow.
- Large winners possible: in strong trends a single position can run for weeks and pay for many small losses.
- Works on every time frame: from the 5-minute to the weekly chart the logic stays the same; only the holding period changes.
Cons of trend following
- Useless in a sideways market: without a trend the approach produces a series of small losses, because each signal reverses soon after.
- Late entries: by the time the trend is confirmed, part of the move is already behind you.
- Low hit rate: more losing than winning trades are normal. If you cannot stand that, you quit during the losing run and miss exactly the trade that saves the year.
Trend followers do not want to buy the high. That is why many wait for the pullback and enter there; our guide to pullback trading shows concrete setups.
Breakout strategies: using momentum
Every breakout strategy rests on the same observation: a break through an important price level often triggers a strong push in the same direction. The reason is mechanical. Above a widely watched high sit buy orders and the stop orders of short sellers, which are all triggered at once when the level breaks.
How do you spot promising breakouts?
The starting point is always a clearly defined resistance or support zone. The more often a level has been tested without breaking, the more orders collect behind it. Trendlines and clear chart patterns also work as triggers.
The cleanest template is the triangle. Entry, stop and target can be read straight from the triangle pattern. Pivot points calculated from the prior day also work as objective levels. Both share one advantage: the level is fixed before the trading day begins.
A sharp rise in volume at the moment of the breakout makes it more likely that the move holds. If volume stays away, the breakout often ends as a false breakout, a fakeout in trader slang. The difference comes down to whether enough buyers follow to hold the new price.
What does a breakout strategy look like?
The most common version is the opening range breakout. You mark the high and low of the first 30 minutes after the open, for example in stocks or futures. If price breaks above the upper level, you go long; below the lower level, short. The stop sits on the other side of the range. Our guide to the opening range breakout covers the variants, and our breakout trading guide the general rules.
Breakouts give clear entries but require tolerance for false signals. That trade-off shapes both lists below: clear levels on one side, frequent fakeouts on the other.
Pros of breakout strategies
- Clear entry levels: the price level is fixed before the trade, so you do not have to decide anything at the moment of the signal.
- Works across markets: stocks, indices, currencies and crypto follow the same breakout logic.
- Fast feedback: a breakout usually works within a few candles or not at all, so you rarely sit in unclear positions for long.
Cons of breakout strategies
- High fakeout rate: especially in quiet markets, prices break out briefly and fall straight back into the old range.
- Often a low hit rate: the approach lives on the few breakouts that run paying for the many small failures.
- Slippage in fast moves: right at the breakout the spread is widest, and the fill lands noticeably beyond the planned level.
Mean reversion strategies: back to the average
Mean reversion strategies are the counterpart to trend following. They bet that prices return toward their average after an unusually strong move, provided there is no fundamental reason for the move. Instead of chasing the trend, you deliberately trade against it; our guide to mean reversion trading tests two such rules on SPY since 1993.
How do you spot promising mean reversion setups?
The setup starts with an overextension. Price has moved well away from its usual level without news or earnings explaining it. Without a fundamental driver, the chance of a countermove rises. Three tools help to measure it.
- Bollinger Bands: the Bollinger Bands wrap around a moving average. If price touches or leaves the outer band, the market counts as stretched in the short term.
- RSI: the Relative Strength Index measures the strength of the latest move. Readings above 70 count as overbought, below 30 as oversold.
- Moving averages: if price is far from its 50-day average, that is a simple hint at a coming correction; our guide to moving averages shows the settings.
The market environment remains decisive. In a strong bull market a price can look overbought for months and still keep rising. That is why mean reversion works mainly in sideways markets, not in trending phases. If you want a structured way to trade inside a range, our guide to range trading shows the rules.
Mean reversion rewards patience in a quiet market and punishes it in a trend. Both sides show up clearly in the pros and cons.
Pros of mean reversion
- Strong in sideways markets: in exactly the phases where trend followers only get false signals, this approach delivers its best trades.
- High hit rate: most overextensions correct at least partly, which makes the equity curve smoother.
- Clearly measurable entries: a band touch or an RSI threshold is a clear trigger with no room for interpretation.
Cons of mean reversion
- Dangerous in a strong trend: you trade against the running move. Without a stop loss, a single trade can cost the gains of many weeks.
- Small wins, large losses: the reward-to-risk ratio is unfavorable by design, because the target is close and the stop is far away.
- False signals in high volatility: in nervous markets the outer band is touched constantly without a real overextension.
News trading strategies: trading volatility
News trading is the only approach in this list that puts fundamental data first. It trades scheduled events that move the market sharply: Fed rate decisions, earnings, jobs and inflation data. The appeal is that the move happens in minutes rather than weeks.
How do you spot promising news trades?
It is not the news that moves the price, but the surprise against expectations. An inflation rate of 2.4 percent changes nothing if exactly that was expected. If it comes in at 2.9 percent instead, the market jumps. That is why every news trade starts with the consensus estimate; our guide to the US CPI report shows how this works for inflation data.
The dates themselves are in the economic calendar. Our guide to the economic calendar shows how to read forecast, prior and actual values. If you need the numbers in real time, you need a fast news feed, because standard financial portals report with a noticeable delay. In a trade that is decided in 90 seconds, every delay costs money.
The most important part happens before the release. If you write down beforehand what you will do on a positive and on a negative surprise, you do not have to think at the moment of publication. Without this plan, news trading becomes guessing under time pressure.
What does a news trading strategy look like?
In practice, most news traders combine two layers. Fundamental analysis provides the direction, technical analysis the timing. If you use only one of the two, you trade either blind or too late.
- Direction from the data: decide in advance which surprise you would trade in which direction. That depends on the release, the instrument and the expectations: a hotter inflation number, for example, is not a reason to buy stocks, because it raises the risk of higher rates. You make this assignment before the release, not after.
- Entry from the chart: instead of jumping into the first candle, you wait for a signal, such as a break of the high of the release candle. That filters out the typical false reaction in the first seconds.
- Stop outside the range: the stop belongs beyond the extreme of the release candle, or normal swings knock you out at once.
News trading suits traders who like quick decisions. For everyone else it is the most demanding method in this overview, as the cons below show.
Pros of news trading
- Scheduled dates: rate decisions and earnings are known weeks ahead, so you can prepare.
- Large moves in a short time: a single release can deliver the range of several quiet sessions.
- Independent of the larger trend: the approach also works when chart patterns offer nothing.
Cons of news trading
- Extreme volatility: in the first seconds spreads widen sharply, and stops are filled at much worse prices.
- False reactions are common: markets often reverse fully after the first move, and if you enter at once you often end up on the wrong side.
- High stress: decisions under time pressure are error-prone, especially when a position is already in the red.
Smart money concepts: on the trail of the big players
Smart money concepts, SMC for short, start from a simple assumption: banks, hedge funds and other large players move the market and leave traces on the chart. If you can read these traces, you trade with the big money instead of against it. Whether that assumption holds is disputed among traders, but the concepts themselves are clearly defined in our guide to smart money concepts.
How do you spot smart money in the market?
The core idea is liquidity. Large orders need counterparties, and they find them where many stop orders sit: just below obvious support and just above obvious resistance. SMC treats these zones as targets, not as protection.
The best-known pattern is the stop hunt. Price dips briefly below support, triggers the stops there and then turns up. For one trader it is an annoying false breakout; for the SMC trader it is the entry signal. Our guide to the liquidity sweep shows the pattern on real charts.
The central entry signal is the market structure shift, MSS for short, usually right after such a grab for liquidity. Add order blocks, areas where a strong move started earlier. If price returns to an order block later, it counts as a possible entry zone.
SMC is not as new as its terms sound. Next to SMC, the Wyckoff method is a long-established way to follow institutional money, and it has described the same mechanics under other names since the 1930s.
SMC offers a coherent story but takes a lot of practice in reading charts. The pros and cons below show where that practice pays off and where it does not.
Pros of smart money concepts
- Explains false breakouts: once you understand why prices dip below support, you see many past losing trades differently.
- Clearly defined zones: order blocks and liquidity zones can be drawn and give concrete entry and stop levels.
- Builds on proven concepts: market structure, supply and demand are not SMC inventions but have been documented for decades.
Cons of smart money concepts
- Much room for interpretation: which order block is the valid one is often answered differently by two traders, which makes backtesting hard.
- A jungle of terms: the many labels hide that some of them are well-known concepts under new names.
- No solid success statistics: there is no independent study of whether SMC rules are profitable on average.
Gap trading strategies: trading price gaps
Gap trading strategies use an observation: many price gaps between two trading sessions are filled later on. Such gaps appear above all in stock indices such as the S&P 500 or the Nasdaq, but also regularly in single stocks. Our guide to gap trading covers the gap types in detail.
How do you spot gaps on the chart?
A gap appears when a session opens at a different price from the prior close. In US stocks, the time between the close at 4:00 pm New York time and the next morning’s open at 9:30 am leaves enough room for news that shifts the price. Our stock exchange hours guide lists the sessions.
Large gaps open especially over the weekend or after earnings. Then the key question is whether the gap closes or whether the market keeps running in the same direction. The answer depends on whether real news is behind it or only thin volume outside regular hours.
How often gaps fill in a given market can be measured. Statistics tools and your own backtests give these frequencies per instrument. Without these numbers you trade an assumption, not a probability.
What does a gap trading strategy look like?
The most common version is the gap fill strategy. It bets that price returns to the prior close during the session. The prior close is also the target, which makes the trade unusually clear.
- Short after a gap up: if the market opens well above the prior close, you bet on the fall back to exactly that price.
- Long after a gap down: if the market opens lower, the trade runs toward the return to the old close.
Gaps give clear targets and still no certainty. Both sides are in the pros and cons below.
Pros of gap trading
- Regular opportunities: in stock markets, gaps appear almost every week, so the approach rarely runs out of signals.
- Target fixed from the start: the prior close is an objective level with nothing to debate.
- Good for short-term trading: most gap trades are closed within one session, so there is no overnight risk.
Cons of gap trading
- Not every gap fills: the large, news-driven gaps in particular often stay open and keep running.
- You trade against the impulse: the gap fill is at heart a mean reversion trade and inherits its risk profile.
- Narrow time window: the move usually happens in the first hour of trading. If you are not at your screen then, you cannot trade the strategy.
Crypto arbitrage: using price differences between exchanges
In crypto arbitrage you use the fact that the same cryptocurrency trades at slightly different prices on different exchanges. If bitcoin is a little cheaper on exchange A than on exchange B, you buy there and sell here at the same time. The difference is your gross profit before fees.
How do you spot crypto arbitrage setups?
The crypto market is still fragmented. Hundreds of exchanges trade the same coins without a central price. That fragmentation creates the price differences from which arbitrage chances arise. For the largest coins the spreads are small; for smaller altcoins they are larger, but liquidity is often missing.
- Real-time price overviews: price aggregators show the prices of several exchanges side by side and make differences visible at once.
- Automated scanners: programs compare the order books of many exchanges in fractions of a second. By hand, the edge is usually gone before your order is in.
Algo and quant traders like this approach because it can be automated almost completely. A program compares data around the clock and reacts the moment a tradable difference opens; our guide to trading bots shows the options.
What could a crypto arbitrage strategy look like?
The principle is trivial, the execution is not. Four points decide whether the profit on paper becomes a real one, and each can turn a winning trade into a loss.
- Speed: price differences often last only seconds. An arbitrage bot executes both sides of the trade at the same time.
- Fees: buying, selling and any transfers between exchanges each cost money. If the costs exceed the price difference, the trade is dead on paper.
- Liquidity: in thin order books your order runs through several price levels, and the spread eats the margin.
- Technical risks: network delays, stuck blockchain transfers or a withdrawal freeze can leave the position open on one side.
Arbitrage sounds like risk-free money and is not. Market risk is replaced by execution risk and platform risk.
Pros of crypto arbitrage
- Independent of market direction: whether bitcoin rises or falls does not matter, because you only trade the difference.
- Very short holding period: the position is usually closed within seconds, so there is hardly any overnight risk.
- Fully automatable: the approach needs no chart reading and suits rule-based systems.
Cons of crypto arbitrage
- Capital must sit twice: you need balances on both exchanges at once, or simultaneous execution does not work.
- Fees eat the margin: with spreads in the tenths of a percent, the cost structure decides profit or loss.
- Platform risk: your capital sits with two exchanges. Withdrawal freezes and outages are not a theoretical danger in crypto.
Why most trading strategies fail in practice
The rules are often not the only problem. Each of the seven approaches can work in the right environment, but none works in every one. Much of what goes wrong in practice has to do with execution, and for one group of traders there are solid numbers on that.
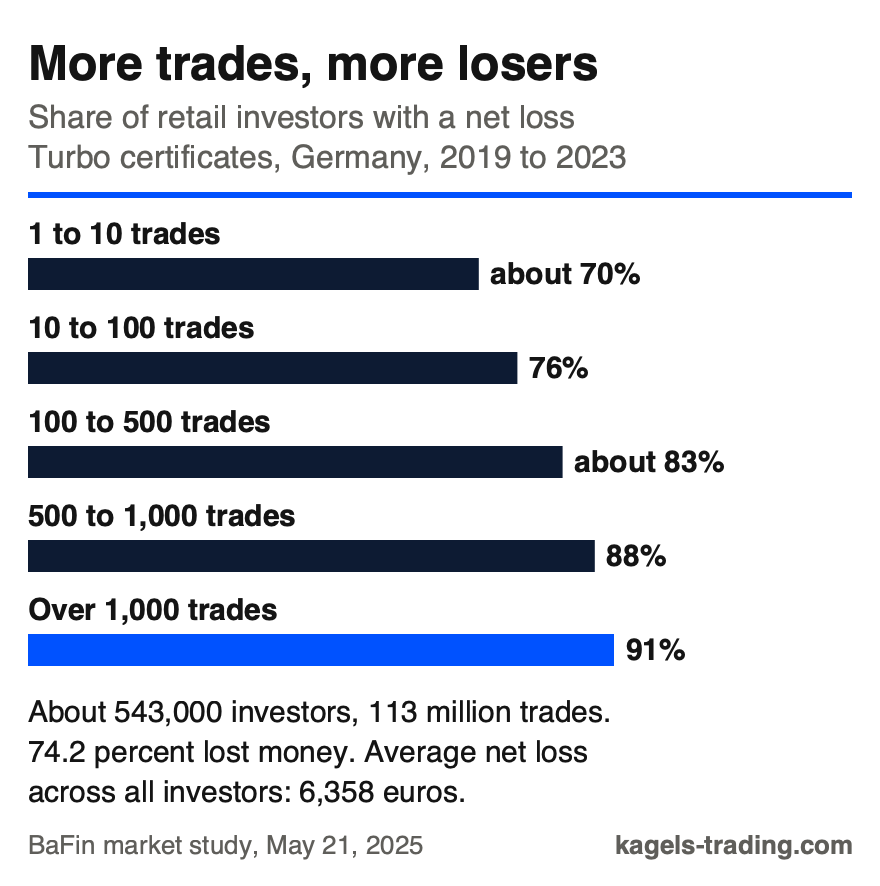
Germany’s financial regulator BaFin analyzed about 113 million transactions in turbo certificates by about 543,000 German retail investors from 2019 to 2023. According to its market study of May 21, 2025, 74.2 percent of them lost money. Across all investors, the average net loss was 6,358 euros. The study looks at retail investors in leveraged turbo certificates, not at traders with a tested set of rules, so read it as a warning about this environment, not as a verdict on any strategy.
 Click to enlarge
The breakdown by trading activity matters more than the headline figure. Among investors with 1 to 10 transactions, about 70 percent lost; among those with more than 1,000 transactions, 91 percent. For these turbo certificate traders, BaFin concludes that they did not win more often as they gained experience and that apparently no learning process took place. The study does not test strategies, but the pattern is a useful warning: more trading did not mean better results. If you are torn between two approaches, consider the one with fewer signals.
Four mistakes come up again and again. None of them is about the rules themselves; all are about execution.
- No risk management: the strategy defines the entry but not the position size. A single oversized trade can then wipe out the results of months.
- Switching too early: after five losses in a row, every method looks broken. If trades are independent and the hit rate stays at 40 percent, the chance of five losses in a given five trades is about 7.8 percent, and the chance of at least one such run somewhere in a hundred trades is about 98 percent.
- Backtests with too few trades: twenty test trades say nothing. Below roughly a hundred trades, any result is mostly chance.
- A strategy that does not fit your day: an approach that needs the 9:30 am open fails with a full-time job, however well it is tested.
The way out is unspectacular. One strategy, one market, a fixed risk per trade, documented over at least a hundred trades. Whether the numbers add up to a measurable trading edge is decided by the expected value, not by the hit rate.
How do you develop and test your trading strategy?
Whether an approach suits you only shows in testing. You need neither a budget nor programming skills. The replay tool in TradingView plays historical prices bar by bar, so you can work through your rules without knowing the outcome; our guide to TradingView backtesting shows how.
If you want to automate the test instead of clicking bar by bar, you need code from here on. The process stays the same: define the rule, measure it on historical data, read the result honestly. A program only does the counting, which turns a handful of checked situations into several thousand. Our guide to backtesting explains the method and its traps.
Once the backtest holds up, the live test follows on a demo account. Almost all brokers offer such practice accounts for free. Only here does it show whether you keep to your own rules with live prices, because in hindsight every setup looks obvious.
Record both test phases in writing. Without logged trades you will not know afterwards whether the strategy was weak or your discipline. Our guide to the trading journal shows what belongs in each entry.
Once your strategy has passed the test, you can let it run automatically. Bots execute rules without hesitation, but they also execute bad rules without hesitation, so automation only comes after the test.
Personal conclusion on the best trading strategy
There is no holy grail. Each of the seven approaches has an environment in which it works and one in which it reliably costs money. The skill lies less in finding the best method than in sticking with a suitable one long enough to have a verdict at all.
Bjarne’s advice after years of systematic trading: start with one strategy in one market and measure it over at least a hundred trades. You will soon notice whether you prefer a high hit rate with a small reward-to-risk ratio or the reverse. Both work, but only one fits your nerves. Why a hundred trades is the lower limit is shown in our guide to the profit factor.
The same rule applies to everything here: test first, then risk capital. A strategy you have not tested is an idea, and ideas are cheap; tested rules are what you can trade.
Frequently asked questions about trading strategies
Which trading strategy is the best?
The best strategy is the one that fits your time budget and the current market phase. Trend following works in clear trends, mean reversion in sideways markets, news trading on release days. A method that works equally well in every environment does not exist.
What makes a good trading strategy?
A good strategy answers four questions before the trade: when do I enter, where is the stop, when do I take profits and how large is the position? It also states the market phase in which it is used. Only then can it be tested.
Do I need to master all trading strategies to be profitable?
No, quite the opposite. Really mastering one or two strategies brings more than knowing seven superficially. Too many approaches at once lengthen the learning curve and make evaluation impossible, because each method collects too few trades.
How long does it take to become profitable with a trading strategy?
That varies a lot and usually takes longer than expected. Months to years are realistic, because you need at least a hundred trades before the results mean anything. Discipline and a clean trading journal shorten the way noticeably.
Can I trade several trading strategies at the same time?
In theory yes, in practice it rarely makes sense. Each strategy needs its own watchlist, its own analysis and its own evaluation. If you are just starting, focus on one approach until you know its key figures.
Which books help to understand trading strategies better?
The classic for beginners is John Murphy’s Technical Analysis of the Financial Markets. It explains the basics of chart analysis and gives you the vocabulary for all the approaches here; see our review of the book. More titles are in our list of trading books for every level.
This English edition is based on our German edition on kagels-trading.de and has been adapted for international readers.
More Chart Techniques guides
- Draw key levels
Support and Resistance: How to Draw and Use Key Levels
Where useful levels come from, how to draw zones with a stated rule and how to turn a level into a trade plan.
- Read price action
Price Action Trading: How to Read Charts Without Indicators
Market structure, key zones and three bar patterns, with a core setup and a real SPY example where the signal failed.
- Read candlestick charts
How to Read Candlestick Charts: Body, Wicks and Context
Open, high, low and close in one candle, body and wicks, two real Gold candles read step by step and how often patterns really occur.
- Smooth candles with Heikin Ashi
Heikin Ashi Candles: Formula, Signals and What the Smoothing Costs
The Heikin Ashi formula, how to read colors and wicks, a year of SPY data with a third fewer color changes, and why orders belong on the real chart.
- Know candlestick patterns
Candlestick Patterns: 10 to Know, Tested on Real Data
Ten patterns with rules and a cheat sheet, counted on DAX, S&P 500, EUR/USD and Gold since 2014: most are rare, none is a signal on its own.
- Trade the hammer candle
Hammer Candlestick: Spot It, Trade It, Know Its Limits
Three features, the difference to inverted hammer and hanging man, entry and stop, and how rarely the hammer appeared in four markets since 2014.
- Spot a morning star
Morning Star Candlestick: Rules, Real Cases, Limits
Three measurable rules, every morning and evening star in four markets since 2014, and two real cases: one reached its target, one hit its stop.
- Spot a topping tail
Topping Tail Candlestick: Rules, Silver Example and Limits
Six measurable rules for the bearish rejection candle, a silver candle from January 2026 checked step by step, the difference from the shooting star and how to trade it with a stop.
- Combine timeframes
Multi-Timeframe Analysis: A Weekly and Daily Workflow
How to combine the weekly chart for context and the daily chart for entry under one stated rule, with a documented SPY case from June 2025.
- Trade pullbacks
Pullback Trading: Entries, Stops and Failed Setups
Pullback or reversal, limit against confirmation entry, and one fixed rule set on three real QQQ cases: a target, a stop and a cancelled setup.
- Trade sideways ranges
Range Trading: Boundaries, Orders and Two Documented Fades
A 14-session rule to draw horizontal boundaries, three order-type variants and two Alpaca-verified SPY fades, one that reached the target and one that was stopped out.
- Trade mean reversion
Mean Reversion Trading: Rules, Indicators and a 33-Year SPY Test
How mean reversion works, five indicators, pairs trading and our test of two RSI rules on SPY since 1993: 78 to 80 percent winners, but rarely invested.
- Read a consolidation
Consolidation in Trading: What the Range Tells You
What a consolidation is, why 25 years of index data showed no stable direction edge from narrow ranges or the prior trend, and two DAX breakouts from 2026.
- Read chart formations
Chart Patterns: Reversals, Continuations and Failures
Reversal, continuation and bilateral formations with the measured-move convention per pattern and two documented SPY rectangle cases.
- Trade rising and falling wedges
Rising and Falling Wedge Patterns: How to Trade Them
How to spot both wedges, where to set entry, stop and target, and why Bulkowski ranks the rising wedge with a downward breakout last of 36 patterns.
- Trade triangle breakouts
Triangle Pattern: Ascending, Descending and Symmetrical
Ascending, descending and symmetrical triangles: entry, stop and target, three chart examples and what Bulkowski's data say about reliability.
- Trade the cup and handle
Cup and Handle Pattern: Rules, Targets and Real Hit Rates
Rounded cup, short handle: entry, stop and target, why volume matters, and Bulkowski's numbers, 61 percent reach the target but 47 percent fall back after the breakout.
- Trade breakouts
Breakout Trading Strategy: Entries and False Breakouts
How often breakouts fell back into the range in our count of 1,472, and how to plan entry, stop and position size.
- Draw and trade trendlines
Trendline Trading: How to Draw Trendlines and Trade Them
How to draw trendlines with a fixed rule, four strategies for bounces, breaks and retests, and a real SPY line break without a lasting reversal.
- Draw a pitchfork channel
Andrews Pitchfork: How to Draw It, Trade It and Test It
Three pivots, a median line and two parallels, Schiff variants, a trade plan and how often price reached the median line in 746 cases.
- Use Fibonacci levels
Fibonacci Retracement Levels: How to Draw and Trade Them
How to calculate and draw retracement levels, trade pullbacks with confluence and a stop at the structure, and what a ten-year test says about the levels.
- Set Fibonacci targets
Fibonacci Extension: Levels, How to Draw It and Calculator
Three-point extension targets from the end of a pullback, why they differ from levels beyond 100%, a free calculator and three SPY swings, one without a single target reached.
- Trade gaps
Gap Trading Strategy: How to Trade Gaps and When Gaps Fill
Opening and full gaps, the four classic gap types, how often SPY gaps filled in our count since 2001, and plans for gap fill and gap and go.
- Calculate pivot points
Pivot Points: Formulas, Types and How to Trade Them
Formulas for standard, Fibonacci, Woodie, Camarilla and DeMark pivots, a free calculator, which session counts and a real SPY day.
- Swing trade
Swing Trading: 4 Strategies, Risk and Real Examples
Four swing trading strategies on the daily chart, position size, gap risk and US rules, with two hypothetical SPY pullbacks: one hit its target, one was stopped out.
- Identify market stages
Stage Analysis: Stan Weinstein's Four Market Stages
Stan Weinstein's four stages on the weekly chart, a Stage 2 checklist and two TSMC breakouts: one ran for a year, one gapped through its stop.
- Trade momentum
Momentum Trading: How It Works, What the Data Shows and Where It Fails
Momentum from candles to stock rankings, what the US momentum factor made since 1927, its 2009 crash, a three-step rule set and exits.
- Choose a chart type and timeframe
Trading Charts: Types, Timeframes and How to Read Them
Line, bar, candlestick and Heikin Ashi charts, charts without a time axis and the right timeframe for each trading style, with current EUR/USD, gold and DAX examples.
- Read Kagi charts
Kagi Charts: Reversal Amount, Shoulders and Signals
One line, one reversal amount, thick yang and thin yin: tested on DAX hourly data and compared with Renko and point and figure.
- Screen for growth leaders
CAN SLIM: William O’Neil’s Seven Rules for Growth Stocks
William O'Neil's seven CAN SLIM criteria with thresholds, his selling rules, a free screen with real counts and what the tests really show.
- Read Wyckoff ranges
Wyckoff Method: Accumulation, Distribution and Springs
Accumulation and distribution with phases A to E, springs and upthrusts as optional tests, and two real TSMC ranges read with and without hindsight.
- Trade Darvas boxes
Darvas Box Strategy: Rules, Entries and Stop Losses
The box rules step by step, when the edges become known, where the stop goes, and a mechanical test on TSMC in 2024 with two honest results.
- Count Elliott waves
Elliott Wave Theory: Rules, Patterns and Fibonacci
The five-wave pattern, three hard rules, zigzags, flats and triangles, Fibonacci ratios and a real DAX count, from the first German translator of the standard work.
- Understand Smart Money Concepts
Smart Money Concepts (SMC): What They Are and What Holds Up
The seven SMC building blocks, BOS vs CHoCH vs MSS, one labeled SPY sequence that held, one that failed, and what a chart can and cannot show.
- Understand ICT trading
ICT Trading: Silver Bullet, Killzones and What Holds Up
Michael Huddleston's Inner Circle Trader method: Silver Bullet, Judas Swing, the 2022 model and killzones in New York time, with one SPY setup that worked and one that failed.
- Trade order blocks
Order Blocks: How to Spot, Draw and Trade the Zone
The three conditions behind a valid order block, entry and stop at the zone, two SPY cases from 2026 and a 25-year count where a fixed rule lost money.
- Trade fair value gaps
Fair Value Gap (FVG): How to Spot, Trade and Test It
The three-candle rule, bullish, bearish and inverse FVG, two SPY cases from 2026 and a 25-year count of how often gaps were revisited and traded.
- Trade inverse fair value gaps
Inverse Fair Value Gap (IFVG): Rules, Examples and a Test
When a broken gap counts as inverted, three entry styles, one SPY retest that held, one that failed, and a 25-year test with trend and sweep filters.
- Trade failed breakouts with Turtle Soup
Turtle Soup Trading: Raschke Rules, ICT Version and a Test
Linda Raschke's original rules, Turtle Soup Plus One and the ICT version side by side, two SPY examples and a 25-year test on SPY and QQQ.
- Read a break of structure
Break of Structure (BOS): Rules, CHoCH vs MSS and a Test
Which swing counts, BOS vs CHoCH vs MSS under one stated convention, two SPY breaks that won and lost, and a 25-year test against ordinary days.
- Read a change of character
Change of Character (CHoCH): Rules, BOS vs MSS and Data
The first close against the trend, close versus wick, CHoCH vs BOS vs MSS, two SPY cases and what the trend did next after 287 CHoCHs on SPY and QQQ.
- Read a market structure shift
Market Structure Shift (MSS): Rules, BOS vs CHoCH and Data
MSS as a CHoCH with a sweep and a fair value gap, the comparison with BOS and CHoCH, two 2021 cases and what 14 daily MSS on SPY and QQQ did next.
- Draw supply and demand zones
Supply and Demand Trading: Zones, Rules and Real Data
Base and departure rules, the four base patterns, how zones differ from order blocks and SMC, two SPY cases and a fixed test of 86 zone trades on SPY and QQQ.
- Read liquidity sweeps
Liquidity Sweep: How to Spot It and Trade the Reversal
Sweep or run, buy-side and sell-side liquidity, internal and external targets, SPY reversal, continuation and failed-reversal examples and a 25-year count of a fixed sweep rule.
- Spot bull and bear traps
Bull Trap vs Bear Trap: How to Spot a Trapped Market
What bull traps and bear traps are, the two signs of trapped traders, how to trade the reversal with a defined stop, and two real SPY examples from 2025.
- Learn the Turtle rules
Turtle Trading: The Original Rules of Richard Dennis
The key original Turtle trading rules: entries, position size with N, the 2N stop, adding units and the exits.
- Follow trends with rules
Trend Following Strategies: Rules, Tools and a 76-Year Test
How to recognize a trend, the main tools, seven common mistakes and what 224 trades of a 200-day filter on the S&P 500 since 1950 showed: 43 percent winners.