
Smart Money Concepts (SMC): What They Are and What Holds Up


Contents
- Smart Money Concepts in 30 seconds
- What are Smart Money Concepts?
- The seven building blocks: a quick map
- BOS, CHoCH and MSS: where the labels differ
- One sequence on a real chart: SPY in May 2026
- When the same sequence fails: SPY in October 2026
- How to test an SMC setup step by step
- SMC indicators: they draw, they do not decide
- Is SMC profitable? What we can and cannot show
- Common SMC mistakes
- SMC vs price action: same chart, different story
- Pros and cons of SMC
- Conclusion: useful map, unproven explanation
- Frequently asked questions about Smart Money Concepts
- About the author
On YouTube and in trading forums, few charts now come without Smart Money Concepts. The promise is attractive: if you know where banks and funds place their orders, you trade with them instead of against them. The labels are everywhere, from order blocks to liquidity sweeps, and they make a chart look decoded.
Look closer and SMC is less new than its marketing suggests. Many of its parts are older ideas under fresh names: supply and demand, momentum and stops beyond obvious levels. That does not make the approach useless. It changes how you should use it. This guide explains what SMC means, walks through its seven building blocks, follows one SPY sequence that held and one that failed, and separates what a chart can show from what it cannot.
Smart Money Concepts in 30 seconds
- Meaning: SMC is a way of reading charts that infers where large traders may have placed orders, then looks for entries at those zones.
- Building blocks: market structure, order blocks, displacement, fair value gaps, liquidity, equal highs and lows, and premium and discount.
- Typical sequence: a sweep of a level, a fast move, a structure break and a return to a zone.
- Labels: BOS, CHoCH and MSS are not used the same way by every teacher. Write down your own definitions.
- Evidence: we know of no independent record showing that SMC as a whole beats clean price action. A chart shows prices, not who traded them.
What are Smart Money Concepts?
Smart Money Concepts (SMC) are a chart-reading approach that infers from price action where large market participants, such as banks, funds and market makers, may have placed orders, and that looks for entries at those zones.
The core assumption is about counterparties. A large trader cannot fill a big position at once without moving the price, so the trader needs enough orders on the other side. In the SMC reading, price therefore tends to run into areas where many stops and pending orders are expected. That is the theory. SMC tries to mark those areas in advance on a plain price chart.
At its heart, SMC is a reading of price action with its own vocabulary. If you already work with price action and support and resistance, you will recognize most of the building blocks. Much of the teaching material uses forex charts, but the same labels can be drawn on any market with a chart. Being able to draw them says nothing yet about whether they work there.
Who counts as smart money?
In SMC, smart money usually means institutions with large capital and professional infrastructure. Banks, hedge funds, asset managers and market makers are the usual examples. Some sources add private equity firms, very wealthy investors or corporate insiders, so the term is looser than it sounds.
Large does not mean right. Institutions lose money too, and they trade for reasons a chart does not show. A fund selling to hedge a portfolio and a fund betting on lower prices can leave the same mark on a chart. The chart shows the move, not the intent behind it.
Where the idea comes from
Much of today’s SMC vocabulary is associated with Michael Huddleston. He teaches online as the Inner Circle Trader (ICT), and many of the terms in SMC videos spread through his lessons. Other coaches and indicator makers have since built their own versions, so definitions now vary.
The basic idea is much older than the name. In the 1930s, Richard Wyckoff described the Composite Man, an imagined large operator whose traces a trader can follow through price and volume. If you know the Wyckoff method, a lot of SMC will look like a modern translation. Wyckoff’s spring is close to what SMC calls a sweep.
What the chart can and cannot show
A chart shows the sequence of prices, not the people behind them. Above a prior high, triggered buy stops add buying. Below a prior low, triggered sell stops add selling. In the SMC reading, that flow gives a large trader on the other side something to trade against: a large seller above a high, a large buyer below a low.
That mechanism is plausible, but a single candle cannot confirm it. For currency markets, a New York Fed study by Carol Osler (Staff Report 150, 2002) documents that stop-loss orders cluster at certain levels and can speed up moves there. Open, high, low and close data still do not say which stops triggered or whether any did. Even the most detailed CME futures feed, Market by Order, contains no customer identifiable information and no firm IDs, according to the CME. So every statement about institutional intent in this guide is a hypothesis.
The seven building blocks: a quick map
Every SMC strategy is built from the same parts, but you do not need all of them at once. The next sections explain each one briefly and link to our full guide where we have one. The graphic shows how most of them are meant to fit together in a single sequence.
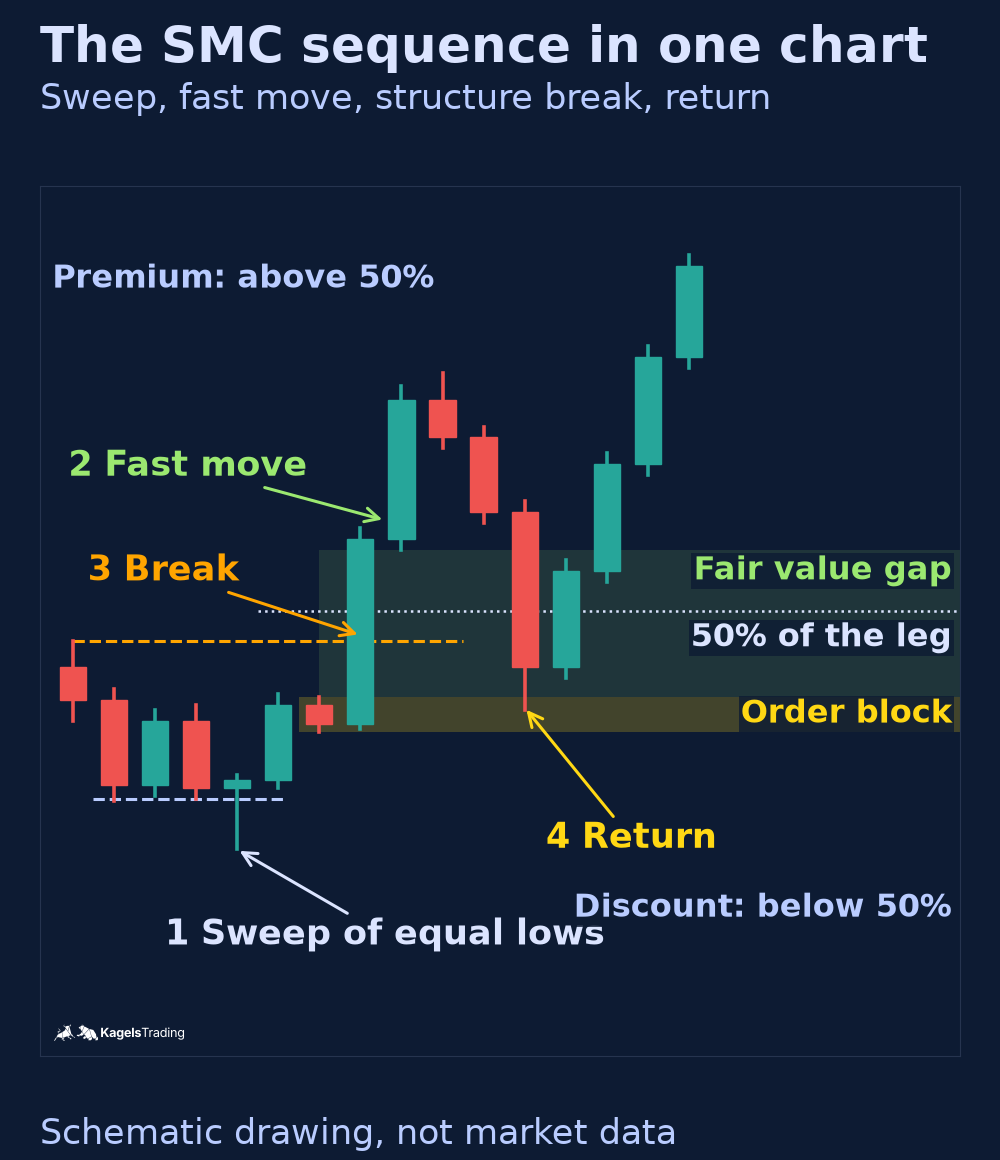 Click to enlarge
Source: Kagels Trading, own drawing.
1. Market structure: BOS and CHoCH
Market structure is the sequence of highs and lows that shows whether a market is rising, falling or moving sideways. Higher highs and higher lows describe an uptrend, lower highs and lower lows a downtrend. A break of structure (BOS) commonly means a break of a prior swing in the direction of the trend. A change of character (CHoCH) commonly means the first break against it. Both describe what happened. Neither is an entry signal, and the section on labels below shows where teachers differ.
2. Order blocks
An order block is the last opposite candle before an impulsive change of direction. SMC traders read that candle as an area where large orders may have been filled and expect a possible reaction when price returns. In classic language it is close to a demand or supply zone. Our guide to order blocks covers the three conditions, how to draw the zone and where the stop goes.
3. Displacement
Displacement is a fast move with large candle bodies that pushes price away from a level. SMC reads it as the trace of an aggressive participant. What you can see is momentum, a contrast between small candles and a few large ones. There is no single standard for how large is large enough, so any rule needs its own threshold. A daily chart often spreads such a move over several bars, as our SPY example shows.
4. Fair value gaps
A fair value gap (FVG) is the price range between the first and third candle of a three-candle sequence whose ranges do not overlap. The two edges are concrete prices, which makes the pattern easy to check. The idea that price returns to “rebalance” the area is an interpretation. In our guide to fair value gaps, revisits were common, but moves of the same size were about as common on other days in the SPY sample. A zone broken by a close is often read with the opposite role, as an inverse FVG.
5. Liquidity and liquidity sweeps
In SMC, liquidity means areas where many stop and pending orders are expected, typically beyond obvious highs and lows. Nobody can see those orders in full, so the zones are educated guesses, not measurements.
A liquidity sweep is a short break beyond an obvious high or low after which price closes back inside the range. It is often the first step in the sequence. If the break bar closes beyond the level, our guide to the liquidity sweep calls it a run instead. That guide also tests both outcomes on SPY and gold. This block can help you see why obvious stop levels carry a risk, without assuming anyone was hunting your stop.
6. Equal highs and equal lows
Equal highs and equal lows are two or more swing points at almost the same price. SMC reads them as a visible place where stop orders may gather, because many traders put stops just beyond a level that held twice. Classic chart analysis calls the same shape a double top or double bottom. The classic reading expects a reversal; SMC often expects a run through the level first. Neither reading turns the level into a magnet.
7. Premium and discount
Premium and discount split a price leg at its midpoint, with premium above 50% and discount below it. SMC traders look to buy in discount and sell in premium. In practice this is close to the 50% level of a Fibonacci retracement. It can stop you from chasing a breakout, but it is a convention, not a signal. The result also depends on which leg you measure, and in both of our SPY examples the filter would have ruled out the trade.
BOS, CHoCH and MSS: where the labels differ
All three labels describe a break of a prior swing, and the teaching is not uniform. The graphic shows one common reading. The table adds the market structure shift (MSS) and where sources disagree. Treat the column on the right as the important one, because it decides which signal you think you have.
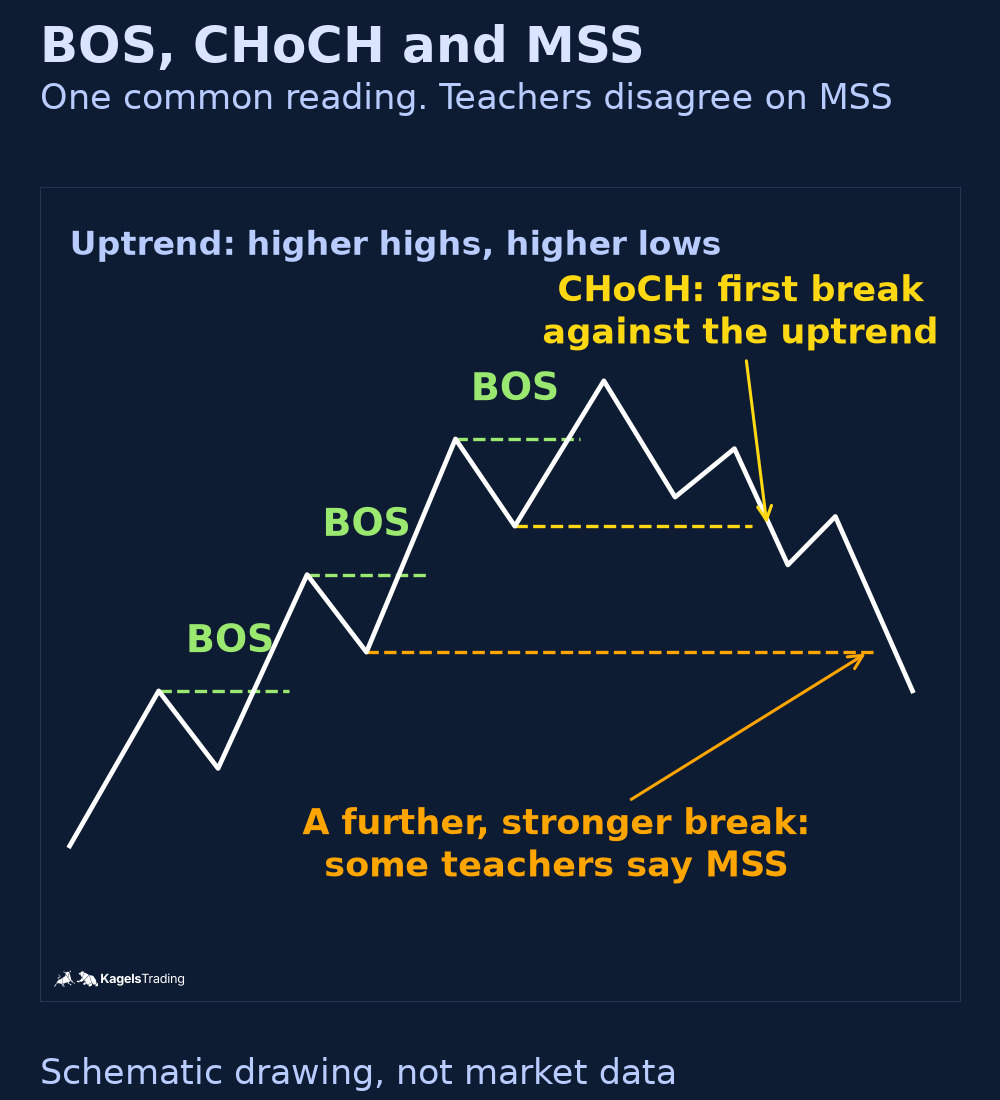 Click to enlarge
Source: Kagels Trading, own drawing.
| Label | Common meaning | Where teachers differ |
|---|---|---|
| BOS | Break of a prior swing with the trend | Close or wick, and which swing counts |
| CHoCH | First break of a swing against the trend | An early warning, or a full reversal |
| MSS | A break against the trend, often after a sweep and with displacement | Whether it comes before or after a CHoCH |
The order of CHoCH and MSS is a good example. A guide from Backtrex treats CHoCH as the early warning and MSS as the later confirmation. A guide from TradingFinder describes MSS as the initial signal that might lead to a CHoCH. The widely used LuxAlgo script lists BOS and CHoCH in its structure labels and has no MSS label in that list.
So define the rule before you use the word. Write down which swing counts, whether a close is required, and on which timeframe you read it. Our order block guide uses “market structure shift” for a close beyond the last swing after a sweep. Another reader could call the same close a BOS, if the pullback before it never ended the uptrend. The word matters less than a rule you can repeat and test.
One sequence on a real chart: SPY in May 2026
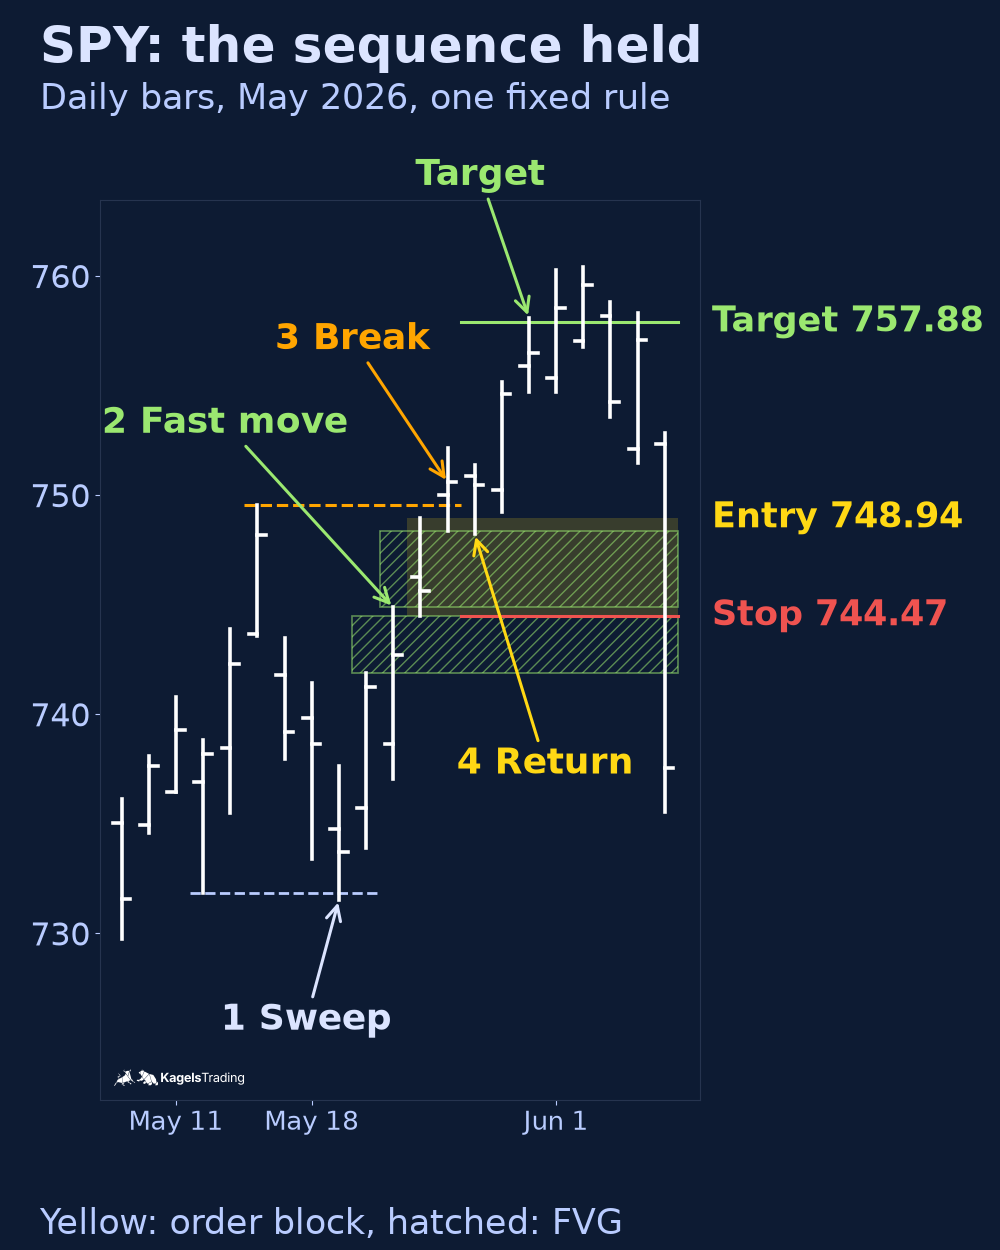
This example follows the fixed rule from our order block guide, so the labels were not fitted by hand. It uses SPY daily bars from Yahoo Finance, in US dollars. We chose it afterward to show the sequence, and it proves nothing about future results. It is not a live trade. The four numbers below match the markers in the chart.
- Sweep: on May 19, SPY traded down to 731.53, below the May 12 low of 731.83, and closed back above it at 733.73.
- Fast move: SPY rose over the next sessions. Two fair value gaps formed, from 741.87 to 744.48 and from 744.87 to 748.37. The rule used no strength filter, so calling this displacement would be a judgment.
- Structure break: on May 26, SPY closed at 750.59, above the May 14 high of 749.53.
- Return to the zone: the last red bar before that close, May 22, gave an order block from 744.48 to 748.94. On May 27, SPY came back into it and filled the buy at 748.94, with a stop at 744.47 and a target at 757.88, twice the risk.
 Click to enlarge
The target was reached on May 29, and the chart still does not prove the story behind it. Whether stops triggered below 731.83 or a large buyer stood on the other side is not visible in these bars. We see a sequence of prices that met a rule, and nothing about who traded them.
Look at the second gap and the order block together. The gap from 744.87 to 748.37 lies entirely inside the zone from 744.48 to 748.94. Two labels mark almost the same prices from the same move, so they are not two independent reasons to buy. The filter also disagrees with the setup: the entry stood about 85% of the way up the leg from 731.53 to the May 26 high of 752.13, deep in premium. A strict discount rule would have skipped this winner.
When the same sequence fails: SPY in October 2026
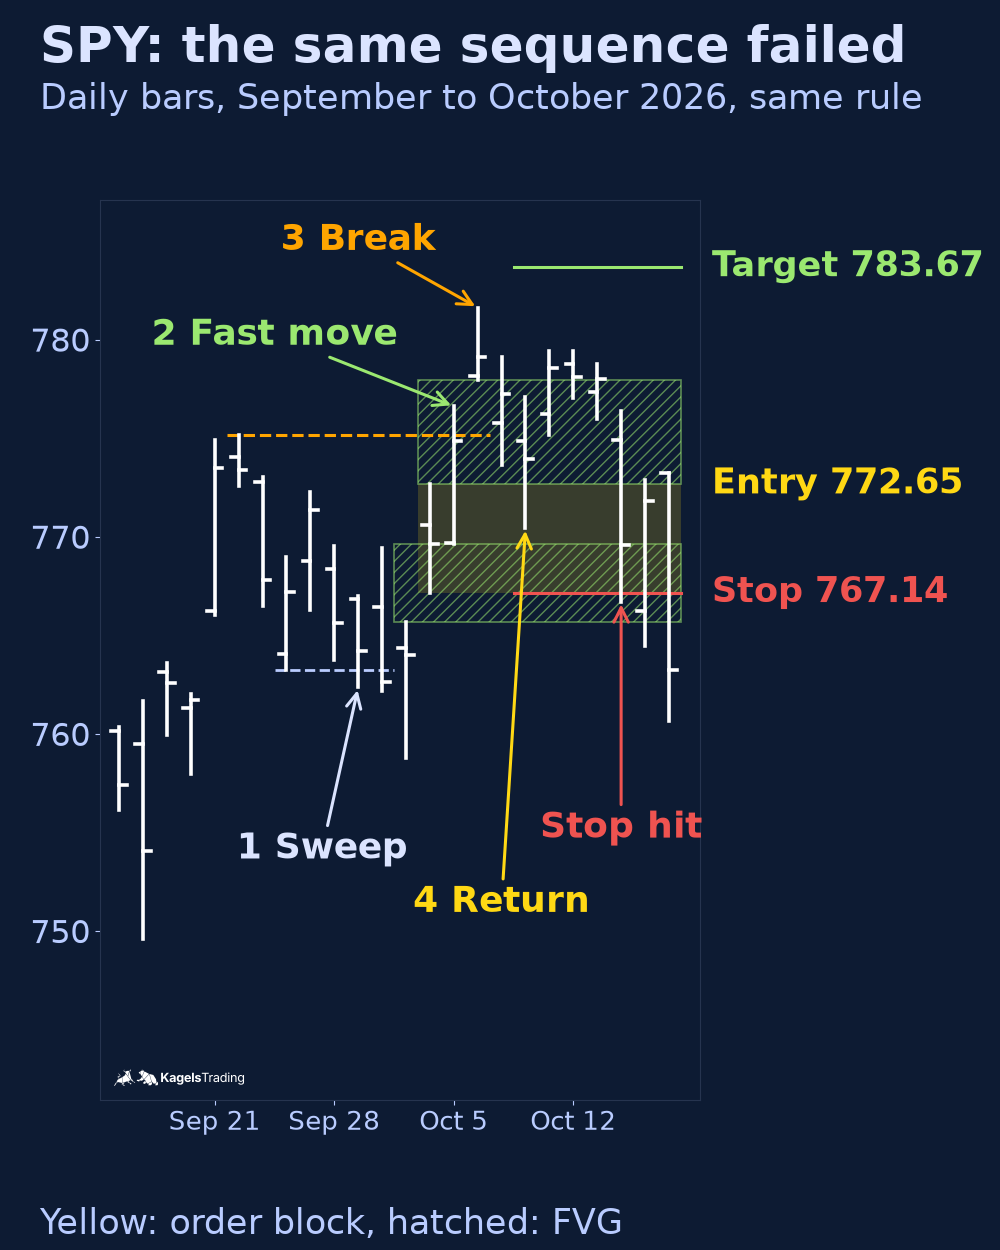
The same rule produced a loser a few months later. On September 29, SPY traded down to 762.35, below the September 24 low of 763.25, and closed at 764.20. Two sessions later it traded lower still, to 758.79. On October 6, it closed at 779.09, above the September 22 high of 775.14. The rule took the October 2 bar as the zone, from 767.15 to 772.65.
 Click to enlarge
On paper, the failed setup looked as complete as the winner. It had a sweep, a fast move with two fair value gaps, a structure break and a return to the zone. The buy filled at 772.65 on October 8, with a stop at 767.14. On October 14, the low of 766.71 hit the stop. The entry again stood above the 50% line of the leg, so premium and discount did not separate this loser from the winner.
The lesson is about counting, not about these two trades. A sweep, a gap, an order block and a structure break often describe one fast move, so adding labels does not add four independent pieces of evidence. Two examples cannot give a hit rate either. Only a fixed rule tested over many cases can say more.
How to test an SMC setup step by step
Keep the first version simple, so you can tell what caused a result. These steps describe how to write a rule, not a proven strategy. Test one idea on past data and in a demo account before you add another.
- Define direction: decide how you read the trend on the higher timeframe. Our guide to multi-timeframe analysis shows one way to separate context from entry.
- Define structure: say which swing counts, and whether a close is required for a break.
- Define the zone: choose one marking, for example the last opposite candle before the break, and draw only zones in your chosen direction.
- Define the entry: wait for the return to the zone, with a limit order at its edge or after a reaction you can describe in words.
- Define the risk: place the stop beyond the zone and calculate the size from that distance, as shown in our guide to position sizing.
- Define the exit and the time window: set a target, such as the last swing, and a rule for trades that reach neither target nor stop. If you use a session filter such as killzones, treat it as one more variable to test.
SMC indicators: they draw, they do not decide
Indicators can mark structure, zones and gaps automatically, which saves drawing time. The best-known example on TradingView is the LuxAlgo script linked above, a public script with visible source code. As of November 6, 2026, its feature list includes BOS and CHoCH, order blocks, equal highs and lows, fair value gaps, and premium and discount zones. Zeiierman’s indicator page has a Smart Money Concept category and lists both free and premium indicators. We name both as examples and did not test them for this guide.
A script applies its own definitions and does not judge the setup. It can fill a chart with zones, and its labels may not match your written rule. Used for a couple of weeks, it can train your eye. Used as a permanent signal, it means you are trading someone else’s default settings.
Is SMC profitable? What we can and cannot show
We know of no independent, audited record of SMC results across many accounts. That does not prove SMC fails. It means marketing claims and screenshots cannot settle the question. If someone sells you a course on verified results, ask to see the method, the period and the losing trades.
We can show what a few single rules did. Our spoke guides each tested one fixed rule on daily bars, on SPY from 2001 and on the gold ETF from November 2004, up to October 16, 2026. The results are gross: no fees, and no slippage beyond opening gaps. Execution assumptions differ from rule to rule, so these are not comparable portfolio returns. They are separate rules on a narrow data set, not a test of SMC, and they do not show how an intraday version or another definition would do.
| Fixed rule (spoke guide) | Closed trades | Average per trade |
|---|---|---|
| Order block, long, SPY | 59 | −0.16R |
| Fair value gap, long and short, SPY | 308 | −0.02R |
| Inverse fair value gap, SPY | 449 | −0.10R |
| Long after a confirmed low sweep, SPY | 75 | +0.23R |
| Long after a confirmed low sweep, gold ETF GLD | 57 | −0.22R |
None of these rows shows a stable edge. R is the planned risk per trade, so −0.16R means an average loss of about one-sixth of that risk. The sweep rule was positive on SPY and negative on gold, with a margin of error about as large as the results. What decides is your own record: a fixed rule, enough trades and an honest log, for example with our guides to backtesting and the trading journal.
Be careful with the environment around SMC, too. A large market of courses and signals has grown up around these terms. The SEC warns in its investor alert on social media and investment fraud that information on social media may be inaccurate, incomplete or misleading, and that some influencers are paid to promote an investment. Test a concept on your own charts before you pay for it.
Common SMC mistakes
Most problems come from using too many concepts at once, not from one wrong definition. These six mistakes come up most often, and each has a simple fix:
- Learning everything at once: if you add order blocks, gaps, sweeps and premium zones together, you cannot tell which one caused a result. Add one at a time.
- Marking every zone: a chart with twenty rectangles always has one that reacted. Decide in advance which zones qualify.
- Ignoring the higher timeframe: a long setup on a five-minute chart sits in a different context if the daily chart is falling.
- Trading every structure break: BOS and CHoCH describe a break. They do not tell you where to enter or where the stop goes.
- Entering the sweep too early: while the bar is still open beyond the level, you do not yet know whether it will close back inside. It may become a run.
- Trading without a risk rule: zones fail, sometimes several in a row. Fix your risk per trade first, as our guide to risk management explains.
SMC vs price action: same chart, different story
Both approaches read a plain chart and work with zones. The difference is mainly the explanation. Classic price action says what happened: support held, a high broke. SMC adds why it happened, namely the behavior of large players, and that part cannot be checked from a chart.
| SMC term | Close classic idea |
|---|---|
| Order block | Demand or supply zone |
| Liquidity sweep | False breakout, Wyckoff spring |
| Displacement | Momentum |
| Equal highs and lows | Double top, double bottom |
| Premium and discount | 50% retracement |
The story can be useful as a memory aid. If it helps you follow rules and wait for your level, that has practical value. We have seen no evidence that it raises the hit rate by itself. If the vocabulary gets in your way, you can work with the same zones in classic terms and skip a layer of translation.
Pros and cons of SMC
Weigh both sides before you spend time on the method. The points apply whether you draw by hand or use an indicator.
Pros:
- Testable when written down: structure, zone and entry can be turned into rules.
- A clean chart: you can work with price alone, without calculated indicators.
- A logical stop: the zone gives you a reference instead of a round number.
- A familiar core: many parts rest on long-used ideas about supply, demand and levels.
Cons:
- An unverifiable explanation: a chart cannot show whether a zone held institutional orders.
- Inconsistent labels: teachers define some terms differently, as BOS, CHoCH and MSS show.
- False confirmation: overlapping labels on one move look like several reasons.
- Hindsight: almost any zone fits on an old chart, and far fewer are clear in real time.
- Heavy marketing: a market of courses and signals drives up expectations.
Conclusion: useful map, unproven explanation
SMC gives you a structured way to read a chart, but no shortcut to profitable trading. Its clearest idea is simple: stops beyond obvious levels can add order flow, and many traders know where those levels are. That helps explain why some breakouts fail, without proving who caused a single move.
Use the labels to describe a sequence, then test the rule behind it. Our SPY examples show how similar a winner and a loser can look at the moment of entry, and how several labels can mark the same move. If the vocabulary helps you stay disciplined, use it. If it confuses you, classic price action covers the same chart with fewer words.
This guide is education, not investment advice. Trading with leverage, futures or options can lose more money than you expect, and past examples do not predict future results. Decide your risk per trade before you enter.
Frequently asked questions about Smart Money Concepts
What are Smart Money Concepts in trading?
Smart Money Concepts are a chart-reading approach that infers where large traders may have placed orders. Traders then look for entries at those zones, using terms such as order blocks, fair value gaps and liquidity sweeps. The institutional reading is an interpretation, because a price chart does not show who traded.
What are the main SMC concepts?
The usual seven are market structure, order blocks, displacement, fair value gaps, liquidity, equal highs and lows, and premium and discount. You do not need them all at once. Start with one, test it and then decide whether another adds anything. Many of them can mark the same move.
What is the difference between BOS, CHoCH and MSS?
A BOS commonly means a break with the trend, and a CHoCH the first break against it. An MSS usually means a break against the trend, often after a sweep and with a fast move. Teachers differ on whether it comes before or after a CHoCH, so write your own definition.
What is the SMC entry model?
A common model waits for a sweep, a structure break and a return to a zone. The trader enters at the order block or fair value gap in the new direction, places the stop beyond the zone and sets a target such as the last swing. It is a model to test, not a proven edge.
Do SMC traders really trade like banks?
No, they trade an interpretation of what large traders might be doing. Bank order books are not public, and even a detailed exchange feed does not name the traders. SMC gives you a framework for decisions, not a view of institutional positions.
Who created Smart Money Concepts?
Much of the vocabulary is associated with Michael Huddleston, the Inner Circle Trader. The underlying idea is older: Richard Wyckoff described his Composite Man in the 1930s. Other coaches have since added their own definitions.
Are SMC indicators free?
Free versions exist. The LuxAlgo Smart Money Concepts script is a public script on TradingView, and Zeiierman also lists free indicators alongside premium ones. Check the current terms on each page, and remember that the script draws its own definitions, not your rule.
Is SMC only for forex?
No, the labels can be drawn on any market with a price chart. That includes stocks, indices, commodities and crypto, and our examples use the SPY ETF. Whether a rule holds up in a given market or timeframe is a separate question that needs its own test.
Is SMC trading profitable?
We know of no independent record that shows SMC is profitable as a whole. The single rules we tested on daily bars showed no stable edge, but they cover only a narrow part of how traders use SMC. Only your own test of a fixed rule over many trades can answer this for your method.
This English edition is based on our German edition on kagels-trading.de and has been adapted for international readers.
More Chart Techniques guides
- Draw key levels
Support and Resistance: How to Draw and Use Key Levels
Where useful levels come from, how to draw zones with a stated rule and how to turn a level into a trade plan.
- Read price action
Price Action Trading: How to Read Charts Without Indicators
Market structure, key zones and three bar patterns, with a core setup and a real SPY example where the signal failed.
- Read candlestick charts
How to Read Candlestick Charts: Body, Wicks and Context
Open, high, low and close in one candle, body and wicks, two real Gold candles read step by step and how often patterns really occur.
- Know candlestick patterns
Candlestick Patterns: 10 to Know, Tested on Real Data
Ten patterns with rules and a cheat sheet, counted on DAX, S&P 500, EUR/USD and Gold since 2014: most are rare, none is a signal on its own.
- Combine timeframes
Multi-Timeframe Analysis: A Weekly and Daily Workflow
How to combine the weekly chart for context and the daily chart for entry under one stated rule, with a documented SPY case from June 2025.
- Trade pullbacks
Pullback Trading: Entries, Stops and Failed Setups
Pullback or reversal, limit against confirmation entry, and one fixed rule set on three real QQQ cases: a target, a stop and a cancelled setup.
- Trade sideways ranges
Range Trading: Boundaries, Orders and Two Documented Fades
A 14-session rule to draw horizontal boundaries, three order-type variants and two Alpaca-verified SPY fades, one that reached the target and one that was stopped out.
- Read chart formations
Chart Patterns: Reversals, Continuations and Failures
Reversal, continuation and bilateral formations with the measured-move convention per pattern and two documented SPY rectangle cases.
- Trade breakouts
Breakout Trading Strategy: Entries and False Breakouts
How often breakouts fell back into the range in our count of 1,472, and how to plan entry, stop and position size.
- Draw and trade trendlines
Trendline Trading: How to Draw Trendlines and Trade Them
How to draw trendlines with a fixed rule, four strategies for bounces, breaks and retests, and a real SPY line break without a lasting reversal.
- Use Fibonacci levels
Fibonacci Retracement Levels: How to Draw and Trade Them
How to calculate and draw retracement levels, trade pullbacks with confluence and a stop at the structure, and what a ten-year test says about the levels.
- Set Fibonacci targets
Fibonacci Extension: Levels, How to Draw It and Calculator
Three-point extension targets from the end of a pullback, why they differ from levels beyond 100%, a free calculator and three SPY swings, one without a single target reached.
- Trade gaps
Gap Trading Strategy: How to Trade Gaps and When Gaps Fill
Opening and full gaps, the four classic gap types, how often SPY gaps filled in our count since 2001, and plans for gap fill and gap and go.
- Calculate pivot points
Pivot Points: Formulas, Types and How to Trade Them
Formulas for standard, Fibonacci, Woodie, Camarilla and DeMark pivots, a free calculator, which session counts and a real SPY day.
- Swing trade
Swing Trading: 4 Strategies, Risk and Real Examples
Four swing trading strategies on the daily chart, position size, gap risk and US rules, with two hypothetical SPY pullbacks: one hit its target, one was stopped out.
- Identify market stages
Stage Analysis: Stan Weinstein's Four Market Stages
Stan Weinstein's four stages on the weekly chart, a Stage 2 checklist and two TSMC breakouts: one ran for a year, one gapped through its stop.
- Screen for growth leaders
CAN SLIM: William O’Neil’s Seven Rules for Growth Stocks
William O'Neil's seven CAN SLIM criteria with thresholds, his selling rules, a free screen with real counts and what the tests really show.
- Read Wyckoff ranges
Wyckoff Method: Accumulation, Distribution and Springs
Accumulation and distribution with phases A to E, springs and upthrusts as optional tests, and two real TSMC ranges read with and without hindsight.
- Trade Darvas boxes
Darvas Box Strategy: Rules, Entries and Stop Losses
The box rules step by step, when the edges become known, where the stop goes, and a mechanical test on TSMC in 2024 with two honest results.
- Count Elliott waves
Elliott Wave Theory: Rules, Patterns and Fibonacci
The five-wave pattern, three hard rules, zigzags, flats and triangles, Fibonacci ratios and a real DAX count, from the first German translator of the standard work.
- Trade order blocks
Order Blocks: How to Spot, Draw and Trade the Zone
The three conditions behind a valid order block, entry and stop at the zone, two SPY cases from 2026 and a 25-year count where a fixed rule lost money.
- Trade fair value gaps
Fair Value Gap (FVG): How to Spot, Trade and Test It
The three-candle rule, bullish, bearish and inverse FVG, two SPY cases from 2026 and a 25-year count of how often gaps were revisited and traded.
- Read liquidity sweeps
Liquidity Sweep: How to Spot It and Trade the Reversal
Sweep or run, buy-side and sell-side liquidity, internal and external targets, SPY reversal, continuation and failed-reversal examples and a 25-year count of a fixed sweep rule.
- Interpret volume
Volume Analysis in Trading: How to Read Volume Honestly
What volume counts in stocks, futures, forex and crypto, how to read it against its own average, and our SPY test of high-volume days since 2001.