
CAN SLIM: William O’Neil’s Seven Rules for Growth Stocks


Contents
CAN SLIM is a checklist for finding growth stocks before their biggest moves. William O’Neil, the founder of Investor’s Business Daily, built it from his study of the best-performing stocks of earlier decades. Each letter stands for one trait those stocks shared before they rose: strong earnings, something new, demand for the shares, market leadership, buying by funds and a rising market.
The method is easy to learn and hard to prove. The seven criteria describe what past winners looked like, which is not the same as a rule that picks future winners. This guide explains each letter with the thresholds from O’Neil’s book, his selling rules, a practical screen with real counts from 31 October 2026, and what the evidence shows when the rules are tested.
CAN SLIM in 30 seconds
- C and A look at earnings: strong growth in the latest quarter and in each of the last years.
- N, S and L look at the stock: something new, demand for a limited supply of shares, and price strength against the market.
- I and M look at the environment: buying by institutional investors and a market in an uptrend.
- Selling rules are part of the method: cut every loss at 7 to 8 percent below the purchase price, take at least some profits at 20 to 25 percent.
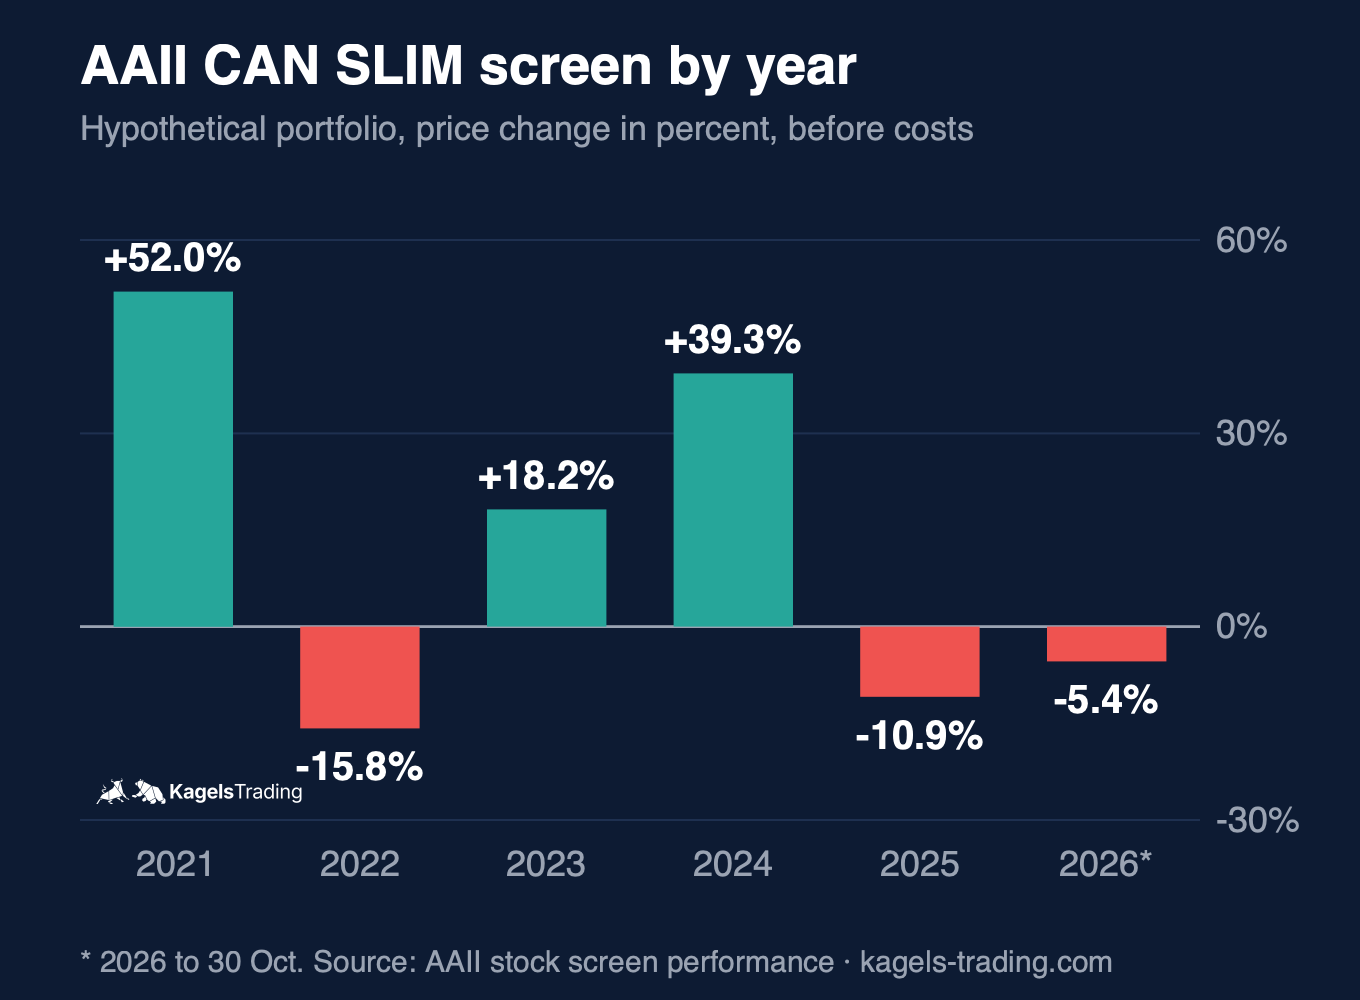
- The evidence is mixed. AAII’s CAN SLIM screen gained 52 percent in 2021 and lost 15.8 percent in 2022; it is a hypothetical portfolio, before costs.
What is CAN SLIM?
CAN SLIM is a stock selection method by William O’Neil that combines company earnings with chart behaviour. O’Neil founded the research firm William O’Neil + Co. in 1963 and the newspaper Investor’s Daily, later Investor’s Business Daily, in 1984. He described the method in his book How to Make Money in Stocks, first published in 1988; the fourth edition of 2009 is the current one. O’Neil died on 28 May 2023 at the age of 90.
The letters are a list of traits, not a formula. O’Neil studied stocks that had made the largest gains and noted what they had in common before the rise. CAN SLIM asks you to look for the same combination today. That makes it a growth method with a strong chart element, close to the trend template of Mark Minervini, who also learned from O’Neil’s work.
| Letter | Stands for | Question it asks |
|---|---|---|
| C | Current quarterly earnings | Did earnings per share grow strongly in the latest quarter? |
| A | Annual earnings increases | Have earnings grown year after year? |
| N | New products, management, highs | Is there something new, and is the stock near a new high? |
| S | Supply and demand | Is demand for a limited number of shares rising? |
| L | Leader or laggard | Is the stock stronger than the market and its industry? |
| I | Institutional sponsorship | Are funds buying, and is their number growing? |
| M | Market direction | Is the overall market in an uptrend? |
The seven criteria and their thresholds
O’Neil gave concrete numbers for most letters, and different sources quote different ones. The thresholds below follow O’Neil’s book as quoted by the American Association of Individual Investors (AAII), which runs CAN SLIM screens based on it. Many guides use 25 percent for the earnings criteria; where the sources differ, I say so.
C: current quarterly earnings
The latest quarter’s earnings per share should be clearly higher than a year earlier. O’Neil set a minimum increase of about 18 to 20 percent against the same quarter of the previous year, and many guides use 25 percent. Accelerating growth over the last quarters counts as a plus. Compare the quarter with the same quarter a year earlier, not with the quarter before, so seasonal effects do not distort the picture.
A: annual earnings increases
Strong quarters should rest on years of rising earnings. AAII’s original screen asks for higher earnings per share in each of the last five years, and for trailing twelve-month earnings at or above the last full year. This filters out companies that had one good quarter after years of losses, and it is the criterion that excludes many turnaround stories.
N: new products, new management, new highs
Something must have changed, and the chart must show it. O’Neil looked for a new product, new management or a change in the industry, together with a stock that breaks out to a new high from a sound base. The idea that a stock near its high is “too expensive” is exactly what O’Neil argued against; he bought strength, not weakness.
S: supply and demand
A limited number of shares meeting strong demand moves the price. In O’Neil’s original study, 95 percent of the winners had fewer than 25 million shares outstanding, and AAII’s original screen caps the float at 20 million shares. Today many leaders are large companies, which is why AAII also runs a version without that cap. Rising volume on up days is the practical sign of demand.
L: leader or laggard
Buy the leader of a strong group, not the cheap laggard. O’Neil measured this with a relative strength rank and advised avoiding stocks below 70 and seeking 80 or better. AAII’s screen asks for a 52-week relative strength in the top 30 percent of all stocks. Our relative strength guide explains how to measure it on a chart without a paid rating.
I: institutional sponsorship
Some fund buying confirms demand, too much can be a risk. O’Neil suggested at least three to ten institutional owners as a reasonable minimum, and AAII’s screen asks for at least five. What matters more is that the number of quality funds holding the stock is rising; a stock that every fund already owns has fewer new buyers left.
M: market direction
Most stocks move with the general market, so the M decides when the other letters count. O’Neil only bought in a market uptrend and suggested moving part of the portfolio to cash when the market peaks and reverses. IBD publishes its own daily assessment of the market trend. If you do not follow it, a simple rule is to read the trend of the main indices on the weekly chart, as in Stage Analysis.
O’Neil’s selling rules
The selling rules are as important as the buying rules. IBD’s core rule is to cut every loss at 7 percent, at most 8 percent, below the purchase price, without exception. On the profit side, IBD advises taking at least some profits when a stock has gained 20 to 25 percent from the buy point, a rule O’Neil developed in 1961.
There is one exception to the profit-taking rule for the strongest stocks. It never applies to the loss rule. According to secondary sources on IBD’s method, a stock that gains 20 percent or more within three weeks of a proper breakout should be held for at least eight weeks, because such speed often marks a big winner. Sources differ on whether the 20 percent counts from the buy point or the breakout, so check the current IBD wording before you use it.
- YouMarket checkM: buy only when the general market is in an uptrend
- ScreenerScreenC, A, S, L, I: filter earnings, demand, strength and fund ownership
- YouChartN: buy the breakout from a sound base near the new high
- YouSellCut the loss at 7 to 8 percent; take at least some profits at 20 to 25 percent
The eight-week hold is an exception to the profit-taking rule for very fast winners, described in secondary sources on IBD's rules; the loss rule always applies.
A practical CAN SLIM screen
You can approximate five of the seven letters with a free screener. On 31 October 2026, after the close of 30 October, I ran the following filters in the free Finviz screener. Finviz has no relative strength rank and no institutional buying trend, so the filters are an approximation, not O’Neil’s exact rules. Our Finviz review explains the screener in detail.
| Step | Finviz filter | Letter | Stocks left |
|---|---|---|---|
| 0 | all stocks | 5,612 | |
| 1 | EPS growth “qtr over qtr” over 25% (latest quarter against the same quarter a year earlier) | C | 2,437 |
| 2 | EPS growth past 5 years over 20% a year | A | 567 |
| 3 | 0 to 10% below the 52-week high | N, L | 70 |
| 4 | institutional ownership over 10% | I | 68 |
| 5 | average volume over 200,000 shares | S | 58 |
Free Finviz screener, read on 31 October 2026 with data after the close of 30 October 2026. Finviz’s “qtr over qtr” filter compares with the same quarter a year earlier; I did not use its “EPS growth this year” filter, because that is an estimate. The counts change every day.
The earnings history and the 52-week-high filter do most of the work. A strong quarter alone leaves 2,437 stocks; five years of earnings growth cut that to 567, and asking for a price within 10 percent of the high to 70. That matches O’Neil’s idea that leaders already trade near their highs. The 58 stocks that remain are a watchlist, not a buy list: the M, a proper chart base and the year-by-year earnings record (Finviz’s five-year figure is an average) still have to be checked one by one.
Other tools come closer to the original rules. IBD’s own platform MarketSurge, formerly MarketSmith, shows O’Neil’s ratings and lists; on 31 October 2026 it cost $149.95 a month or $1,499 a year in the US. Some screeners, such as ChartMill, offer a ready-made CAN SLIM screen, so check the filter list before you rely on a preset. Our stock screener comparison sorts the main tools by task.
What the evidence shows
 Click to enlarge
Source: AAII stock screen performance.
Tests of CAN SLIM show long periods of outperformance and painful years. AAII has tracked screens based on O’Neil’s rules since 1998. As of 31 May 2023, AAII reported an annualized price gain of 19.2 percent for its original CAN SLIM screen against 5.7 percent for the S&P 500. The chart shows how uneven the path is: plus 52.0 percent in 2021, minus 15.8 percent in 2022 and minus 10.9 percent in 2025.
These figures need careful reading. AAII’s screens are hypothetical portfolios that hold every stock passing the rules at the end of each month, measured by price change only and before trading costs. They follow AAII’s interpretation of the book, not O’Neil’s own trading. AAII rebalances monthly in equal dollar amounts and does not apply O’Neil’s separate stop-loss or profit-taking rules, so these results do not test the complete trading method described above. Academic tests are few: Lutey and Rayome (2022) tracked a small live paper portfolio from 2014 to 2017 that beat the S&P 500, and Lutey, Hassan and Rayome (2018) found risk-adjusted outperformance for a modified version, weaker over the longest window.
Retrospective winners do not prove a repeatable edge. O’Neil built CAN SLIM by looking back at stocks that had already risen. Any rule set built that way fits the past well. The honest summary is that CAN SLIM gives a clear process for finding strong growth stocks, and that its results depend on the market phase, your execution and strict loss cutting.
How I use CAN SLIM as a trader
I use CAN SLIM as a filter, not as a trading system. The letters help me find stocks with real earnings growth that already trade near their highs. The entry, the stop and the size come from the chart and my own risk rules, as for every other trade.
The M and the 7 percent rule are the two parts I would never drop. In a falling market, even the best earnings do not stop a stock from falling, and a strict stop keeps one mistake small. For position size, I work from the stop and a fixed share of the account, as our position sizing guide explains with examples.
Conclusion: CAN SLIM is a checklist with a strict exit
CAN SLIM combines growth, strength and market timing in one memorable checklist. The seven letters push you towards companies with rising earnings, new highs and fund buying, in a market that supports them. O’Neil’s numbers give you concrete thresholds to start from.
Its value comes from the discipline, not from the letters alone. Tested portfolios show strong years and losing years, and they are hypothetical. Use the screen to build a watchlist, check the chart and the market, and keep the selling rules as strictly as the buying rules. For the stage of the trend and for strength, combine it with the stage analysis and relative strength guides linked above.
Frequently asked questions about CAN SLIM
What does CAN SLIM stand for?
CAN SLIM stands for seven traits of winning stocks. C is current quarterly earnings, A annual earnings increases, N new products, management or highs, S supply and demand, L leader or laggard, I institutional sponsorship and M market direction. William O’Neil described them in How to Make Money in Stocks, first published in 1988.
What are the CAN SLIM thresholds?
O’Neil’s book sets a minimum of about 18 to 20 percent quarterly earnings growth, many guides use 25 percent. In AAII’s original screen, earnings must have risen in each of the last five years, relative strength should be 80 or better, and at least three to ten institutional owners should hold the stock. The market must be in an uptrend.
Does CAN SLIM still work?
Tests show strong and weak periods, and no proof of a lasting edge. AAII’s hypothetical CAN SLIM screen gained 52 percent in 2021 but lost 15.8 percent in 2022 and 10.9 percent in 2025, before costs. The method depends on a rising market and on strict loss cutting.
What is the CAN SLIM sell rule?
Cut every loss at 7 to 8 percent below the purchase price. IBD also advises taking at least some profits at 20 to 25 percent above the buy point. For very fast winners, secondary sources describe an exception: hold a stock that gains 20 percent within three weeks of a breakout for at least eight weeks.
Can I screen for CAN SLIM for free?
Yes, you can approximate most letters with a free screener. In the free Finviz screener, five filters for earnings growth, distance to the 52-week high, institutional ownership and volume left 58 stocks on 31 October 2026. Relative strength rank and the market direction still need your own check.
Sources
The rules come from O’Neil’s book as quoted by AAII and from IBD’s published material, checked on 31 October 2026. IBD’s own CAN SLIM pages are behind a paywall, so I do not quote them directly. The screen counts are our own reading of the Finviz screener.
- Rules and history: AAII: CAN SLIM, seven attributes that set market leaders apart (March 2026), AAII Journal: a tribute to William O’Neil (July 2023), IBD on taking profits, via Yahoo Finance, William O’Neil + Co. history 1960s, 1980s, SMU obituary of William O’Neil.
- Evidence: AAII stock screen performance, Lutey and Rayome (2022), Journal of Accounting and Finance, Lutey, Hassan and Rayome (2018), Asian Journal of Economic Modelling.
- Tools: IBD MarketSurge, Finviz screener.
This article is market information, not investment advice. Past screen results are hypothetical and do not predict future returns.
This English edition is based on our German edition on kagels-trading.de and has been adapted for international readers.
More Chart Techniques guides
- Draw key levels
Support and Resistance: How to Draw and Use Key Levels
Where useful levels come from, how to draw zones with a stated rule and how to turn a level into a trade plan.
- Read price action
Price Action Trading: How to Read Charts Without Indicators
Market structure, key zones and three bar patterns, with a core setup and a real SPY example where the signal failed.
- Read candlestick charts
How to Read Candlestick Charts: Body, Wicks and Context
Open, high, low and close in one candle, body and wicks, two real Gold candles read step by step and how often patterns really occur.
- Know candlestick patterns
Candlestick Patterns: 10 to Know, Tested on Real Data
Ten patterns with rules and a cheat sheet, counted on DAX, S&P 500, EUR/USD and Gold since 2014: most are rare, none is a signal on its own.
- Combine timeframes
Multi-Timeframe Analysis: A Weekly and Daily Workflow
How to combine the weekly chart for context and the daily chart for entry under one stated rule, with a documented SPY case from June 2025.
- Trade pullbacks
Pullback Trading: Entries, Stops and Failed Setups
Pullback or reversal, limit against confirmation entry, and one fixed rule set on three real QQQ cases: a target, a stop and a cancelled setup.
- Trade sideways ranges
Range Trading: Boundaries, Orders and Two Documented Fades
A 14-session rule to draw horizontal boundaries, three order-type variants and two Alpaca-verified SPY fades, one that reached the target and one that was stopped out.
- Read chart formations
Chart Patterns: Reversals, Continuations and Failures
Reversal, continuation and bilateral formations with the measured-move convention per pattern and two documented SPY rectangle cases.
- Trade breakouts
Breakout Trading Strategy: Entries and False Breakouts
How often breakouts fell back into the range in our count of 1,472, and how to plan entry, stop and position size.
- Draw and trade trendlines
Trendline Trading: How to Draw Trendlines and Trade Them
How to draw trendlines with a fixed rule, four strategies for bounces, breaks and retests, and a real SPY line break without a lasting reversal.
- Use Fibonacci levels
Fibonacci Retracement Levels: How to Draw and Trade Them
How to calculate and draw retracement levels, trade pullbacks with confluence and a stop at the structure, and what a ten-year test says about the levels.
- Set Fibonacci targets
Fibonacci Extension: Levels, How to Draw It and Calculator
Three-point extension targets from the end of a pullback, why they differ from levels beyond 100%, a free calculator and three SPY swings, one without a single target reached.
- Trade gaps
Gap Trading Strategy: How to Trade Gaps and When Gaps Fill
Opening and full gaps, the four classic gap types, how often SPY gaps filled in our count since 2001, and plans for gap fill and gap and go.
- Calculate pivot points
Pivot Points: Formulas, Types and How to Trade Them
Formulas for standard, Fibonacci, Woodie, Camarilla and DeMark pivots, a free calculator, which session counts and a real SPY day.
- Swing trade
Swing Trading: 4 Strategies, Risk and Real Examples
Four swing trading strategies on the daily chart, position size, gap risk and US rules, with two hypothetical SPY pullbacks: one hit its target, one was stopped out.
- Identify market stages
Stage Analysis: Stan Weinstein's Four Market Stages
Stan Weinstein's four stages on the weekly chart, a Stage 2 checklist and two TSMC breakouts: one ran for a year, one gapped through its stop.
- Read Wyckoff ranges
Wyckoff Method: Accumulation, Distribution and Springs
Accumulation and distribution with phases A to E, springs and upthrusts as optional tests, and two real TSMC ranges read with and without hindsight.
- Trade Darvas boxes
Darvas Box Strategy: Rules, Entries and Stop Losses
The box rules step by step, when the edges become known, where the stop goes, and a mechanical test on TSMC in 2024 with two honest results.
- Count Elliott waves
Elliott Wave Theory: Rules, Patterns and Fibonacci
The five-wave pattern, three hard rules, zigzags, flats and triangles, Fibonacci ratios and a real DAX count, from the first German translator of the standard work.
- Trade order blocks
Order Blocks: How to Spot, Draw and Trade the Zone
The three conditions behind a valid order block, entry and stop at the zone, two SPY cases from 2026 and a 25-year count where a fixed rule lost money.
- Trade fair value gaps
Fair Value Gap (FVG): How to Spot, Trade and Test It
The three-candle rule, bullish, bearish and inverse FVG, two SPY cases from 2026 and a 25-year count of how often gaps were revisited and traded.
- Read liquidity sweeps
Liquidity Sweep: How to Spot It and Trade the Reversal
Sweep or run, buy-side and sell-side liquidity, internal and external targets, SPY reversal, continuation and failed-reversal examples and a 25-year count of a fixed sweep rule.
- Interpret volume
Volume Analysis in Trading: How to Read Volume Honestly
What volume counts in stocks, futures, forex and crypto, how to read it against its own average, and our SPY test of high-volume days since 2001.