
Backtesting: How to Backtest a Trading Strategy Properly


Contents
- Backtesting in 30 seconds
- What is backtesting?
- How does a backtest work? Five steps
- Manual or automatic: two ways to backtest
- Which metrics a backtest must deliver
- My worked example: an S&P 500 trend filter from 1994 to 2026
- Six mistakes that make a backtest worthless
- Checking robustness: out-of-sample, walk-forward, Monte Carlo
- Backtesting software at a glance
- Backtesting for free: what works without a license
- Pros and cons of backtesting
- From backtest to live trading
- Conclusion: a backtest is only as good as its setup
- Frequently asked questions about backtesting
- About the author
One shifted day in the code lifts the return of my S&P 500 backtest from 7.7 to 18.6 percent a year. The rule stays the same, and so does the data. The difference is future knowledge that nobody has in real trading. This is where it is decided whether a backtest tells you something about your strategy or only about your test setup.
This guide gives you the steps of a clean backtest, the metrics you need at the end and six mistakes that make a result worthless. I show everything on my own worked example: an S&P 500 trend filter tested on 32 years of SPY data, including an out-of-sample test and a walk-forward analysis. At the end you find an overview of the software you can test with. This article follows our editorial policy.
Backtesting in 30 seconds
- What it is: backtesting is testing a trading strategy on historical price data, as if the rest of the price history were still unknown.
- The steps: write the rules, choose the data, run the test without knowing the outcome, subtract costs, evaluate the metrics.
- The most important test: the out-of-sample part. In the S&P 500 example, the best filter earned 7.42 percent a year in the years it was chosen on and 11.06 percent afterwards, while buying and holding SPY earned 14.92 percent in those later years.
- The most expensive mistake: look-ahead bias. A close signal that the test credits with the same day’s return lifted the result from 2004 to 2026 from 7.7 to 18.6 percent a year.
- Easy to miss: dividends. Without them, the filter seemed to beat SPY buy and hold in the first period. With them, it did not.
- Sample size: 100 trades are a rough guide, not a fixed limit. My example has only 38 entries from 2013 to September 2026.
- Free to start: with Bar Replay in TradingView on daily charts, with QuantConnect or with Python on your own computer.
What is backtesting?
Backtesting is testing a trading strategy on historical price data, where every rule is applied as if the rest of the price history were still unknown. A backtest answers a statistical question, not a question of opinion. Would this rule have made money in the past, how much, and with which declines along the way? At the end you have figures such as win rate, average win and maximum drawdown, the largest fall from a previous high. The test does not prove that the strategy will work in the future. It does sort out ideas that did not hold even in the past.
The term does not come from trading. Banks use backtesting to check their risk models, and forecasters use it on their models, as the Wikipedia entry on backtesting shows. In trading the word almost always means the same thing: running a strategy with fixed rules against real prices from the past.
A forward test checks a strategy in real time on new prices, usually in a demo account or with paper trading, where the outcome is not yet in any data series. Backtest and forward test complement each other; one does not replace the other. The backtest gives you decades of statistics in hours. The forward test shows whether you can follow the rules under time pressure. TradingView separates the two terms the same way in its help article on strategies, backtesting and forward testing. How to run a forward test there is explained in our guide to paper trading on TradingView.
How does a backtest work? Five steps
Every clean backtest follows the same order, whether you test by hand or with code. If you skip a step, you still get a number. It is simply wrong, and you cannot see that from the number itself.
- DesignWrite the rulesEntry, exit, stop and position size, precise enough that two people would take the same trade.
- DesignChoose the dataMarket, time frame and period; hold part of the history back for the final check.
- TestRun it blindEvery decision may only use prices known at that moment. By hand: hide the right edge of the chart.
- TestSubtract costsSpread, commission and slippage, the gap between the price you wanted and the price you got.
- ReviewEvaluateWin rate, payoff ratio, profit factor, drawdown and number of trades, before you look at total return.
The out-of-sample part is chosen in step 2 and stays untouched until the end.
“Buy when the trend turns” is not a rule. A rule is precise enough that two people looking at the same chart would come to the same trade. If you still have to build your strategy, start one step earlier: first turn the idea into written rules, then test them.
Manual or automatic: two ways to backtest
There are two very different ways to test, and both have their place. The choice depends less on taste than on one question: can your rules be written completely in code? If they can, the automatic test is faster. If they cannot, only the manual test is honest.
Manual backtesting: bar by bar
In a manual test you play the chart forward bar by bar and decide again at every point. It takes time, but it trains exactly what a discretionary trader needs: recognizing a setup without seeing how it ends. For price action, which is hard to press into a formula, this is often the only way. How to do this step by step with Bar Replay is shown in our guide to backtesting on TradingView.
Automatic backtesting: the rule as a program
In an automatic test you write the rules as a program and let the computer run through the whole history in seconds. That allows thousands of trades, parameter comparisons and tests across many markets. In TradingView this works with Pine Script and the strategy report; on your own computer with Python. My worked example below was made exactly that way.
Repainting means that an indicator changes signals it has already shown, so that it looks better in the history than it was in real time. This is the special trap of the automatic test. Some indicators redraw their signals once more bars arrive. On the finished chart they look perfect; in live trading the same signals came later or not at all. A test with such an indicator measures the redrawing, not the strategy.
Which metrics a backtest must deliver
Total return alone says little as long as you do not know how it came about. Five metrics belong in every evaluation, and they are closely linked. The table shows them for my S&P 500 example in the out-of-sample period from 2013 to September 2026 with 0.05 percent cost per side. Win rate, payoff ratio, profit factor and expectancy use the percentage return of each entry, and the position still open on the last day counts with its last close as the 38th trade. Maximum drawdown uses the daily equity curve. Why a single passed prop firm challenge proves no edge either is shown by the simulation of prop firm loss limits.
| Metric | Meaning | S&P 500 example |
|---|---|---|
| Win rate | share of winning trades | 36.8% |
| Payoff ratio | average win per trade divided by average loss per trade | 8.81 |
| Profit factor (percentage-return basis) | sum of winning trade returns divided by sum of losing trade returns | 5.14 |
| Expectancy | average return per trade, not a yearly figure | +4.44% |
| Max. drawdown | largest decline from a previous high | −20.2% |
A low win rate is not a defect of a trend filter, it is how it is built. Almost two out of three trades end with a small loss, because price rises just above the average and falls back below it soon after. The few large winners carry everything. The realized ratio of average win to average loss, the payoff ratio, is close to 9. Unlike a reward-to-risk ratio planned before the trade, it only emerges from the trades. The profit factor of 5.14 means that the winning trades added up to about five times the percentage return the losing trades cost. Platform reports usually compute it from dollar profits and only from closed trades: the 37 closed trades alone give a win rate of 35.1 percent, a payoff ratio of 8.65 and a profit factor of 4.69.
Even so, the strategy ended well behind SPY buy and hold. A good profit factor says nothing about how long the money sat idle. The filter was invested on 84 percent of the days and often bought back late after a pullback. That is why every trade statistic needs a comparison with the simplest alternative: buying and holding. How deep a decline you can sit through before you abandon the system is a question you should answer before the test, not during it.
The number of trades decides how much weight the other metrics carry. My example has 38 entries in almost 14 years, and the longest losing streak is six. For a filter on daily bars that is normal; statistically it is thin. With few trades, chance and a handful of outliers drive the result.
The same metrics apply to your live trades. How to calculate them from your own fills, with costs and a worked example week, is shown in our trading journal guide. How expectancy and win rate feed into the size of each position is explained in our guide to position sizing.
My worked example: an S&P 500 trend filter from 1994 to 2026
To make the mistakes below tangible, I calculated a deliberately simple rule. It is not a recommendation and not a trading system I use myself. It serves as an experiment that shows how strongly the test setup moves the result.
The rule and the data
The rule fits into one sentence. If SPY closes above its simple moving average, I am long at the next morning’s open. If it closes at or below the average, I sell at the next open and hold cash. The signal uses the unadjusted SPY close; dividends only enter the return calculation, so the price drop on an ex-dividend day can move the signal. The best-known length is the 200-day average, but I tested 25 lengths from 10 to 250 days.
The data are SPY daily bars from Yahoo Finance, from February 1, 1994 to September 30, 2026, which is 8,220 trading days. SPY is the SPDR S&P 500 ETF, the oldest US-listed fund that tracks the S&P 500. I did not use the index itself, because the stored S&P 500 history at Yahoo Finance has no usable opening prices for most of this period: up to 1961 it holds only closes, and from 1962 to 2005 the open equals the prior day’s close on 84 percent of the days, in 2005 on 242 of 252. An order “at the next open” would then quietly fill at the signal close. SPY has real opening prices from its start in January 1993. February 1, 1994 is the chosen common start after all 25 averages have completed their warm-up; the 250-day average is first complete on January 24, 1994.
Several simplifications belong on the table. The test puts the whole account into SPY without leverage and without a stop. Cash earns no interest, there are no taxes, and the cost per side is an assumption, not a measured fee. A dividend is credited on the ex-dividend date whenever the position was held over the prior close: reinvested at that day’s close while the filter stays long, kept as cash if it sells at that open. Buy and hold reinvests the same way. This ignores the payment delay and assumes immediate reinvestment. The fund’s own expenses are already in the SPY price. In-sample and out-of-sample are two separate $10,000 tests, each starting flat: buy and hold starts at the close before the test period and pays no costs, the filter only buys at the first open after a signal. As a short source comparison, not a check of all 32 years, daily closes of SPY match Interactive Brokers to the cent for the last week of September 2026; the opens differ by 1 to 4 cents.
In-sample: the best of 25 variants
In-sample is the part of the historical data on which a strategy is developed and its parameters are set. I used February 1994 to the end of 2012 as the in-sample period. Of 25 lengths, the SMA 230 did best: 7.42 percent a year without costs, with a largest decline of 26.0 percent. The 200-day average ranked seventh. Buy and hold earned 7.84 percent in the same period and fell 55.2 percent between 2007 and 2009. From $10,000, the filter made $38,741 and buy and hold $41,683.
So even the best variant did not beat SPY buy and hold in the data it was chosen on. What it did was cut the largest decline by more than half. Many backtests stop here and call that a discovery. Whether the smoother ride is worth the lower return is a fair question, but first comes the period I deliberately left untouched.
Out-of-sample: what happened next
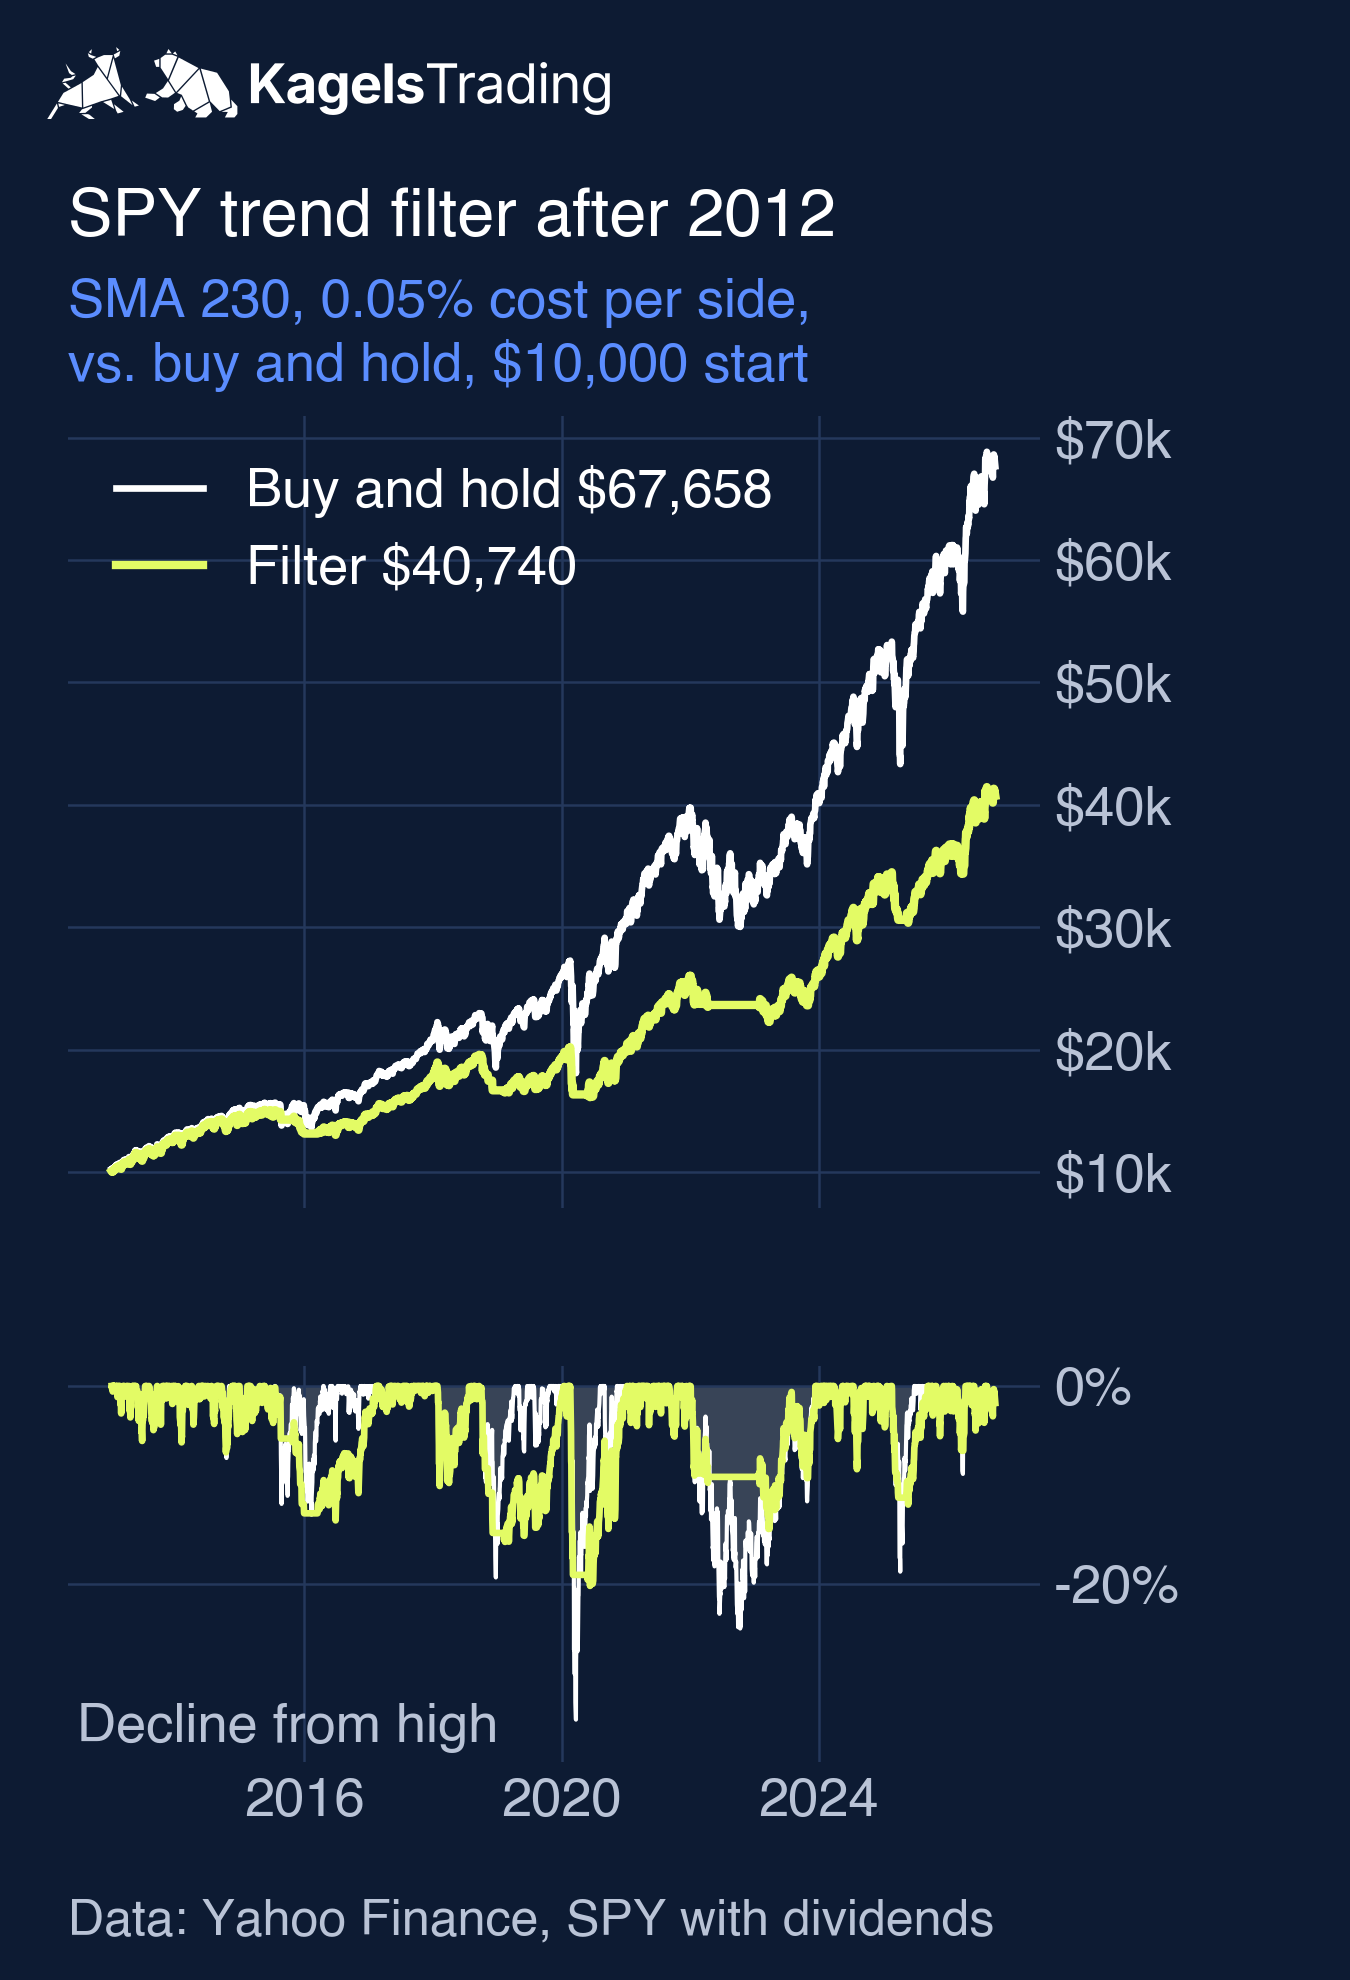
Out-of-sample is the part of the historical data that stays untouched while a strategy is developed and is only used for the final check. From 2013 to September 2026 the same SMA 230 ran with the same rule. Without costs it earned 11.06 percent a year, buy and hold 14.92 percent. The gap grew from 0.4 to almost 4 points a year. What remained was the smaller decline: 20.0 percent against 33.7 percent for SPY. The chart below shows the path with 0.05 percent cost per side, the account on top and the decline from the prior high below.
 Click to enlarge
Notice how rarely the filter was ever ahead. The filter account stood above the buy-and-hold account on only 0.2 percent of the trading days, the last time in early October 2015. The SMA 230 also ranked first of the 25 lengths in this period and still stayed behind buy and hold. One possible explanation is the different market phases: between 1994 and 2012 there were two long bear markets, afterwards mostly shorter drops after which the filter bought back late. That is not a proof of cause, and it does not rule out chance.
The ranking itself has a catch. Comparing all 25 lengths in the out-of-sample period is an extra, exploratory look. After it, this period is no longer untouched data for new decisions. If I now picked a new length because it did best after 2012, I would need a new test period to check it.
The dividend trap: a test without dividends flatters the filter
The S&P 500 index you see on most charts is a price index: it leaves out dividends. For a trend filter this matters, because the filter is out of the market part of the time and misses those dividends only then, while buy and hold collects every payment. The effect builds up over decades. I ran the same test once on prices alone:
| February 1994 to 2012, no costs | Filter SMA 230 | Buy and hold |
|---|---|---|
| Prices only | 6.05% | 5.89% |
| Dividends included | 7.42% | 7.84% |
Without dividends, the filter seems to beat buy and hold; with them, it falls behind. The rule and the prices are the same; only the dividend accounting changes, for both the filter and buy and hold. If you backtest an index or a stock against buy and hold, use a total return series or add the dividends yourself. Otherwise the comparison favors rules that are out of the market on ex-dividend dates.
Cash interest pulls the other way, but it does not change the picture here. As a rough sensitivity, I let idle cash earn the quoted 13-week Treasury bill rate of the prior day, converted from its discount quote and accrued over calendar days. The filter then makes 8.08 instead of 7.74 percent a year from 2004 to 2026 and 11.10 instead of 10.76 percent after 2012. This is not a simulation of actual T-bill purchases, and the filter still trails buy and hold by a wide margin.
What costs do to the result
Costs shrink the result, and the more often you trade, the more they shrink it. With 38 entries and 37 exits in the out-of-sample period, the series looks like this. The last position is still open on September 30, 2026 and is valued at that day’s close:
| Cost per side | Return per year | Max. drawdown |
|---|---|---|
| 0.00% | 11.06% | −20.0% |
| 0.05% | 10.76% | −20.2% |
| 0.10% | 10.46% | −20.4% |
| 0.20% | 9.85% | −20.9% |
A trend filter on daily bars trades rarely, so the damage stays limited here. In an intraday strategy with several trades a day, the same cost rate quickly eats the whole advantage. For a liquid ETF, spread and commission are small; slippage on stops in fast markets and after news is the part you cannot know in advance.
One shifted day, more than double the return: look-ahead bias
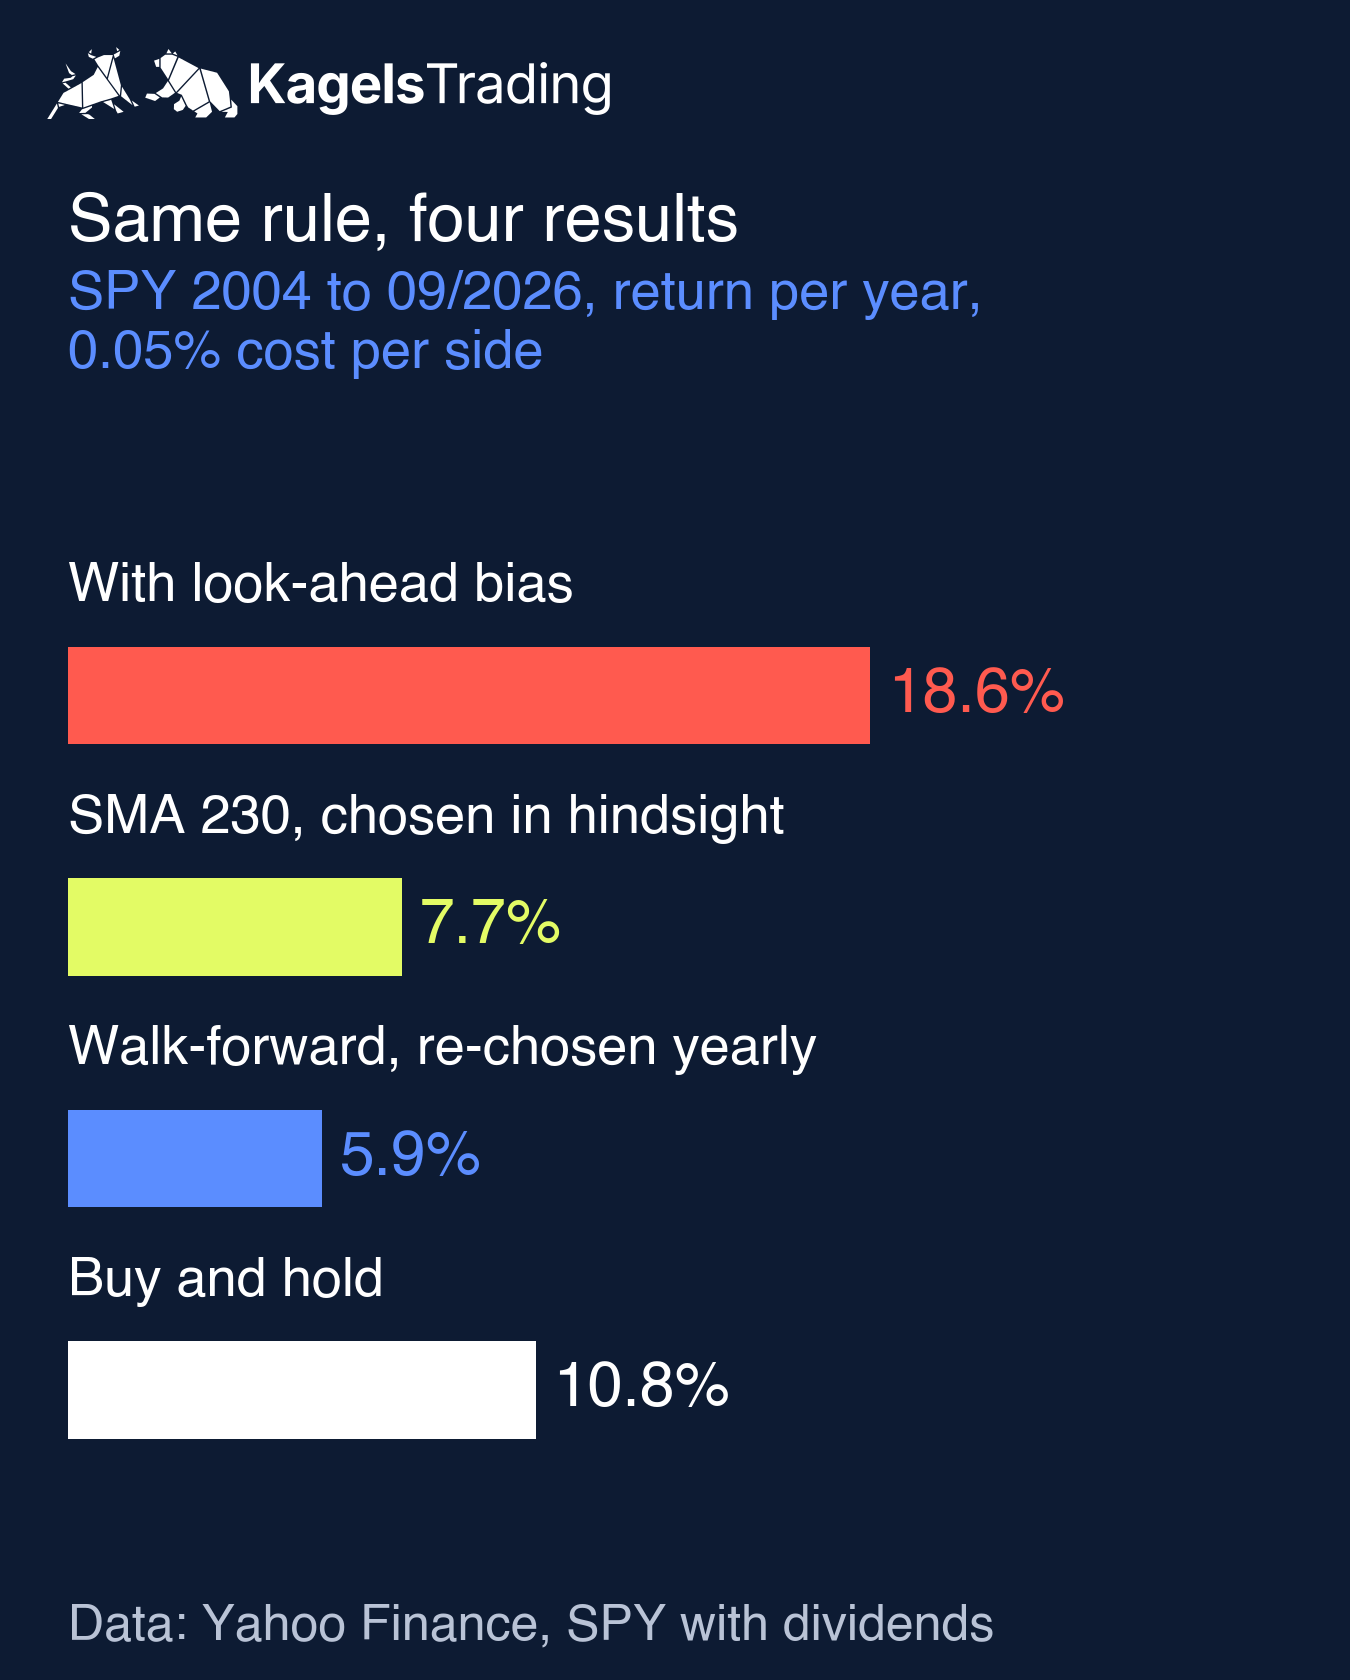
Look-ahead bias is a test error in which a trading decision uses information that was not yet known when the decision was made. For the comparison I built a typical coding mistake into the test on purpose. The signal comes from the close, and the test credits it with the full return of that same day, from the prior close to this close. In real trading that is impossible: whether SPY closes above its average, you only know after the close. The clean version trades at the next open instead. In the code, the two versions are separated by little more than an index shift, but they also settle trades differently: close to close in the faulty version, next open in the clean one. The result for the same period from 2004 to 2026 is shown in the chart below, at 0.05 percent cost per side.
 Click to enlarge
The return rises from 7.7 to 18.6 percent a year, and the largest decline shrinks from 26.5 to 10.1 percent. A result like that looks like a sensation and is a pure measurement error. As a rule of thumb: if a simple filter beats the index by a multiple, check the code first, not the market.
Walk-forward: the result without hindsight
Walk-forward analysis is a test method in which a strategy is set up again and again on a past window and then checked on the following, unseen period. Even the clean SMA 230 still contains some hindsight. I chose it because it did best from 1994 to 2012, using knowledge nobody had in 2004. The walk-forward test avoids that: every year it picks the best length of the past ten years and trades it from the first session of the following year. From 2004 to 2026 this makes a chain of 23 forward periods, in which position and capital carry on across the year boundaries.
The result drops once more. Instead of 7.7 percent a year, the walk-forward chain earns 5.9 percent, buy and hold 10.8 percent in the same period. The chosen length moved several times: 230 days until 2009, 100 days in 2013 and 2014, between 180 and 250 days later. A parameter that wanders like this does not point to a stable advantage. What the filter delivered was a smoother path, with a largest decline of 24.4 instead of 55.2 percent, but not a higher return.
The same pattern showed up in our measurement of breakouts. In our breakout trading guide, 68.4 percent of 1,472 breakouts in three indices fell back into their range within ten days. A rule that looks simple on a chart often looks very different once every case is counted.
Six mistakes that make a backtest worthless
All six mistakes distort the result, and most of them make it look better than it is. That is why they rarely stand out when you look at the equity curve. A small sample or a rule change can push the result either way. If you do not search for them actively, you often notice them only in live trading.
1. Overfitting: the strategy fits only the past
Overfitting, also called curve fitting, is fitting a strategy so closely to historical data that it reproduces chance events of the past instead of recurring market patterns. Every extra filter and every extra parameter raises the risk. If you turn the settings long enough, you find a combination that shines for any history. A warning sign is a parameter that only works at one exact value and collapses with small changes.
2. Look-ahead bias in the test setup
Look-ahead bias has the largest effect, as the example above shows. Besides the shifted day there are quieter cases: price series adjusted later, restated company figures, a daily high used as the entry although only the close gave the signal. Test every rule with one question: would I really have known this number at this moment?
3. Survivorship bias: only the survivors in the data
Survivorship bias is a distortion in which only stocks that still exist today enter the test, while failed or removed ones are missing. For stock strategies it appears whenever the selection is built backward from today’s index members. If you test a strategy on today’s S&P 500 members back to 1994, you test on the winners: companies that went bankrupt or were dropped are missing, and with them the bad trades. The historical S&P 500 and SPY held the members of their time, so my index test does not need today’s list. Tests of individual stocks need the members of each period, including the ones that dropped out.
4. Leaving out costs, slippage and dividends
A backtest without costs is an upper limit, not a result. Spread and commission can be known in advance; slippage cannot. It hits stops in fast markets and entries after news hardest. And as the S&P 500 example shows, a missing dividend can turn a losing rule into an apparent winner against buy and hold.
5. Too few trades
Few trades say little, even if the metrics come with two decimal places. Long losing runs also occur in good systems; my example has a run of six. 100 trades can serve as a rough guide, but they are not a statistical minimum. What also matters is the spread of the results, how independent the trades are and whether different market phases are covered. A longer period or a second market helps more than a finer parameter, but does not automatically deliver independent observations.
6. Changing the rules during the test
This mistake happens mostly in manual tests. After three losses, the stop is moved “just this once”, a signal is skipped, an entry taken early. From then on you are no longer testing the strategy but your gut feeling. Every change belongs in a new run that starts from the beginning.
Checking robustness: out-of-sample, walk-forward, Monte Carlo
A good backtest proves nothing as long as it has run only once. Four checks help answer whether a result is a property of the strategy or a property of the chosen period.
- Out-of-sample: hold part of the data back until the end and run the finished strategy there once, without changing anything afterwards.
- Walk-forward: repeat the cycle of setting up and checking over many periods. If the best parameters jump a lot, stability is missing.
- Parameter neighborhood: move the values you found by about ten percent up and down. A robust system then gives similar results, not a single peak.
- Monte Carlo simulation: reorder the trades thousands of times, or draw them again with replacement. Pure reshuffling with a fixed percentage position size changes only the path, the drawdown and the streaks, not the final capital. A range of returns only comes from drawing with replacement, and any dependence between trades is lost.
A Monte Carlo simulation is a method that reorders or redraws the trades of a backtest many times at random to estimate the possible range of drawdown, losing streaks and return. These checks raise the informative value of a test; they do not prove a future edge. What is left after them is usually smaller than the first test promised.
Backtesting software at a glance
The right software depends on two questions: do you want to test by hand or with code, and on which computer? The table sorts well-known tools by method and target group. We have reviewed only TradingView ourselves; the other entries are based on the manufacturers’ own descriptions, with no prices, because they change often.
| Software | Method and target group |
|---|---|
| TradingView | Bar Replay by hand, Pine Script strategies in the strategy report. For chart traders. |
| AmiBroker | Code in AFL, runs on Windows. For portfolio tests with walk-forward. |
| MultiCharts | Code in PowerLanguage, compatible with EasyLanguage; a .NET edition uses C#. |
| Wealth-Lab | Building blocks without code, or C#. For portfolio tests. |
| QuantConnect | Python or C# in the cloud. For quant developers. |
| ProRealTime | ProBacktest for rules directly on the chart. |
| NinjaTrader | NinjaScript (C#), Strategy Analyzer and Market Replay; the desktop version needs Windows. For futures traders. |
| TrendSpider | Strategy tester without code. For a first step into system tests. |
If you are still choosing a charting platform, compare more than the backtester. Our comparison of TradingView alternatives looks at MetaTrader 5, cTrader, TrendSpider and others as complete platforms, including data and costs.
Backtesting for free: what works without a license
For a start, free software is enough. Bar Replay in TradingView runs on the free plan on daily bars and higher; the limits per plan are in the TradingView plan comparison. QuantConnect offers a free backtesting node with limited use according to its documentation on backtesting nodes, and the LEAN engine itself is open source and also runs locally. Your own Python test costs nothing as long as freely available data and your own computer are enough. Costs can arise for data, larger computing resources and certain platform features.
Pros and cons of backtesting
Backtesting is the cheapest lesson in trading, as long as you know its limits. The overview puts both sides next to each other, the way they showed up in my worked example on SPY.
What speaks for backtesting
- Ideas die cheaply: a rule that did not hold even in the past costs you time in the test, not money.
- Figures instead of feelings: win rate, profit factor and drawdown show how the strategy did in the tested period, including the losing streaks.
- Decades in minutes: an automatic test runs 32 years of SPY with 25 variants faster than a single trade lasts.
- Preparation for losing runs: if you have seen six losses in a row in the test, you know such phases as a possibility before they happen live.
Where backtesting reaches its limits
- The past is no promise: the best filter from 1994 to 2012 was behind SPY buy and hold on 99.8 percent of the days afterwards.
- Errors make it prettier: look-ahead bias, overfitting, missing costs and missing dividends improve the result and therefore rarely stand out.
- Execution is missing: no test fully models slippage, price gaps and partial fills.
- Psychology is missing: in the test, a loss costs no nerves. Whether you stick to the rule live only shows in the forward test.
From backtest to live trading
A passed backtest is an admission ticket, not a free pass. Between the test and real money come two stages. First the strategy runs in paper trading, with simulated orders at real-time prices. How long depends on how often it signals: first you check signals and execution, and for reliable metrics you need enough new trades. Then follows a phase with a small position size and a loss limit set in advance that you can afford.
In both stages, every trade belongs in a journal. Only then can you compare whether win rate and average win in real trading roughly match the test. Differences can come from the test setup, the execution, chance or changed market conditions.
Conclusion: a backtest is only as good as its setup
Backtesting is indispensable, because it sorts out ideas before they cost money. My S&P 500 example also shows how far a result moves when only the test setup changes: 18.6 percent with look-ahead bias, 7.7 percent clean with a fixed SMA 230 chosen in hindsight, and 5.9 percent when the length is chosen again each year using only earlier data. And without dividends, the filter even seemed to beat buy and hold in the period it was chosen on. Same basic rule, same prices.
A test becomes reliable through what comes after the first result. An untouched out-of-sample part, realistic costs, the right benchmark, enough trades and a forward test in a demo account. If you follow these steps, you rarely get spectacular numbers. Instead you get a historical evaluation you can follow step by step, with assumptions you can keep checking in the forward test. I give little weight to a backtest return as long as I have not seen the out-of-sample part and the cost assumption.
This is educational content, not investment advice. The S&P 500 example describes past prices under the stated assumptions. It is not a trading signal, and past results do not guarantee future results.
Frequently asked questions about backtesting
What is backtesting?
Backtesting is testing a trading strategy on historical price data, as if the rest of the price history were still unknown. At the end you have metrics such as win rate, profit factor and maximum drawdown. They describe the past and do not prove a future result.
How do I backtest my trading strategy?
Write your rules so precisely that two people would take the same trade, then test them on data you did not use to build them. Choose market, time frame and period, keep an out-of-sample part back, run the test bar by bar or in code, subtract costs and compare the result with buy and hold.
Can I backtest for free?
Yes, for a start. Bar Replay in TradingView works on daily bars on the free plan, QuantConnect allows backtests on its free tier, and your own Python test needs no license. Costs can arise for data, larger computing resources and certain platform features.
Can ChatGPT backtest a trading strategy?
An AI chat tool can write backtest code for you, but it does not replace the checks. If the tool can run code, it can execute that code on a data file you provide. Have the code and its assumptions independently reviewed for look-ahead bias, costs and dividends, and keep an out-of-sample part, exactly as with code you wrote yourself.
How many trades does a meaningful backtest need?
There is no fixed number. 100 trades are a rough guide. What also matters is the spread of results, independent observations and different market phases. With few trades, chance and single outliers drive the result.
What is the difference between a backtest and a forward test?
The backtest checks a strategy on past prices whose outcome is already in the data series. The forward test checks it in real time on new prices, usually in a demo account or with paper trading, and also shows whether you can follow the rules under time pressure.
What is overfitting in backtesting?
Overfitting is fitting a strategy too closely to historical data. The rules then reproduce chance events of the past and often fail on new data. An out-of-sample test and a walk-forward analysis help to detect it.
This US edition is based on our German edition on kagels-trading.de and has been adapted for US readers.