
Position Sizing in Trading: Formula, Calculator, Examples

Contents
- Position sizing in 30 seconds
- What is position sizing?
- Risk is not the position size: the 1% rule explained
- The position sizing formula with a worked example
- Position size calculator
- Position sizing for forex and futures
- Three ways to size a position
- Total risk across all open positions
- The 3-5-7 rule and why I do not use it
- How much capital do you need?
- Position sizing in a spreadsheet
- Win rate, reward-to-risk and expected value
- Mistakes that break position sizing
- Conclusion: the size decides, not the entry
- Frequently asked questions about position sizing
- About the author
Most traders I have seen fail did not have an analysis problem, they put too much money on single trades. Their entries were often right. But one trade at the wrong size can wipe out months of careful work, and the way back is steeper than most expect.
I have been trading since 1980, and this guide shows how I size my positions today. You get the formula, a calculator for your own numbers, the 1% rule as it is really meant, examples for stocks, forex and futures, and the mistakes that break even good rules. It follows our editorial policy.
Position sizing in 30 seconds
- What it is: position sizing decides how many shares, lots or contracts you trade, so that a stop filled at its price costs your planned amount, before costs.
- The formula: position size = risk amount ÷ distance from entry to stop. On $100,000 with 1% risk and a $7 stop distance, that is 142 shares.
- The 1% rule: plan to lose at most 1 percent of your account per trade. Risk means the planned loss to the stop, not the amount you invest.
- Total risk: also cap the risk of all open trades together. At 1% per trade and a 5% budget, at most five positions are open.
- Methods: fixed dollar amount, fixed percentage of the account, or a size based on volatility. The fixed percentage is the most common.
- The costliest mistake: getting bigger after losses. After a 25 percent drawdown, you need a 33 percent gain just to get back to zero.
What is position sizing?
Position sizing is the process of deciding how many shares, lots or contracts to trade, based on your account size, the risk you accept per trade and the distance to your stop-loss.
The difference to chart analysis is simple. The chart tells you whether to enter. Position sizing tells you how much. The two questions are independent, and the second one decides the account result more often than the first.
Position sizing is also called money management, and it has two goals that seem to contradict each other. It should protect you from large losses and still let winners run. If you only follow the first goal, you trade so small that nothing is left after costs. If you only follow the second, you do not survive the first serious losing streak.
Risk management and position sizing work together but answer different questions. Risk management looks at the single trade and your behavior: where the stop goes, how large a loss may get, how you handle a drawdown. Position sizing works one level up, on the account as a whole: how much goes into each trade and how many trades may be open. The rules for stops, leverage and psychology are in the guide to risk management in trading, and the upper limit from theory is covered in the article on the Kelly criterion.
Risk is not the position size: the 1% rule explained
The 1% rule says that a trader plans to lose at most 1 percent of the account on a single position, measured as the loss from the entry to the stop-loss price, not as the amount invested.
This is where most explanations online take a wrong turn. Risked capital and invested capital are two different amounts. The investment is the money in the position. The risk is the part you plan to lose if the stop fills at its price; a gap can make the real loss larger.
An example shows how large the gap is. On a $100,000 account at 1 percent risk, your planned loss is at most $1,000. You buy a stock at $113 with a stop at $106, so you risk $7 per share. For $1,000 of risk you buy 142 shares, and they cost $16,046. The position is 16 percent of the account; the risk is just under 1 percent.
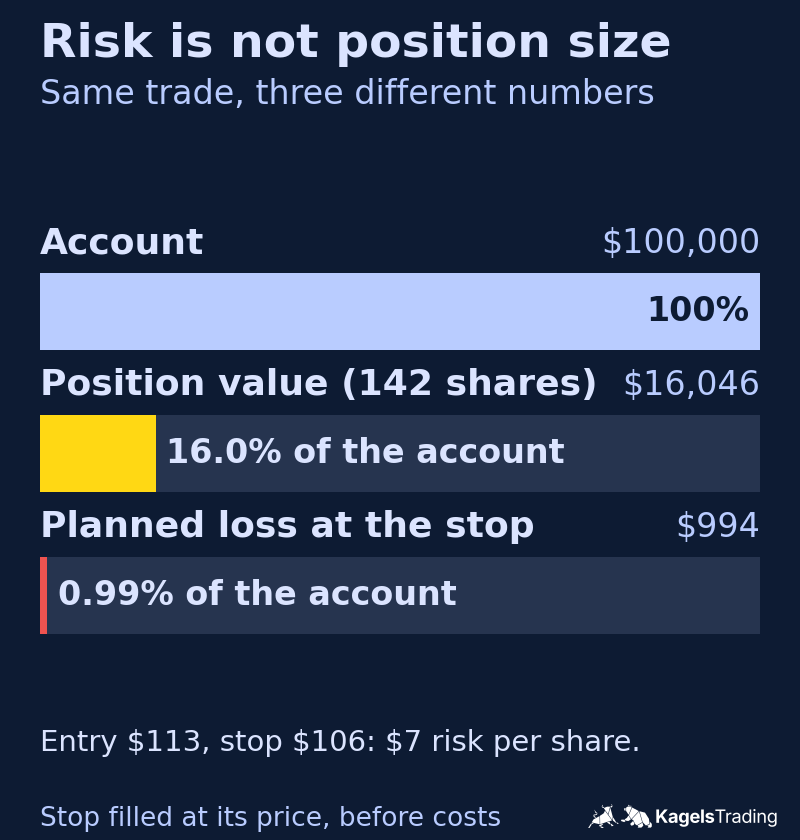 Click to enlarge
Source: Kagels Trading, own calculation.
If you confuse risk and investment, your numbers are off by a factor of five to twenty. With typical stop distances of 5 to 20 percent, the position is five to twenty times the risk amount. A trader who invests only 1 percent of the account trades far too small; one who uses no stop at all has the whole position at risk.
The position sizing formula with a worked example
Position size equals the risk budget for the trade divided by the distance between entry and stop-loss. The result is the number of shares or units at which a stop filled at its price produces the planned loss, before costs.
The formula has only two inputs, and both are known before you enter. The risk budget comes from your account size and your percentage. The stop distance comes from the chart. What you do not need is an opinion about how good the trade will be.
| Step | Calculation | Result |
|---|---|---|
| Risk budget | $100,000 × 1% | $1,000 |
| Risk per share | $113 − $106 | $7 |
| Position size | $1,000 ÷ $7, rounded down | 142 shares |
| Position value | 142 × $113 | $16,046 |
| Planned loss at the stop | 142 × $7 | $994 = 0.99% |
Always round down, never up. Rounding to 143 shares would push the risk to $1,001 and break the rule by a dollar; on larger trades the gap grows. The real risk of 0.99 percent stays just below the limit.
Position size calculator
Enter your account size, your risk per trade, the entry and the stop. The calculator shows the number of shares, the risk budget, the planned loss at the stop and the position value. A stop below the entry means a long trade, a stop above it a short trade. The preset values are the example from above.
Position size, long trade
142 shares
| Risk budget | $1,000 |
|---|---|
| Risk per share | $7 (6.19% from entry) |
| Planned loss at the stop | $994 (0.99% of the account) |
| Position value | $16,046 (16.0% of the account) |
The planned loss assumes the stop fills exactly at its price, before costs. Gaps and fast markets can fill it worse, and commissions come on top.
For stocks, ETFs and other assets traded in whole units, in your account currency. For forex and futures, use the formulas in the next section. Not investment advice. Nothing you enter is stored or sent.
When you try it, you see how strongly the stop distance drives the size. Move the stop from $106 to $110 and the risk per share drops to $3: the calculator now allows 333 shares worth $37,629 for the same $1,000 risk. A tighter stop is only better if the chart supports it, otherwise it just gets hit more often.
Position sizing for forex and futures
In forex and futures, the stop distance is measured in pips or points, so the formula needs one more number: what one pip or point is worth. The logic stays the same: risk budget divided by the loss per unit at the stop.
For forex, the formula is lots = risk budget ÷ (stop in pips × pip value per lot). For pairs with the US dollar as the second currency, such as EUR/USD, one pip on a standard lot of 100,000 units is worth $10. With a USD account of $10,000, 1 percent risk and a 25-pip stop, that is $100 ÷ (25 × $10) = 0.4 lots. For other pairs, the pip value changes with the exchange rate, so check it in your platform.
For futures, the formula is contracts = risk budget ÷ (stop in points × point value). The Micro E-mini S&P 500 is worth $5 per index point. With $10,000, 1 percent risk and an 8-point stop, that is $100 ÷ (8 × $5) = 2.5, so 2 contracts, or a planned loss of $80. Check the broker’s margin for the contract as well. The full E-mini contract is ten times larger at $50 per point, which already needs a much bigger account for the same stop.
Three ways to size a position
There are three common models, and they differ in what stays constant. A fixed dollar amount keeps the risk the same in money, a fixed percentage keeps it the same relative to the account, and a volatility-based size keeps the market’s typical movement in view.
With a fixed dollar amount, every trade risks the same sum, for example $200. It is easy to use, but it does not adapt: after a run of losses, $200 is a larger share of a smaller account, and after gains it becomes too cautious. It suits the first months, when the account barely changes. Over time, the fixed percentage works better.
With a fixed percentage, you always risk the same share of the current balance. If the account has dropped to $43,000 after some losses, 1 percent means $430 on the next trade. The big advantage: the risk shrinks automatically in a drawdown and grows again only after new highs.
With volatility-based sizing, the stop distance comes from the market’s typical range. A common measure is the ATR (Average True Range). In calm markets the stop is closer and the position larger; in wild markets the stop is wider and the position smaller. I combine this with the fixed percentage: the stop comes from the chart and the volatility, the size from the formula.
The honest limit of chart-based stops: in very volatile phases, a sensible stop is so far away that the position becomes tiny. Then the trade is often simply not tradable, and that is a valid answer. Raising the risk to make the trade “worth it” is the wrong one. How much the Kelly criterion would allow, and why that is far too much, is a separate calculation in the article linked above.
Total risk across all open positions
A limit per trade is not enough once several positions are open at the same time. That is why a second limit comes in: the total risk budget. If you set it at 5 percent and risk 1 percent per trade, at most five positions can be open.
The total budget decides how deep a bad phase can go. At 5 percent total risk, five full losing rounds in a row take the account down about 22.6 percent. That is the point where a professional stops and reviews the method. At 10 percent total risk, two to three such rounds are enough to reach the same depth.
Correlation counts against the budget too. If you are long EUR/USD and short USD/CHF, you have not placed two bets but one double bet against the US dollar. Positions that move together should be counted as one larger position in the total risk.
The 3-5-7 rule and why I do not use it
The 3-5-7 rule is a rule of thumb from trading websites, and its versions do not agree. In both versions I checked, the 3 is the maximum risk per trade and the 5 the total risk of all open trades, counted to their stops. The 7 differs: at DayTrading.com, your average winner should be at least 7 percent larger than your average loser, a ratio of about 1.07 to 1; at MetroTrade, it is a profit target of 7 percent of the account.
The idea behind it is right: limit the single trade, the total risk and the relation of wins to losses at the same time. I still think the numbers are too high for most private accounts. Three percent per trade means more than 11 percent drawdown after four losses in a row. On a $10,000 account, there is no reserve for that.
My recommendation stays at 1 percent per trade and 5 percent in total. If you trade rarely, very selectively and have a win rate proven over years, you can go to 2 percent. Three percent is a number for accounts whose loss would not touch your life plans.
How much capital do you need?
The most common beginner question is whether the account is big enough. The table applies the 1% rule to typical account sizes, each with a stop 2 percent below the entry. The position column shows how much money is really in the trade.
| Account | Risk 1% | Position |
|---|---|---|
| $2,000 | $20 | $1,000 |
| $10,000 | $100 | $5,000 |
| $25,000 | $250 | $12,500 |
| $100,000 | $1,000 | $50,000 |
The honest part is what these numbers mean in practice. Whether 1 percent works depends on the instrument, its minimum size, the stop distance and your costs, not on a fixed account size. On $2,000, you may risk $20. A commission of a few dollars per order, plus the spread, eats a large part of that before the market has moved at all. Small accounts do not fail because of the rule but because of the fixed costs per trade.
Below about $10,000, there are two honest ways forward. Either trade instruments with very small minimum sizes, such as fractional shares or micro futures (check their margin and the smallest possible stop loss), or keep saving and practice with a demo account first. What you should not do is raise the risk to 5 percent so that the trade “pays off”.
Position sizing in a spreadsheet
Calculating sizes in your head works until things get hectic. A spreadsheet does the math and records the decision at the same time. I have used a simple table for years; Excel, Google Sheets or LibreOffice all work.
The table needs one row per trade with price, stop, direction and account size. For a mixed list of long and short trades, a column for the direction (“L” or “S”) lets the formulas handle both cases. With price in column B, stop in C, direction in D, and two named cells called “account” and “risk”:
- Column E, risk in percent of price:
=IFERROR(IF(D11="S",1-(C11/B11),(C11/B11)-1),0) - Column F, risk per share:
=IF(D11="L",B11-C11,C11-B11) - Column G, number of shares:
=ROUNDDOWN(account*risk/F11,0)
Watch the direction column for typos. Excel ignores upper and lower case in this comparison, so “s” works like “S”. A typo such as “SS” or a trailing space does not: column E then treats the trade as a long and column F as a short, and both numbers look plausible. A data validation rule that only allows L and S prevents this.
A sizing sheet is not a trading journal. For the review over many trades, meaning win rate, profit factor and the drawdown curve, use a proper journal. The guide to the trading journal shows what to record, and the trading journal software comparison shows which tools do it for you.
Win rate, reward-to-risk and expected value
Position sizing limits losses, but the result over a year also depends on how much you make on your winners. Three numbers belong together: the win rate, the reward-to-risk ratio and the expected value per trade.
Expected value = win rate × average win − loss rate × average loss. On a $10,000 account with 1 percent risk, a 40 percent win rate and a reward-to-risk of 1.75, the average win is $175 and the average loss $100. That gives 0.40 × $175 − 0.60 × $100 = $10 per trade.
Ten dollars sounds small, and it is. That is exactly why the number is useful: it shows how thin the margin is under realistic assumptions and how quickly commissions and slippage eat it. A negative expected value cannot be fixed by any position size, only by a better strategy. Before you rely on any of these numbers, measure them with backtesting.
Mistakes that break position sizing
The formulas in this article are simple, keeping to them is not. Four habits make traders break their own rules, and all four feel reasonable in the moment. The good news: each one has a simple countermeasure, and each one shows up in a journal.
- Moving the stop: as the price approaches the stop, the trade is declared “temporarily down” and the stop is moved or removed. A planned 1 percent loss becomes a loss without a floor. Keep the stop as a real order in the market; deleting it then takes an extra step, and that pause is often enough.
- Averaging down: adding to a losing position lowers the average entry and makes the trade look better on paper. In fact it raises the risk exactly where your analysis was already wrong. A planned 1 percent loss quickly becomes 2 or 3 percent.
- Sizing up after losses: after a few losses, the urge to win it all back with a bigger trade is strong. A daily loss limit of 2 to 3 percent takes the decision away from you at the moment you can no longer make it well.
- Anchoring to your entry: the entry price feels like the “fair” price, and you wait for a return to it. The market does not know your entry. The only useful question is whether you would open this position today, at today’s price.
Conclusion: the size decides, not the entry
After almost five decades in the markets, I am convinced that the gap between the winning minority and the losing majority is rarely better analysis. It is the question of how much money goes into a single opinion. You can learn entries in weeks; the discipline to get smaller after three losses takes years.
If you take three things from this article, take these. Risk is the loss to the stop, not the investment, and the two differ by a factor of five to twenty. The position size is calculated, not guessed: risk amount divided by stop distance, rounded down. And a daily loss limit protects you on bad days better than any formula, because it takes you out of the market before emotions take over.
Frequently asked questions about position sizing
How do you calculate position size?
Divide your risk budget by the distance between entry and stop-loss. On a $50,000 account at 1 percent risk, you have $500. With an entry at $80 and a stop at $76, the risk is $4 per share, so you buy 125 shares worth $10,000. Both inputs are fixed before the entry: the budget from your account size, the stop from the chart.
What is the 1% rule in trading?
The 1% rule says you plan to lose at most 1 percent of your account on a trade, measured as the loss to the stop-loss price. On $20,000 that is $200. It is not the amount you invest: with a stop 2 percent below the entry, that risk allows a position of about $10,000, half the account. Mixing up risk and investment is the most common position sizing mistake.
What is the 3-5-7 rule in trading?
The 3-5-7 rule is a rule of thumb from trading websites: at most 3 percent risk per trade and 5 percent total risk across all open trades. The 7 depends on the source: winners on average at least 7 percent larger than losers, or a profit target of 7 percent of the account. The structure makes sense, but 3 percent per trade is high for most private accounts: four losses in a row already mean more than 11 percent drawdown.
How big should my position be with a $10,000 account?
At 1 percent risk, a $10,000 account allows a planned loss of $100 per trade. With a stop 2 percent below the entry, that means a position of about $5,000. Commissions and spreads take a noticeable part of the $100, so instruments with small minimum sizes, such as fractional shares or micro futures with a stop that fits, or a broker with low fixed costs help. Raising the risk to make the trade worthwhile does not.
Is money management the same as position sizing?
In trading, the two terms are often used for the same thing: deciding how much capital goes into each trade. Money management sometimes also covers the total risk of all open positions and how the account grows over time. Risk management is the wider frame around it, with stops, leverage and psychology.
Should I average down on a losing trade?
No, averaging down raises the risk in exactly the position your analysis has already proven wrong. The average entry price falls and the trade looks better on paper, but a planned 1 percent loss quickly becomes 2 or 3 percent. The rule “cut losses, let winners run” is turned upside down.
This English edition is based on our German edition on kagels-trading.de and has been adapted for international readers.
More Risk Management guides
- Manage your trading risk
Risk Management in Trading: Rules, Math, Psychology
The 1% rule, stops, risk/reward, daily loss limits, leverage caps and the psychology of losing streaks, with the math behind each rule.
- Size your risk per trade
Kelly Criterion for Traders: Formula, Calculator, Risks
The Kelly formula for traders with a calculator, and a simulation of why full Kelly is far too much.
- Keep a trading journal
Trading Journal: How to Record and Review Your Trades
What to write before and after each trade, a completed example with a win and a loss, a weekly review and a template to copy.
- Choose a journal
Best Trading Journal Software 2026: 6 Tools Compared
Six journals compared on price, free plans, refunds, automatic broker sync, costs and export, with a decision guide.
- Check TradeZella
TradeZella Review 2026: Pricing, Features and Limitations
The three plans since July 2026, what Essential leaves out, the no-refund terms, imports, export and what users report.
- Check TraderSync
TraderSync Review 2026: Pricing, Broker Sync and Limits
Prices and the yearly sale, which of 502 brokers really sync automatically, Market Replay, Cypher and the no-refund policy.
- Check Tradervue
Tradervue Review 2026: Imports, Reports and Costs
Silver or Gold, why net P&L needs Gold, automatic import for 5 of 82 brokers, US-only stocks and how cancelling works.
- Check Edgewonk
Edgewonk Review 2026: Features, Costs and Limitations
One plan at $197 a year with a 14-day refund, MetaTrader auto sync, the psychology tools, and screenshots from our own test journal.