
Fundamental Analysis: 12 Ratios, a Worked Example, 5 Steps


Contents
- Fundamental analysis in 30 seconds
- What is fundamental analysis?
- How fundamental analysis works
- The twelve key ratios of fundamental analysis
- Worked example: all twelve ratios for Microsoft
- Fundamental analysis in practice: five steps
- Tools and data sources for fundamental analysis
- Fundamental analysis vs technical analysis: what and when
- A short history of fundamental analysis
- Fundamental analysis in forex, commodities and crypto
- Advantages and limits of fundamental analysis
- Conclusion: start with one company
- Frequently asked questions about fundamental analysis
- About the author
A share price tells you what a stock costs, not what the business is worth. Fundamental analysis closes that gap. It reads the balance sheet, the income statement and the cash flow statement and turns them into an estimate of value that you can hold against the price.
This guide walks you through the twelve ratios that matter, each with its formula and a rule of thumb. Then we calculate all twelve with real numbers: Microsoft’s annual report for the year to June 2026 and its closing price on November 10, 2026. You also get a five-step process, a comparison with technical analysis and an honest look at what AI tools can and cannot do here. This article follows our editorial policy.
Fundamental analysis in 30 seconds
- The idea: estimate what a company or asset is worth from economic data, then compare that value with the market price.
- The signal: a price well below the estimate may mean the stock is undervalued; a price well above means you pay for expectations.
- The tools: ratios such as P/E, P/B, price to cash flow, the PEG ratio, equity ratio, dividend yield and margins. None of them works alone as a buy signal.
- Two routes: top-down (economy, then sector, then company) and bottom-up (company first, then sector and economy).
- Who uses it: long-term investors cannot do without it; many traders combine it with chart analysis to choose what to trade and when.
- AI helps, but checks stay yours: tools such as ChatGPT, Claude and Perplexity speed up reading, but they can get numbers wrong.
- The origin: Benjamin Graham and David Dodd laid the foundation with “Security Analysis” in 1934. Graham’s best-known student is Warren Buffett.
What is fundamental analysis?
Fundamental analysis is a method of valuing stocks and other assets from economic data such as financial statements, with the aim of estimating their intrinsic value and comparing it with the market price.
The approach rests on two assumptions. First, every listed company has an intrinsic value that comes from its business model, its assets, its earnings and its prospects. Second, prices move toward that value over the long run. In the short run, news, fear and greed push prices around; over years, the business results tend to win.
Fundamental data covers everything that tells you about a company’s economic health. That includes the numbers in the financial statements, but also qualitative factors such as the business model, the quality of management and the company’s position against its competitors.
Fundamental analysis asks a different question from technical analysis. Chart analysis looks at price and volume and asks where the price is likely to go. Fundamental analysis asks what the business is actually worth. The section on the two approaches compared shows how traders use both.
How fundamental analysis works
There are two routes to the same goal, and they start at opposite ends. Both end with a view on one company, but they differ in what you look at first: the economy or the business.
Top-down: from the economy to the company
The top-down approach starts with the big picture. You first look at the economy: growth, interest rates and inflation. Then you pick the sectors that should do well in that setting, and only then do you study the companies inside those sectors.
For beginners, top-down often feels more natural, because it works with things you hear about every day. A cut in interest rates, rising commodity prices or a change in trade policy are easier to judge than a balance sheet. Our guide to sector rotation shows how to follow money moving between sectors with ratio charts.
Bottom-up: from the company to the economy
The bottom-up approach reverses the order. You study the financial statements, the ratios and the business model of one company before you look at its sector and the economy. The idea behind it: an outstanding company can do well even in a weak industry or a slow economy.
Most professional analysts and portfolio managers work bottom-up. The usual order is the business first, then the finances, and the valuation last, so that the current share price does not color the analysis. Rule-based methods such as CAN SLIM combine both sides and demand that earnings and the chart confirm each other.
Quantitative and qualitative analysis
Whichever route you take, you work with two kinds of information. The quantitative side uses numbers from the financial reports: the P/E ratio, the equity ratio, cash flow. These are objective and can be compared across companies.
The qualitative side covers what no balance sheet shows. How strong is the business model? Does the company have a lasting competitive advantage, an economic moat, for example through patents, network effects or a strong brand? How capable is management? Only when both sides point the same way do you have a solid judgment.
The three financial statements
Every listed company publishes three core financial statements, and almost every ratio comes from them. In the United States they are part of the annual report on Form 10-K and the quarterly Form 10-Q, which are free on the SEC’s EDGAR database.
- The balance sheet: assets, liabilities and shareholders’ equity on one date. It feeds the price-to-book ratio and the equity ratio.
- The income statement: revenue against costs over a period, down to net income. It feeds the P/E ratio, the price-to-sales ratio and the operating margin.
- The cash flow statement: the cash that actually came in and went out, split into operating, investing and financing activities. Cash is harder to shape with accounting choices than profit, which is why many analysts trust price to cash flow more than the P/E ratio.
The twelve key ratios of fundamental analysis
Ratios make companies comparable, but no single ratio is enough for a decision. Only together, and compared with peers in the same industry, do they give a useful picture. The values in the third column are common screening examples, not limits: what counts as cheap depends on growth, risk, interest rates, accounting and the comparison group.
| Ratio | Formula | Rule of thumb |
|---|---|---|
| P/E ratio | Share price ÷ earnings per share | compare with peers and the stock’s own history |
| Price to book (P/B) | Share price ÷ book value per share | below 1 may mean undervalued |
| Price to sales (P/S) | Share price ÷ revenue per share | lower is cheaper |
| Price to cash flow (P/CF) | Share price ÷ operating cash flow per share | below the P/E is a good sign |
| PEG ratio | P/E ÷ earnings growth in % | below 1 is often read as cheap for the growth |
| Equity ratio | Equity ÷ total assets × 100 | higher is more stable |
| Dividend yield | Dividend per share ÷ share price × 100 | depends on the sector; check very high values |
| Operating margin | Operating income ÷ revenue × 100 | only meaningful against peers |
| Return on equity (ROE) | Net income ÷ average equity × 100 | above 15% is a common screen |
| Return on assets (ROA) | Net income ÷ average total assets × 100 | depends on the sector |
| Liabilities to equity | Total liabilities ÷ equity × 100 | compare with peers; check what is included |
| Payout ratio | Dividend per share ÷ earnings per share × 100 | 30 to 60% is a common screen |
You do not have to calculate these ratios yourself, but you should know what is behind them. Stock screeners and data sites show them ready-made. Knowing the formula tells you when a number is distorted, for example by a one-off gain, a buyback or a different fiscal year.
P/E ratio (price to earnings)
The P/E ratio tells you how many years of current earnings you pay for with today’s share price. It is the best-known ratio in fundamental analysis and often the first look at a stock.
Formula: share price ÷ earnings per share
Example: a stock costs $100 and the company earns $10 per share, so the P/E is 10. There is no universal fair P/E. The number means little without its industry, the company’s growth and the level of interest rates: a P/E of 40 can be reasonable for a fast-growing software company and a warning sign for a steelmaker.
P/B ratio (price to book)
The price-to-book ratio compares the share price with the book value of equity per share.
Formula: share price ÷ book value per share
Example: book value is $50 per share and the stock trades at $75, so the P/B is 1.5. A P/B below 1 means the stock costs less than the equity on the books, which can point to undervaluation. For software and other asset-light companies the ratio says little, because their book value hardly reflects what the business is worth.
P/S ratio (price to sales)
The price-to-sales ratio is the tool for companies that do not make a profit yet. It relates the share price to revenue per share, so it still works when earnings are negative or distorted by one-off items.
Formula: share price ÷ revenue per share
Start-ups and fast-growing companies often lose money because they invest heavily. Their P/E ratio would be negative and therefore useless. The P/S ratio still lets you compare the valuation. How this looks for companies without a listed share is shown in our OpenAI stock guide, which compares revenue multiples.
P/CF ratio (price to cash flow)
Price to cash flow works like the P/E ratio, but uses operating cash flow instead of accounting profit.
Formula: share price ÷ operating cash flow per share
Example: a stock costs $120 and operating cash flow is $20 per share, so the P/CF is 6. The advantage: cash flow is harder to shape than profit. Depreciation, provisions and other accounting choices change earnings, while cash flow shows the money that actually moved. The Microsoft example shows why you should also look at free cash flow.
PEG ratio
The PEG ratio adds expected earnings growth to the P/E ratio, the one thing the P/E leaves out. It was made popular by the fund manager Peter Lynch and suits growing companies best.
Formula: P/E ÷ expected annual earnings growth in %
Example: a P/E of 16 and expected growth of 18.4% give a PEG of 0.87. A PEG below 1 suggests the stock is cheap for its growth, above 2 is usually seen as expensive. A company with a P/E of 30 that grows 35% a year suddenly looks cheap on the PEG. The weak spot is the growth forecast itself.
Equity ratio
The equity ratio shows what share of a company’s total assets is financed with its own capital.
Formula: shareholders’ equity ÷ total assets × 100
The higher the ratio, the less the company depends on lenders and the better it can survive a crisis. A very low ratio points to high debt. Healthy levels differ widely: banks work with low equity ratios by nature, industrial companies usually with higher ones.
Dividend yield
The dividend yield tells you how much cash you receive each year relative to the share price.
Formula: annual dividend per share ÷ share price × 100
Example: a company pays $4 a year on a $80 share, so the yield is 5%. What counts as normal depends on the sector. A very high yield is often a warning: the price may have fallen because the market expects a dividend cut. Always check it against the payout ratio below.
Operating margin (and EBIT margin)
The operating margin shows how many cents of operating profit a company keeps from each dollar of revenue.
Formula: operating income ÷ revenue × 100
The margin is most useful against peers and over several years. If it rises, the company earns more from its core business. If it falls, look for the cause: pricing pressure, higher costs or a shift in the business mix. Many analysts use EBIT (earnings before interest and taxes) instead; it can differ from operating income because it may include non-operating gains and losses.
Return on equity (ROE)
Return on equity measures the profit a company earns on its shareholders’ capital.
Formula: net income ÷ average shareholders’ equity × 100 (start and end of the year)
Many investors use an ROE above 15% as a screen for a strong business. In his 1979 letter to shareholders, Warren Buffett called a high earnings rate on equity capital “the primary test of managerial economic performance”. But a high ROE on very thin equity, for example after large buybacks, can flatter a company. More on his approach in our Warren Buffett profile.
Return on assets (ROA)
Return on assets relates profit to everything the company owns, financed by equity and debt alike.
Formula: net income ÷ average total assets × 100 (start and end of the year)
ROA also counts the assets financed by creditors, so it is harder to flatter with debt than ROE. Financing costs and changes in the asset base still affect it. Compare it only within one industry: a bank and a software company have completely different asset bases.
Liabilities to equity (and debt to equity)
Liabilities to equity sets everything a company owes against its shareholders’ equity.
Formula: total liabilities ÷ shareholders’ equity × 100
Total liabilities are more than borrowing. They include accounts payable, deferred revenue from customers who paid in advance and tax liabilities. The narrower debt to equity ratio uses only interest-bearing debt, which shows how much the company depends on lenders when rates rise. Data sites use both versions, and some add leases, so check which one you see and compare only like with like.
Payout ratio
The payout ratio shows what share of profit goes to shareholders as dividends.
Formula: dividend per share ÷ earnings per share × 100
A payout between 30 and 60% is often called healthy. Below 30%, the company keeps most of its profit for growth or buybacks. Above about 70%, little is left for bad years, and a dividend cut becomes more likely.
Worked example: all twelve ratios for Microsoft
Rules of thumb only become useful when you apply them to a real company. We took Microsoft’s annual report on Form 10-K for the fiscal year that ended on June 30, 2026 (filed with the SEC on July 29, 2026) and the closing price of $533.16 on November 10, 2026 (daily data from Alpha Vantage). Per-share figures use the 7.453 billion diluted shares from the report; book value uses the 7.426 billion shares outstanding on July 23, 2026. ROE and ROA use the average of the balances at the start and end of the fiscal year; debt is long-term debt including its current portion, without leases.
| Ratio | Microsoft, fiscal 2026 | How it is calculated |
|---|---|---|
| P/E ratio | 29.7 | $533.16 ÷ $17.95 diluted earnings per share |
| Price to book | 8.9 | $533.16 ÷ $59.58 book value per share |
| Price to sales | 12.0 | $533.16 ÷ $44.52 revenue per share ($331.8bn revenue) |
| Price to cash flow | 21.7 | $533.16 ÷ $24.55 operating cash flow per share ($182.9bn) |
| PEG ratio, historical | 0.94 | 29.7 ÷ 31.6% growth in diluted EPS in fiscal 2026 (from $13.64) |
| Equity ratio | 58.3% | $442.4bn equity ÷ $758.4bn total assets |
| Dividend yield | 0.68% | $3.64 dividends declared for the year ÷ $533.16 |
| Operating margin | 46.8% | $155.2bn operating income ÷ $331.8bn revenue |
| Return on equity | 34.0% | $133.7bn net income ÷ $392.9bn average equity |
| Return on assets | 19.4% | $133.7bn net income ÷ $688.7bn average total assets |
| Liabilities to equity | 71.4% | $316.0bn total liabilities ÷ $442.4bn equity (debt alone: $40.3bn, 9.1%) |
| Payout ratio | 20.3% | $3.64 dividends per share ÷ $17.95 earnings per share |
Microsoft is priced as a very profitable company with high expectations. A P/E near 30 and a P/B near 9 mean investors pay a lot for each dollar of profit and book value. In return, an operating margin near 47%, a return on equity of 34% and little interest-bearing debt describe an unusually strong business. Whether the premium is justified depends on future growth and on what peers and interest rates offer, not on a fixed band.
Our PEG of 0.94 looks back, while the classic PEG looks forward. It uses the 31.6% rise in diluted earnings per share in fiscal 2026, not an expected growth rate. Part of that jump came from outside the core business: non-operating income swung from a loss of $4.9 billion in fiscal 2025 to a gain of $10.7 billion in fiscal 2026, while operating income grew 20.8%. Before you trust a low PEG, check whether the earnings growth behind it will repeat.
 Click to enlarge
Source: Microsoft 10-K for fiscal 2026 (SEC), chart by Kagels Trading.
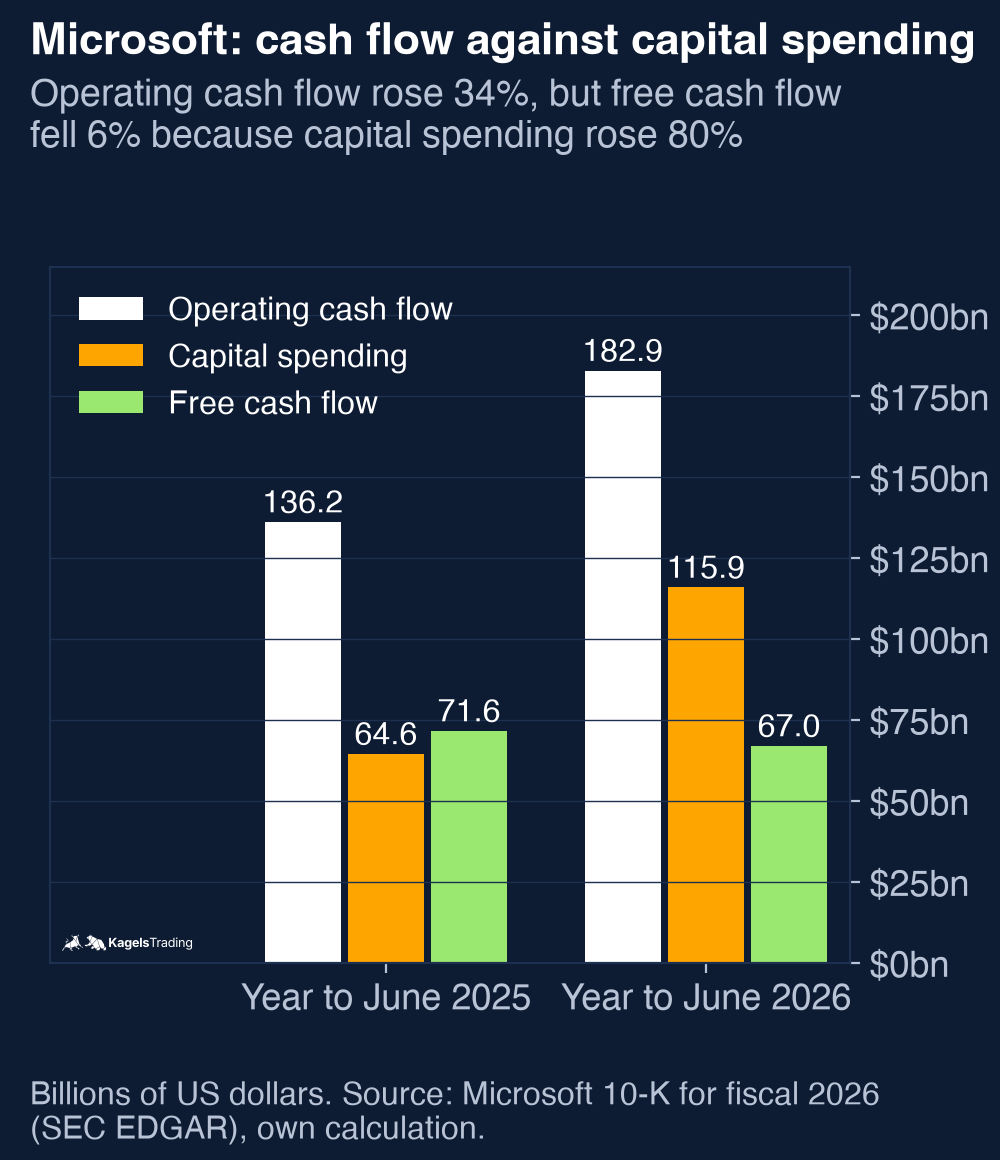
Cash flow tells the most interesting part of the story. Operating cash flow rose 34% to $182.9 billion, which gives a comfortable price to cash flow of 21.7. But Microsoft spent $115.9 billion on property and equipment, mostly data centers, 80% more than a year earlier. Free cash flow fell from $71.6 billion to $67.0 billion, and on free cash flow the stock trades at about 59 times. Whether that spending pays off is the central question for any valuation of Microsoft today, and no single ratio answers it.
Two notes on the dividend and the date. Microsoft declared $0.98 for the quarter to September 2026, up from $0.91, so the annualized yield at the same price is about 0.74%. And the report covers a fiscal year that ended in June; the 10-Q for the quarter to September, filed on October 28, 2026, already contains newer numbers, so trailing figures on data sites will differ from ours.
Fundamental analysis in practice: five steps
This five-step process follows what professional analysts actually do. It works the same way for every stock, from a large cap to a small company, and it keeps the share price out of your view until the last step.
- BusinessRead the reportsStart with the latest 10-K and 10-Q: what the company does, how it makes money, which risks it names.
- BusinessJudge the qualityBusiness model, competitive advantage and management, for example with a SWOT analysis.
- NumbersCalculate and compareThe key ratios against three to five competitors from the same industry.
- ValuationEstimate the valueMultiples of peers, or a discounted cash flow model for advanced users.
- PriceDecideValue against price: buy, wait on a watchlist or look elsewhere.
The valuation comes last on purpose, so that the current share price does not color the analysis.
- Step 1, read the reports: start with the annual report and the latest quarterly report. The “Risk Factors” and “Management’s Discussion and Analysis” sections of a 10-K explain the business in the company’s own words.
- Step 2, judge the quality: check the business model, the competitive advantage and management. Many analysts use a SWOT analysis (strengths, weaknesses, opportunities, threats) to structure this step.
- Step 3, calculate and compare: without a peer comparison, ratios have no context. A P/E of 15 can be cheap or expensive depending on the competitors, and sometimes another company in the group turns out to be the better buy.
- Step 4, estimate the value: the most common method compares valuation multiples with peers. Advanced investors also build a discounted cash flow (DCF) model; our value investing guide works through one and shows how sensitive it is to its assumptions.
- Step 5, decide: if the price is well below your estimate, that may be a buy signal. If it is above, you wait. If you like the company but not the price, it goes on a watchlist.
Tools and data sources for fundamental analysis
Calculating ratios starts with the raw data, and for listed companies most of it is free. The primary source in the US is SEC EDGAR, where every 10-K, 10-Q and 8-K is filed. Most companies also publish their reports and earnings slides on their own investor relations pages.
Free data sites save you the arithmetic. Yahoo Finance and stockanalysis.com show income statements, balance sheets and cash flows for many years, and Morningstar adds its own fair value estimates. To filter a whole market by P/E, growth or dividend yield, use a screener such as the TradingView stock screener or Finviz. If you need the data in your own code, a provider such as Financial Modeling Prep delivers financial statements through an API. For analyst estimates and fair value models in one place, see our InvestingPro review.
AI-supported fundamental analysis
Since 2022, large language models have changed how investors work through company data. They read a long annual report in seconds and answer questions about it in plain language. Three uses stand out.
- Research and summaries: Perplexity offers finance pages with P/E, market value and analyst views, and you can ask for stocks in plain English, for example “tech stocks with a P/E below 20 and revenue growth above 15%”. It also summarizes earnings calls.
- Analysis and understanding: ChatGPT and Claude help you work through a report. Upload a 10-K as a PDF and ask for the key figures, the main risk factors or a SWOT analysis.
- Screening with AI scores: some research tools rank stocks with their own models; our Kavout review shows what such a score contains and where it ends.
AI can invent numbers, so check every figure that matters against the report itself. Language models can return outdated or simply wrong figures with full confidence. Use them as a starting point and confirm every number you base a decision on in the original filing.
Fundamental analysis vs technical analysis: what and when
The two methods answer different questions. Fundamental analysis asks what an asset is worth; technical analysis asks when to buy or sell. They are not opposites; they complement each other.
| Fundamental analysis | Technical analysis | |
|---|---|---|
| Focus | What is it worth? | Where is the price going? |
| Data | Financial statements, economic data | Prices, volume, chart patterns |
| Time horizon | Medium to long term | Any time frame |
| Goal | Estimate intrinsic value | Find entries and exits |
| Typical users | Value investors, position traders | Day traders, swing traders |
| Strength | Grounded valuation | Fast reaction |
| Weakness | Says nothing about timing | Ignores value |
In practice, the line between the two is blurred. Warren Buffett hardly looks at charts. Paul Tudor Jones trades mainly on price and uses the 200-day moving average as his main exit signal. Most traders sit somewhere in between: they use fundamentals to choose what to trade and the chart to decide when. John Murphy’s standard work on the other side is covered in our review of Technical Analysis of the Financial Markets.
At Kagels Trading we trade mainly on charts, but we always know the fundamental calendar. We follow the news, central bank decisions and economic data in forex, commodities and indices, and we adjust our trading to them. Fundamental events move prices whether you like it or not: wars re-rated defense stocks, conflicts in the Middle East move oil, and a single post by a president can move whole indices. If you know the economic calendar, you know when these events are due.
A short history of fundamental analysis
Benjamin Graham and David Dodd laid the foundation of modern fundamental analysis with “Security Analysis” in 1934. Graham’s later book “The Intelligent Investor” (1949) made value investing accessible to private investors and is still a standard work today.
Graham’s best-known student, Warren Buffett, took over the core principles and built one of the most successful investment records in history on them. His approach can be put in one sentence: buy excellent companies at a fair price, and always keep a margin of safety. Our guide to the best trading books lists further classics.
Fundamental analysis in forex, commodities and crypto
Fundamental analysis is not limited to stocks. The data changes with the asset class, but the principle stays the same: estimate the true value of an asset from economic facts.
| Asset class | Sources | What matters |
|---|---|---|
| Stocks | Company reports | Ratios, cash flow, quality of the business |
| Forex and commodities | Central banks, economic data | Rates, growth, inflation, purchasing managers’ indices |
| Crypto | On-chain data, white papers | Network activity, tokenomics, team |
- Forex and commodities: here the fundamentals are monetary policy, growth, inflation and jobs. Our guides to the Fed interest rate decision and the nonfarm payrolls report explain the two biggest US dates. For commodities, inventories, seasonal patterns and geopolitics come on top; the COT report shows how large traders are positioned in the futures markets.
- Crypto: there are no balance sheets in the classic sense. Investors look at on-chain data such as transactions and active addresses, at the tokenomics (supply, issuance and distribution of the coins) and at the quality of the development team. Data platforms such as CoinGecko collect many of these figures.
- Commodity stocks: they combine both worlds, the commodity price and the company’s own costs. Our oil stocks guide compares producers with figures from their own reports.
Advantages and limits of fundamental analysis
Fundamental analysis has clear strengths and equally clear limits. If you know both, you use it where it carries weight and do not rely on it where it is silent by design.
| Advantages | Limits |
|---|---|
| A rational basis for decisions that limits gut feeling and herd behavior | It takes time: reports, ratios and peer comparisons take hours, not minutes |
| Forces you to understand the business before you invest | Ratios describe the past, not the future |
| A view of years instead of days, less exposed to daily noise | Management quality and culture fit into no formula |
| Supported by research (see below) | Two analysts can read the same numbers in opposite ways |
| The raw data is free: every report is public | An undervalued stock can stay undervalued for years |
| Shocks such as pandemics, wars and regulation are not on any balance sheet |
Research supports the approach, with caveats. In “Agnostic Fundamental Analysis Works”, published in the Journal of Financial Economics in 2018, Söhnke Bartram and Mark Grinblatt valued US stocks mechanically from public quarterly accounting data. Buying the stocks that looked cheap against that estimate and selling the expensive ones earned risk-adjusted returns of up to 10% a year.
Joseph Piotroski’s F-score is a second well-known example. It ranks cheap value stocks by nine simple tests of financial strength. A 2017 bachelor’s thesis at Lund University by Bülow replicated it for the US market from 2003 to 2015 and found a market-adjusted return of 18.3% a year for strong companies against 4% for weak ones. That is a single student replication; a discussion paper by Krauss, Krüger and Beerstecher (University of Erlangen-Nuremberg, 13/2015) found that, after liquidity limits and estimated trading costs, the F-score strategies it tested became effectively unprofitable.
Critics point to the efficient market hypothesis. It says that all available information is already in the price, so fundamental analysis could not work. The studies suggest that markets are efficient enough to make it hard, but not so efficient that it is impossible. Costs and discipline decide how much of the edge is left.
Conclusion: start with one company
You do not need a finance degree to use fundamental analysis. If you know where to find the data and which ratios matter in which industry, you have a real advantage over investors who react only to price moves and headlines.
What is missing now is practice. Pick a company you know, download its latest 10-K from EDGAR, and work through the twelve ratios as we did for Microsoft. Compare them with two or three competitors, use an AI tool to help you read, check every number against the report, and form your own view.
Frequently asked questions about fundamental analysis
What does fundamental analysis include?
Fundamental analysis includes quantitative and qualitative information. The quantitative side is the financial statements and the ratios built from them, such as P/E, P/B and cash flow. The qualitative side covers the business model, management and competitive position. For markets as a whole, economic data such as growth, inflation and interest rates comes on top.
What does a fundamental analyst do?
A fundamental analyst estimates what a company is worth. The analyst reads annual and quarterly reports, calculates ratios, compares the company with its competitors and estimates a fair price. On that basis, analysts at banks issue buy, hold or sell ratings.
What is a good P/E ratio to buy a stock?
There is no single good P/E for buying a stock. A low P/E can mean a bargain or a business in decline; a high one can be justified by strong growth. Compare the P/E with the company’s competitors, with its own history and with the growth you expect, and check it against other ratios such as price to cash flow.
What is fundamental data?
Fundamental data is the economic and financial information that drives the value of an asset. For stocks, it is the balance sheet, income statement, cash flow statement and qualitative factors. In forex, it is economic data such as growth, inflation and central bank decisions. In crypto, it is on-chain data and tokenomics.
Is there a formula for fundamental analysis?
There is no single formula. Fundamental analysis combines several ratios, such as P/E, P/B, price to cash flow and the PEG ratio, each of which looks at a different side of the company. Which ratios matter depends on the industry and on your goal.
What is the difference between fundamental and technical analysis?
Fundamental analysis estimates the value of an asset from economic data; technical analysis studies prices and charts to find trends and timing. Many traders combine them, because one answers the “what” and the other the “when”. A good screener can filter by both kinds of criteria at once.
Which app is best for fundamental analysis?
No single app covers everything. For standard ratios, the stock pages of Yahoo Finance or your broker are enough; for screening by several criteria, a screener such as TradingView or Finviz; for independent fair value estimates, Morningstar. No app replaces the annual report itself, because the qualitative factors are only in the original text.
This article is market education, not investment advice. The Microsoft figures show how the ratios work on one date; they are not a recommendation to buy or sell the stock. Prices and reported figures change, so recalculate with the latest filing before you rely on any number.
This US edition is based on our German edition on kagels-trading.de and has been adapted for US readers.
More Markets and Brokers guides
- Open your first account
What Is a Brokerage Account? A US Beginner's Guide
How to open and fund a US brokerage account, cash vs margin, what it costs and what SIPC and FDIC really cover.
- Choose a broker
Interactive Brokers Review 2026: Fees and Platforms
Fees, platforms, investor protection and real futures commissions from a client since 1996.
- Check an offshore broker
PU Prime Review 2026: FCA Warning, Licences and Costs
Which PU Prime company you contract with, what the FCA warning means, and what 1:1000 leverage and the deposit bonus do to your account.
- Check CopyX
CopyX Review 2026: Is TAG Markets Copy Trading Legit?
Who runs the TAG Markets copy trading platform, which regulators warn about it, why US residents are excluded and how fast the 12x Amplify account eats your deposit.
- Understand your price
Market Makers: Who Sets Your Price and How They Profit
How market makers earn on the spread, who sets prices at German trading venues and what the EU ban on payment for order flow changed.
- Size up a bull market
Bull Market: How Long It Lasts and How to Spot the End
When a rise becomes a bull market, how long the 27 completed S&P 500 bull markets since 1928 lasted and gained, and where the current one stands.
- Read bond market stress
MOVE Index: The VIX of the Bond Market, Explained
What the MOVE index measures, which readings signal stress, how it differs from the VIX and where its limits are.
- Read stock market fear
VIX Index: What the Fear Gauge Measures and Normal Levels
What the VIX measures, which levels have been normal since 1990, how closely it tracks the S&P 500 and how VIX futures, options and ETPs work.
- Read market sentiment
Fear and Greed Index: How It Works, Tested Since 2021
How CNN builds its Fear and Greed Index from seven measures, what the zones mean and how the S&P 500 moved after readings below 20.
- Trade an index CFD
Index CFDs at Interactive Brokers: Symbols, Costs and Trading
All 13 IBKR index CFDs, margin, stop and close-out worked through for IBDE40, financing, UK hours and the TradingView limit.
- Size an index future
Micro Futures: MES vs MNQ, Tick Values and Risk
MES and MNQ tick values, a worked sizing example from the stop with costs and slippage, and why margin is not your risk.
- Read the futures curve
Contango vs Backwardation: Futures Curves Explained
What contango and backwardation mean, what rolling does to a position in each case, and real gold, oil and gas curves from 28 October 2026.
- Choose a silver future
Silver Futures: SI vs Micro Silver vs 100-oz SIC
SI, Micro Silver and the 100-ounce SIC compared by tick value, risk per contract, margin and December 2026 deadlines.
- Read the chip sector
SOX Index: Holdings, Weighting and How to Use It
What the SOX holds, how Nasdaq caps the weights, its largest declines since 2004 against the Nasdaq-100 and which ETFs really track it.
- Read the biotech sector
Nasdaq Biotechnology Index: Holdings, Weighting and Risks
What the NBI holds, how Nasdaq caps the weights, its long declines since 2003 against the Nasdaq-100 and which ETFs really track it.
- Read the transport sector
Dow Jones Transportation Average: Stocks and Dow Theory
The 20 stocks in the Dow transport index, why the share price sets their weight, declines since 1992 and what Dow Theory can and cannot tell you.
- Read the French market
CAC 40 Index Explained: All 40 Stocks, Weights and Trading Hours
All 40 CAC 40 stocks, how Euronext caps the weights at 15 percent, trading hours in Eastern Time and how it differs from the DAX.
- Research stocks
InvestingPro Review: Screener, ProPicks AI and WarrenAI
What the InvestingPro screener, ProPicks AI and WarrenAI do, what Pro and Pro+ cost and who needs which plan.
- Judge a stock-picking newsletter
Motley Fool Stock Advisor Review: Cost and Track Record
What Motley Fool Stock Advisor costs after the first year, how the advertised return is calculated, refund and renewal terms, and who it suits.
- Use the free news portal
Investing.com Review: Free Tools, Data and Limitations
What the free Investing.com portal does well, where the quote prices come from and when InvestingPro is worth paying for.
- Find real AI revenue
AI Stocks 2026: How Listed Companies Earn From AI
Which listed companies earn from AI in cloud, software, infrastructure and chips, disclosed AI revenue against hope, plus AI ETFs and risks.
- Compare AI data center suppliers
AI Infrastructure Stocks: 10 Data Center Suppliers Compared
Ten suppliers for power, cooling, servers and optics compared on free cash flow, customer concentration and next dates, with filters and a two-stock comparison.
- Follow an IPO
Anthropic Stock: IPO Date, Valuation and How to Invest
Where the Anthropic IPO stands, how the valuation compares with revenue and how to get exposure before and after the listing.
- Invest in OpenAI before the IPO
OpenAI Stock: Can You Buy It, and Who Owns OpenAI?
Why there is no OpenAI stock yet, who owns OpenAI, where the IPO stands and how much OpenAI you get through Microsoft or SoftBank.
- Understand a stock split
Stock Splits Explained: Forward and Reverse Splits
What forward and reverse splits change and what they do not, the dates that matter, what happens to options and the $1 listing rule.
- Value a stock
Value Investing: Intrinsic Value, Margin of Safety, Traps
Intrinsic value against price, a worked DCF with a sensitivity table, Coca-Cola as a real example, the value premium since 1926 and value traps.
- Value a new listing
SpaceX Stock (SPCX): Valuation, Risks and How to Buy
How to buy SpaceX stock, what the company is worth after the IPO and which risks the lock-up calendar brings.