
ADX Indicator: What Trend Strength Really Tells You


Contents
- ADX in 30 seconds
- What is the ADX indicator?
- How the ADX is calculated
- What the ADX levels mean
- Settings: 14 periods and when to change them
- My test: does a high ADX mean the trend continues?
- How to use the ADX sensibly
- ADX compared with RSI, MACD and ATR
- Advantages and disadvantages of the ADX
- My conclusion: a good thermometer, a poor compass
- Frequently asked questions about the ADX
- About the author
The ADX is the indicator traders reach for when they want to know whether a market is trending at all. It does not say up or down. It says how strong the current directional movement is, on a scale from 0 to 100, and the usual rule is simple: above 25 there is a trend, below 20 there is none.
I wanted to know whether that rule holds up. So I measured, on three US ETFs since 1993, whether a high ADX meant that the market kept moving in the same direction over the following month, and whether the ADX improves the classic crossover of its two directional lines. The result is different from what most guides suggest. This article follows our editorial policy.
ADX in 30 seconds
- What it is: the Average Directional Index measures the strength of a trend, not its direction. It comes with two lines, +DI and −DI, that show which side is stronger.
- Common levels: below 20 the market counts as trendless, above 25 as trending. The usual setting is 14 periods for both parts.
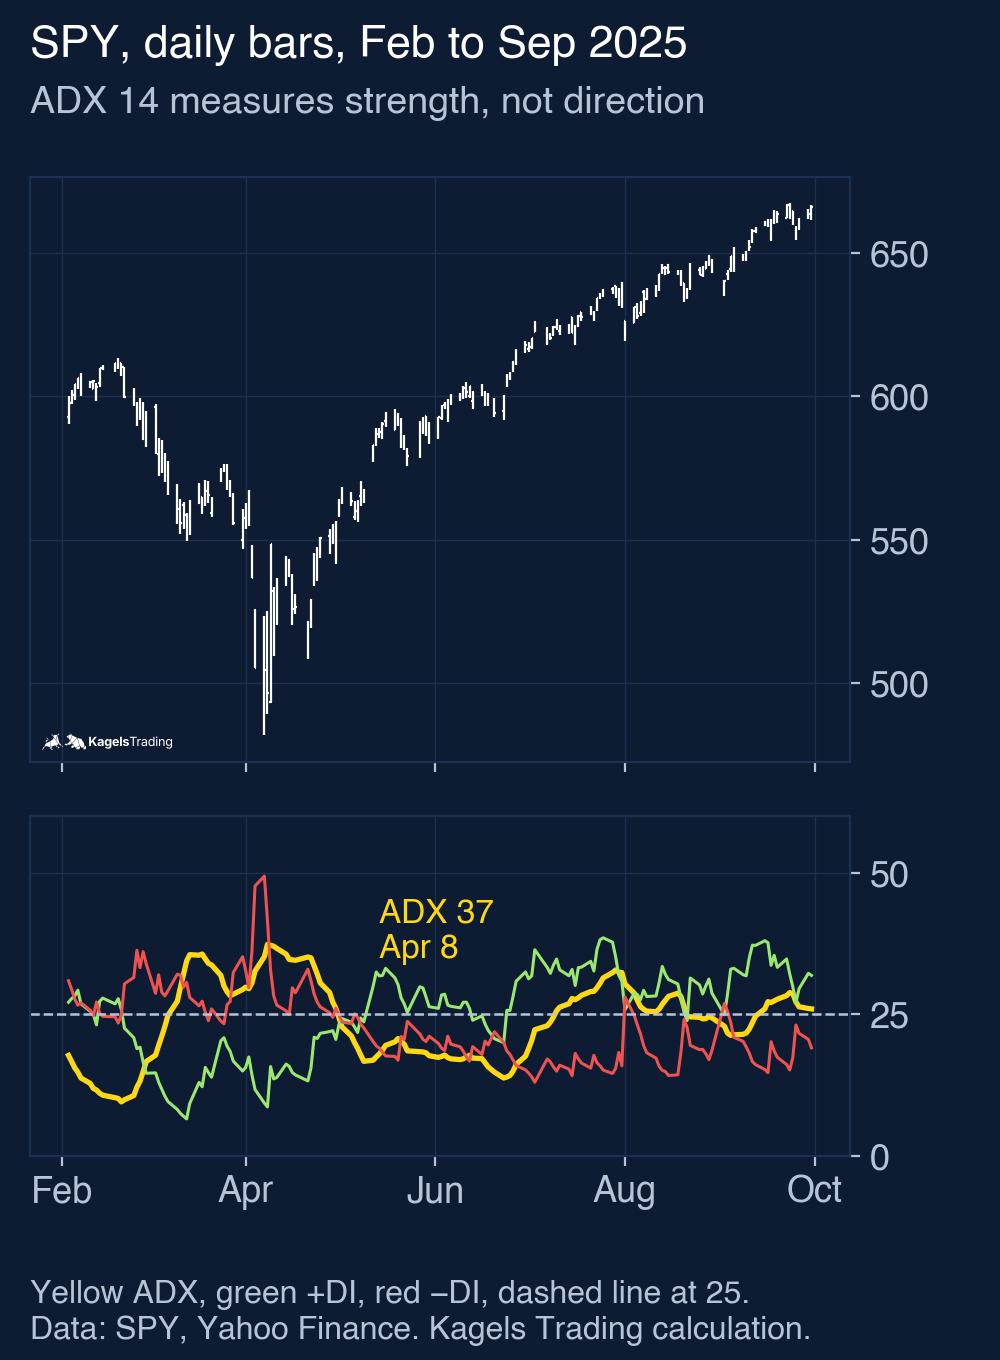
- It lags twice: the ADX smooths values that are already smoothed, so it can peak when a move is already ending. In SPY it peaked at 37 on April 8, 2025, the closing low of the sell-off, one session before the sharp rebound.
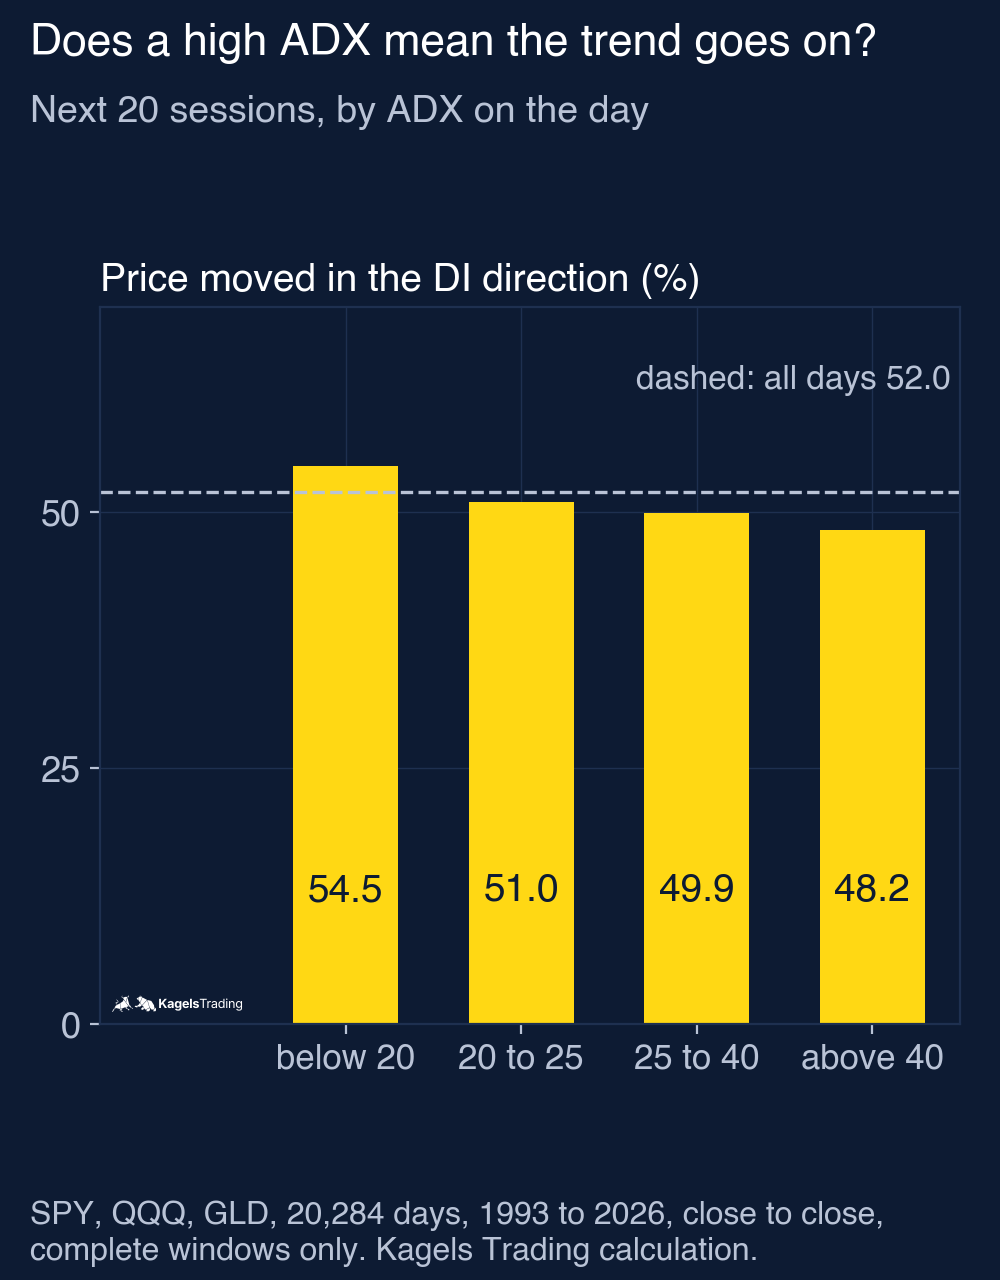
- A high ADX did not mean the trend went on: over 20,284 days in SPY, QQQ and GLD, price moved in the DI direction over the next 20 sessions in 48.2% of cases with an ADX above 40, against 52.0% for all days.
- The filter did not rescue the crossover: DI crossovers with an ADX above 25 were rare (257 of 1,939) and lost money on average in my test.
What is the ADX indicator?
The ADX (Average Directional Index) is a technical indicator that measures how strong the current directional movement of a market is, on a scale from 0 to 100, without saying whether that movement is up or down.
J. Welles Wilder introduced it in 1978, in his book “New Concepts in Technical Trading Systems”. In the same book he presented the ATR, the RSI and the Parabolic SAR. The TradingView help on the ADX notes that it was designed for commodity daily charts. Today it is used on every market and time frame.
The ADX is part of a family of three lines called the Directional Movement System. The +DI (positive directional indicator) measures upward movement, the −DI (negative directional indicator) downward movement, and the ADX summarises how far apart the two are. Many platforms show all three together, often under the name DMI.
The most important thing to understand is what the ADX does not do. A rising ADX can mean a strong uptrend or a strong downtrend. If you want to know the direction, you have to look at the DI lines or at the price itself. A high reading during a crash is just as “strong” as a high reading during a rally.
How the ADX is calculated
The calculation looks long, but it is built from three simple ideas: how far the market moved beyond yesterday’s range, how large the bars were, and how one-sided the movement was. Wilder’s smoothing, a slow moving average in which each new value counts for one fourteenth, is applied twice: first to the directional movement and the true range, then to the DX. Here is the order with the usual period of 14:
- Directional movement: compare today’s high with yesterday’s high and today’s low with yesterday’s low. If the rise of the high is larger (and positive), it counts as +DM; if the fall of the low is larger, it counts as −DM. The other one is zero for that day.
- True range: the largest of today’s high minus low, the distance from yesterday’s close to today’s high, and the distance from yesterday’s close to today’s low. This is the same true range the ATR uses.
- Directional indicators: +DI = smoothed +DM ÷ smoothed true range × 100, and −DI = smoothed −DM ÷ smoothed true range × 100.
- DX: the absolute difference between +DI and −DI divided by their sum, × 100. It is high when one side dominates and low when both are similar.
- ADX: the smoothed DX over 14 periods.
A small example shows the idea of the DX. If +DI is 30 and −DI is 10, the absolute difference is 20 and the sum 40, so the DX is 50; the reverse, +DI 10 and −DI 30, gives the same 50. If +DI is 30 and −DI is 30, the DX is zero: the market moves, but in both directions equally. The ADX then smooths these daily DX values, which is why it reacts slowly.
That double smoothing is the key to everything the ADX can and cannot do. The DI lines come from smoothed directional movement and smoothed true range, and the ADX smooths their normalised absolute difference, the DX, again over 14 periods. After a sharp turn, the ADX can stay elevated for some time. A reading of 35 can therefore describe a move that is already over, which the example below shows.
 Click to enlarge
What the ADX levels mean
The usual reading splits the scale into a few zones. These thresholds are conventions, mostly going back to Wilder and repeated in the TradingView help: below 20 a trend is weak or absent, above 25 a trend shows strength. These are rules of thumb. Above 40 to 50 many traders speak of a very strong trend, and values above 60 are rare on daily charts.
| ADX value | Usual reading | Share of days, SPY 1993 to 2026 |
|---|---|---|
| Below 20 | No trend or a weak one | 41.5% |
| 20 to 25 | Unclear zone | 23.7% |
| 25 to 40 | Trend | 30.8% |
| Above 40 | Strong trend | 3.9% |
In my data the ADX was below 25 on about two thirds of all days. The median ADX was 21.7 in SPY, 22.0 in QQQ and 20.7 in GLD. That fits the old trading wisdom that markets spend more time in ranges than in trends, but it also means that the “trend zone” above 25 covers only about a third of the time.
The slope matters as much as the level. The ADX rises whenever today’s DX is above yesterday’s ADX, and falls when it is below. So a rising ADX means that recent movement has been more one-sided than the smoothed average so far, even if the daily DX has already started to fall. A falling ADX means today’s directional imbalance is below its smoothed average; it does not by itself establish that a move is exhausted or turning, and it says nothing about the next direction.
Settings: 14 periods and when to change them
The standard setting is 14 for the DI lines and 14 for the ADX smoothing. That is the value Wilder used and the one most platforms start with; in TradingView the built-in “Average Directional Index” and “Directional Movement Index” let you set both separately. On a daily chart, 14 periods cover about three trading weeks.
Shorter settings react faster and give more false readings; longer settings react later. A 7-period ADX jumps above 25 after a few strong days; a 20- or 28-period ADX needs a sustained move. There is no correct value, only a trade-off between speed and calm. All numbers in this article use 14 and 14, and I have not tested other lengths.
My test: does a high ADX mean the trend continues?
I wrote the rules down before calculating and applied them unchanged to three ETFs. SPY stands for the S&P 500, QQQ for the Nasdaq 100 and GLD for gold, with daily bars from Yahoo Finance up to October 15, 2026. The test starts on the first day on which the ADX and a 200-day average both exist: November 11, 1993 for SPY (8,287 days), December 21, 1999 for QQQ and September 2, 2005 for GLD.
- Direction on a day: up if +DI is above −DI, down if −DI is above +DI.
- Continuation: the close 20 sessions later is beyond today’s close in that direction.
- Grouping: by the ADX on the day: below 20, 20 to 25, 25 to 40, above 40.
- Only complete windows count, and the windows overlap, so neighbouring days are not independent observations.
 Click to enlarge
| Price moved in the DI direction over 20 sessions | SPY | QQQ | GLD | All three |
|---|---|---|---|---|
| ADX below 20 | 53.7% | 55.1% | 55.1% | 54.5% (8,571 days) |
| ADX 20 to 25 | 52.5% | 52.6% | 45.7% | 51.0% (4,503) |
| ADX 25 to 40 | 51.0% | 50.1% | 47.7% | 49.9% (6,344) |
| ADX above 40 | 49.8% | 51.3% | 41.8% | 48.2% (866) |
| All days | 52.4% | 52.7% | 50.5% | 52.0% (20,284) |
A high ADX did not mean that the trend went on. Over all three ETFs, price moved in the DI direction over the next 20 sessions on 52.0% of all days. With an ADX above 40 the share was 48.2%, with an ADX between 25 and 40 it was 49.9%. The highest share came from the days the textbook calls trendless: 54.5% with an ADX below 20. In GLD the pattern was the clearest: above 40, gold kept moving in the DI direction on only 41.8% of days.
The size of the next move did not grow with the ADX either. The median absolute 20-session change in SPY was 2.72% on all days, 2.83% with an ADX between 25 and 40 and 2.73% above 40; in GLD it was even smaller above 40 (2.49% against 3.06% on all days). A high ADX described a strong move in the past; it did not announce a larger move in the next month.
The slope did not help in the way the textbook suggests. With an ADX above 25 and rising over the previous five sessions, price moved in the DI direction on 48.8% of days (4,370); with an ADX above 25 and falling, on 51.1% (2,840). The differences are small, and with overlapping windows they are descriptive, not proof of anything. What the numbers do not support is the idea that a rising ADX above 25 makes it more likely that the trend continues.
Why can that be? One possible explanation is the double smoothing; the test shows the association, not its cause. The ADX is highest after a long one-sided move, and long one-sided moves in stock indices are often sharp declines that end in a rebound, as in April 2025. The ADX is a good description of the past weeks and in this test a poor forecast of the next ones.
The DI crossover with and without the ADX filter
The classic way to trade the system is the crossover of the two DI lines, and the ADX is meant to filter it. I tested both versions on the same three ETFs: a long position when +DI crosses above −DI, a short position when −DI crosses above +DI, entry at the next open, 0.05% cost per side, price returns without dividends or borrowing costs. In the filtered version a crossover opens a trade only if the ADX is above 25 on that day; the opposite crossover always closes the trade, and in between you are in cash.
| DI crossover, 1993 to 2026 (all three ETFs) | Without filter | Only with ADX above 25 | Variant: ADX above 20 |
|---|---|---|---|
| Completed trades | 1,939 | 257 | 611 |
| Winning trades | 31.4% | 31.5% | 29.6% |
| Mean / median trade | +0.02% / −0.67% | −0.31% / −0.58% | −0.24% / −0.71% |
| Long trades: winners, sum | 37.8%, +436.9 pp | 41.5%, +62.0 pp | 38.1%, +83.4 pp |
| Short trades: winners, sum | 25.0%, −406.9 pp | 22.4%, −141.8 pp | 21.4%, −227.9 pp |
| Sum of all trades (not compounded) | +30.0 pp | −79.8 pp | −144.5 pp |
The DI lines crossed about 23 to 25 times a year, and most crossovers lost. Only 31.4% of the 1,939 unfiltered trades were winners, the median trade lost 0.67%, and the median holding period was four to five sessions. The long trades made up for the short trades almost exactly: +436.9 against −406.9 percentage points. The result was about zero before taxes, with very frequent trading.
The ADX filter removed most of the trades, but not the bad ones. Only 257 of the 1,939 crossovers (13%) happened with an ADX above 25. That is no accident: a crossover means the two DI lines are equal for a moment, so their difference, and with it the DX, is small just then. The filtered trades had a lower mean (−0.31%) than the unfiltered ones; the 20 threshold produced a larger summed loss (−144.5 pp), although its mean trade was less negative (−0.24%). The filter cut the time in the market to about 10%, but it did not pick the better signals.
The direction again made the difference. In every version, long trades won about 38 to 42% of the time and short trades only 21 to 25%. The same split showed up in my tests of the Supertrend and the Donchian Channel: in markets that rise over the long run, the short side of a symmetric system is the weak side. Per ETF, the unfiltered version came to −48.8 percentage points in SPY, +55.5 in QQQ and +23.3 in GLD, all small against the number of trades and close to zero per trade.
Some positions were still open on October 15, 2026, and they are not in the table. In the unfiltered version, all three ETFs were short: SPY from October 15 (−0.8% at the last close), QQQ from October 13 (+1.5%) and GLD from September 22 (+3.6%). On that day the ADX of SPY was only 10.0, one of the lowest readings of the year: no trend, by the textbook.
These numbers have limits. They come from three ETFs, one setting (14, 14), daily bars and a 20-session horizon. Other markets, shorter time frames or other rules can give other results. What the test shows is that the two most common textbook uses of the ADX did not work in this sample: a high reading did not predict continuation, and the 25 filter did not improve the crossover.
How to use the ADX sensibly
If the ADX is a description of the past weeks, use it as a description. These are ideas for how to use it, not rules I tested.
- As a regime label: an ADX below 20 tells you that recent movement was two-sided. Range tools such as oscillators fit that phase better than breakout systems; whether that holds for your market, test it.
- As a prompt to check, not a verdict: a very high ADX that starts to fall says that recent movement is less one-sided than its average. That can come before a pause or a turn, but it does not establish one, so treat it as a reason to look at the chart and perhaps tighten a stop, not to open a trade.
- With the price chart: the DI lines and the ADX can lag changes that are already visible on the price chart. I read the market structure first; the guide to price action trading explains how.
- Never as a reason to size up: a high ADX is not a high-probability label. Keep the risk per trade constant; the guide to position sizing shows how.
ADX compared with RSI, MACD and ATR
These four indicators answer four different questions, which is why combining them is not the same as confirming a signal four times. The ADX asks how one-sided the recent movement was. The RSI asks how strong gains were compared with losses. The MACD asks whether a short average is moving away from a long one. The ATR asks how large the bars are, regardless of direction.
| Indicator | Question it answers | Shows direction? |
|---|---|---|
| ADX | How one-sided is the movement? | No (the DI lines do) |
| RSI | Are gains larger than losses? | Yes |
| MACD | Is momentum speeding up or slowing down? | Yes |
| ATR | How large are the bars? | No |
The ADX and the ATR are often confused because both use the true range. The ATR is the average size of the bars in price units; the ADX is a smoothed measure of how one-sided the movement is, on a fixed scale; the true range cancels out of the DX ratio. A market can have a high ATR and a low ADX: large bars in both directions. That is the typical picture of a volatile range, and it is why the ADX can be low in a market that feels hectic.
Advantages and disadvantages of the ADX
The strengths and weaknesses of the ADX both come from its double smoothing. It is calm and easy to read, and for the same reason it is late. The list draws on my test where a number is given; the rest describes how the indicator works.
What speaks for the ADX
- Separates strength from direction: it is one of the few indicators that measures trend strength on its own scale.
- Calm line: the double smoothing filters out daily noise; the ADX rarely jumps.
- Fixed scale: values from 0 to 100 make markets and time frames comparable.
- Built in everywhere: every common platform has it, often together with the DI lines as the DMI.
What speaks against the ADX
- Late by design: in SPY it peaked at 37 on April 8, 2025, the closing low of the decline, not at its start.
- High readings did not predict continuation: above 40, price moved in the DI direction over 20 sessions on 48.2% of days, against 52.0% for all days.
- The 25 filter did not help the crossover: the 257 filtered DI trades had a mean of −0.31% against +0.02% without the filter.
- No direction: a rising ADX in a crash looks the same as in a rally; without the DI lines or the chart you cannot read it.
My conclusion: a good thermometer, a poor compass
The ADX describes very well how one-sided the last few weeks were. For that job it is calm, comparable across markets and easy to read. If you want a number for “is this market trending or not?”, it gives you one, and the thresholds 20 and 25 are a reasonable convention.
In my test it did not tell me what happens next. On three ETFs since 1993, with daily bars and a 20-session horizon, a high ADX did not mean that price kept moving in the same direction, and the popular filter “only trade crossovers above 25” made the DI crossover worse, not better. A likely reason is the double smoothing: by the time the ADX is high, the move it measures is often mature.
I do not trade with the ADX myself; I read trend and range directly from the chart. If you use it, use it as a thermometer for the past weeks, not as a compass for the next ones.
This article is market analysis, not investment advice. Past results of a rule test do not show future results.
Frequently asked questions about the ADX
What is the ADX indicator?
The ADX (Average Directional Index) is an indicator by J. Welles Wilder that measures the strength of a trend on a scale from 0 to 100. It does not show the direction; that comes from the two lines +DI and −DI, which together with the ADX form the Directional Movement System.
What is a good ADX value?
By convention, below 20 means no trend and above 25 means a trend. Above 40 traders speak of a strong trend. In my test, though, a high ADX did not mean the trend continued: above 40, price moved in the DI direction over the next 20 sessions on 48.2% of days, slightly less often than on an average day.
How is the ADX calculated?
It compares today’s high and low with yesterday’s, divides the directional movement by the true range, and smooths the result twice. The steps are: smooth +DM, −DM and the true range; calculate +DI and −DI; calculate the DX as their normalised absolute difference; smooth the DX into the ADX, usually over 14 periods. That double smoothing makes it slow.
Is the ADX a leading or a lagging indicator?
It is a lagging indicator, and a doubly lagging one. The DI lines rest on smoothed values, and the ADX smooths their normalised absolute difference again. In SPY the ADX peaked at 37 on April 8, 2025, the closing low of the decline, one session before the rebound, rather than at its start.
Does the ADX show the direction of the trend?
No, only its strength. A strong uptrend and a strong downtrend both produce a high ADX. For the direction, compare +DI and −DI or look at the price chart.
Is the ADX filter of 25 useful for crossovers?
In my test it was not. Only 257 of 1,939 DI crossovers in SPY, QQQ and GLD happened with an ADX above 25, because the DX is small at the moment the two lines cross. Those filtered trades had a mean of −0.31% after costs, against +0.02% without the filter.
More Technical Indicators guides
- Judge a golden cross
Golden Cross: Definition and S&P 500 Test Results
How the 50-day and 200-day averages cross, and what 38 signals in the S&P 500 since 1950 did against the base rate and buy and hold.
- Judge a death cross
Death Cross: What 38 S&P 500 Signals Since 1950 Show
How deep the S&P 500 fell after 38 death crosses since 1950, how late the signal comes, and what shorting it on SPY did since 1993.
- Use moving averages
Moving Averages: SMA, EMA and a 76-Year 200-Day Test
SMA, EMA and WMA formulas with a worked example, common periods, and what the 200-day line showed on the S&P 500 since 1950.
- Trail a stop with the Supertrend
Supertrend Indicator: Settings, Strategies and an ETF Test
How the ATR-based line is calculated, common settings, five strategies, and what 654 completed flip trades in SPY, QQQ and GLD since 1993 showed.
- Read the Ichimoku Cloud
Ichimoku Cloud: The Five Lines and a US ETF Test
The five lines and the cloud, how traders read the Tenkan/Kijun cross, and what the cloud and the crosses did in SPY (since 1993), QQQ and GLD.
- Read the RSI
RSI Indicator: Formula, Settings and a 75-Year Test
The RSI formula, overbought and oversold, and what RSI signals did on the S&P 500 since 1951 against the base rate.
- Read volatility with Bollinger Bands
Bollinger Bands: Settings, Squeeze and a 76-Year Test
Settings, the three typical chart situations, five strategies with rules, and what the bands and the squeeze showed on the S&P 500 since 1950.
- Set stops with the ATR
ATR Indicator: Average True Range for Stops and Size
True range and Wilder smoothing, stop distance and position size, and how ATR stops behaved on SPY from 1994 to 2026 against a fixed stop.
- Trade Donchian breakouts
Donchian Channel: Breakout Rules and a 20-Year ETF Test
Channel rules, the current-bar pitfall, the Turtle systems, and what 499 breakout trades in SPY, GLD and TLT from 2006 to 2026 showed.
- Read the Stochastic
Stochastic Oscillator: Settings, Signals and a 30-Year Test
The %K and %D formula, what 14, 3, 3 means, fast versus slow, and what 785 oversold signals in SPY, QQQ and GLD did against the base rate.
- Judge a divergence
Divergence Trading: Regular and Hidden Divergence Tested
Regular and hidden, bullish and bearish divergences, when they are confirmed, and what 447 RSI divergences detected in SPY, QQQ and GLD did against the base rate.
- Read the MACD
MACD Indicator: Histogram, Divergence and a 31-Year Test
Formula, histogram, crossovers and divergences, with a 31-year test on the S&P 500 and the DAX against the base rate.
- Use VWAP
VWAP Indicator: Formula, Anchored VWAP and TradingView Setup
The VWAP formula, trend day versus range day, Anchored VWAP and the right settings in TradingView.