
Bollinger Bands: Settings, Squeeze and a 76-Year Test


Contents
- Bollinger Bands in 30 seconds
- What are Bollinger Bands?
- Bollinger Bands settings: which parameters make sense
- How to read Bollinger Bands: three typical situations
- Five Bollinger Bands strategies with clear rules
- My test: what the bands showed on the S&P 500
- Advantages and disadvantages of Bollinger Bands
- Combining Bollinger Bands with other indicators
- My conclusion: an honest tool, not a signal generator
- Frequently asked questions about Bollinger Bands
- About the author
When the bands on a chart contract, the market goes quiet. Bollinger Bands make that visible at a glance: they show whether a market is calm or stretched, and they measure something many traders ignore, the volatility, meaning the size of the price swings.
In this guide you learn how Bollinger Bands are built, which settings make sense and how to read their three typical situations. You get five strategies with clear rules, from the Bollinger Squeeze to the Gimmee Bar of Joe Ross, whose books I translated and published in Germany. Then you see what the bands actually showed on the S&P 500 since 1950, including one popular belief that the data does not support. This article follows our editorial policy.
Bollinger Bands in 30 seconds
- Definition: Bollinger Bands consist of a 20-period simple moving average and two bands two standard deviations above and below it. John Bollinger developed them in the 1980s.
- They measure volatility: the bands widen when prices swing hard and contract when the market is calm.
- Most closes stay inside: on the S&P 500 since 1950, 88.8% of daily closes were inside the 20, 2 bands.
- A touch is not a signal: in strong trends prices walk along the band. After the first close above the upper band, the index was higher 21 sessions later about as often as after any day.
- A squeeze did not mean a bigger move in my test: after the BandWidth hit a 120-session low, the median absolute 21-session close-to-close return was 2.45%, slightly smaller than after any day (2.65%).
What are Bollinger Bands?
Bollinger Bands are a technical indicator made of a 20-period simple moving average and two bands placed two standard deviations above and below it. The bands measure the volatility of a market: they widen when prices swing strongly and contract in calm phases.
The US analyst John Bollinger developed the indicator in the early 1980s. His idea: a fixed price channel with a constant distance fits every market except the one you are trading right now. So he tied the width of the channel to the standard deviation of the prices. The result is an envelope around the price that adjusts to the market by itself.
The standard deviation is a statistical measure of how far single prices stray from their average. Large deviations mean high volatility, small deviations a calm market.
The calculation needs three lines, and every charting platform draws them automatically:
- Middle band: the simple moving average (SMA) of the last 20 closes.
- Upper band: middle band plus 2 × the standard deviation of the same 20 closes.
- Lower band: middle band minus 2 × that standard deviation.
John Bollinger’s own rules use a simple average for the middle band. He also notes that the same simple average is used in the standard deviation calculation, according to his Bollinger Band rules. This study uses the population standard deviation of the 20 closes. If you want the moving average behind the middle band explained, see the guide to moving averages.
Most price action happens between the bands. In my count on the S&P 500 from January 1950 to October 2026, 88.8% of all daily closes were inside the 20, 2 bands, 5.9% above the upper band and 5.4% below the lower band. A close outside the bands is therefore uncommon, and that makes it worth noticing on the daily chart.
Bollinger Bands settings: which parameters make sense
The default setting is 20, 2: a 20-period moving average and bands two standard deviations away. John Bollinger designed the indicator with this combination, and it is the default in common charting platforms, for example in the Bollinger Bands help of TradingView.
My advice: start with the default. If you bend the parameters until past signals look perfect, you are overfitting, and the future will not follow. A change makes sense when you change your time horizon. Bollinger’s rules give this guidance for consistent price containment:
| Horizon | Periods | Standard deviations |
|---|---|---|
| Shorter | 10 | 1.9 |
| Default | 20 | 2.0 |
| Longer | 50 | 2.1 |
The guidance holds up on the S&P 500. With 10, 1.9 the bands contained 88.7% of daily closes, with 50, 2.1 they contained 89.7%, close to the 88.8% of the default. I measured these two variants because they were planned before the test, and nothing else.
BandWidth measures the distance between the upper and the lower band relative to the middle band. A low BandWidth shows a narrow range and low volatility. Many platforms offer it as a separate indicator below the chart.
How to read Bollinger Bands: three typical situations
Bollinger Bands show their value together with price action, meaning the price movement itself. I explain how I read price in the guide to price action trading. On the chart you will meet three situations again and again, and each tells a different story about the market.
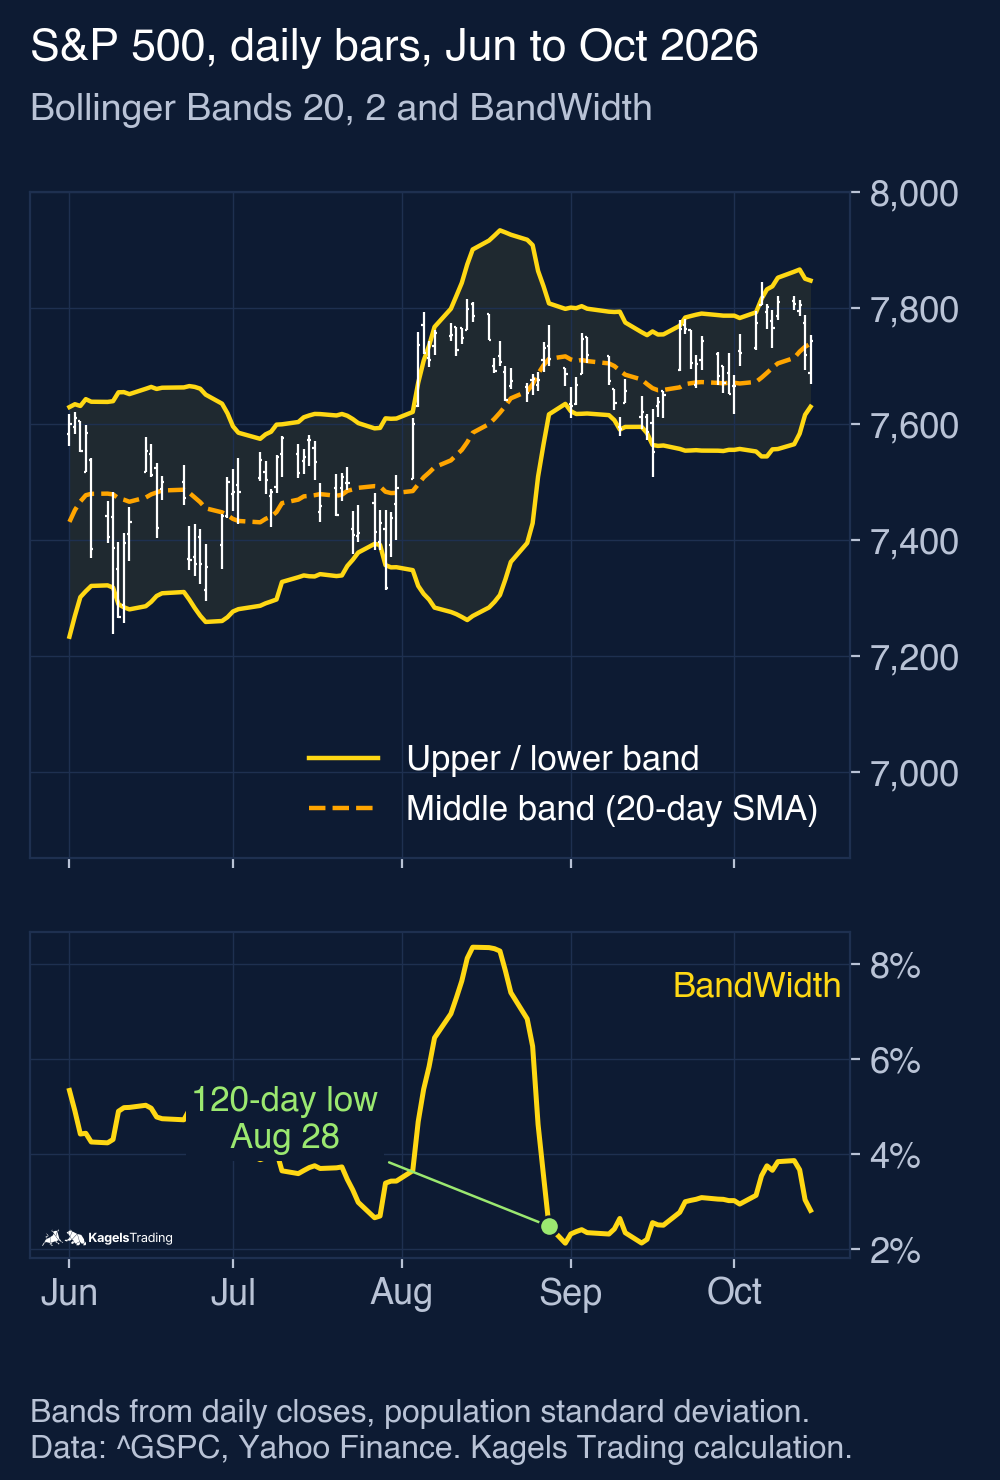 Click to enlarge
Situation 1: prices swing between the bands
In a sideways phase, prices bounce off the upper band, run to the lower band and turn up again. The market is stuck in a range, and the bands mark its edges. What looks like standstill is a working environment for range traders: buy near the lower band, sell near the upper band, with a tight stop outside the range.
Such phases often appear before major scheduled events, for example a Fed decision, when few traders want to commit before the news. That is an observation from practice, not something I measured here. How to find the edges of such a range with price itself is shown in the guide to support and resistance.
Situation 2: prices walk along the band
Walking the band describes a strong trend in which prices move along the upper or lower Bollinger Band for several bars. It leads to the most expensive mistake with this indicator: “The price is stuck at the upper band, so the market is overbought, so I sell.” In an intact uptrend the price can walk along the upper band for days or weeks while the bands widen. John Bollinger puts it plainly in his rules: tags of the bands are tags, not signals. A touch of the upper band is not a sell signal in itself.
My test supports that warning. After the first close above the upper band, the S&P 500 was higher 21 sessions later in 60.6% of cases, almost the same as after any day (61.8%). In this sample the share of higher outcomes was close to the base rate, so the close above the band was neither a reliable reversal nor a breakout with a clear edge. Many traders watch the middle band: a fall back through it is a common sign that the trend is losing strength, though I have not tested that here.
Situation 3: a close or a whole bar outside the bands
A close outside the bands and a whole bar outside the bands are two different things. A close outside means only the last price is beyond the band; a bar outside means even its low (above the upper band) or its high (below the lower band) did not reach the band. Both are uncommon. John Bollinger’s own rules read closes outside the bands first as continuation signals, not as reversals, and warn that band tags are not signals. The idea of mean reversion, prices moving back toward their average after an extreme, is therefore only one possible reading.
Some traders use a whole bar outside the bands in two ways. First as a possible exhaustion move after a long rise, if a separately defined reversal pattern follows. Second as a reason to take partial profits on a long position. Both are interpretations I have not tested here. Never treat such a bar as the only signal; look for volume, a matching bar pattern or a clear support or resistance zone.
Five Bollinger Bands strategies with clear rules
The three situations lead to five strategies that are widely used in practice. They cover breakouts, reversals and sideways markets. I describe their rules here; apart from the squeeze measurement below, I have not backtested them, so treat them as starting points for your own testing, not as proven systems.
Strategy 1: the Bollinger Squeeze
A Bollinger Squeeze is a phase in which the bands contract more tightly than they have for months. The idea comes from John Bollinger himself and uses the BandWidth as the yardstick. A popular rule of thumb says that quiet phases are followed by strong moves. StockCharts describes the setup in its ChartSchool article on the squeeze.
The long squeeze in two steps:
- Wait: the BandWidth falls to its lowest value of the last 120 periods (about six months on a daily chart).
- Entry: go long when a bar closes above the upper band. A close counts, a touch does not.
The short squeeze works the other way round: same waiting condition, entry on a close below the lower band. The biggest weakness is the false breakout, which Bollinger calls a head fake: price breaks out briefly, turns and runs the other way. Two filters are worth testing: trade in the direction of the higher trend, and look at the bars inside the squeeze. If bullish bars dominate there, some traders treat a break to the downside as suspicious.
What my test says about the squeeze: on the S&P 500 since 1950 there were 187 squeeze days by this definition. Their median absolute close-to-close return over the next 21 sessions was 2.45%, slightly below the 2.65% after any day, and the realised volatility of those sessions was slightly lower too (10.8% against 11.3%). That does not test the breakout entry itself, and it does not show what happened inside the 21 sessions. It only shows that, on a broad stock index with daily bars, these squeezes were not followed by larger moves than an average day.
Strategy 2: Bollinger Bands plus MACD
This day-trading combination splits the work between two indicators: the MACD sets the direction, the bands set the entry. The appeal is the dynamic entry: because the bands adapt to volatility, a hectic market needs a larger move for a signal than a calm one. The settings: MACD with the default 12, 26, 9 and Bollinger Bands with 12 periods and two standard deviations, deliberately faster than the 20 default.
The rules for a long trade:
- Trend filter: the MACD line is above its signal line and above zero.
- Entry: place a buy stop order at the upper band. If price breaks out, you are in the market.
For a short trade the rules are mirrored. Two things matter. Watch for divergences between price and the MACD histogram, explained in the MACD indicator guide. And without a stop loss this setup is not tradable, because the stop order also buys you into false breakouts.
Strategy 3: double tops and double bottoms with Bollinger Bands
This strategy uses the bands as a filter for chart patterns, and it is one of my favourites. It trades double bottoms (W patterns) and double tops (M patterns), two classic reversal formations.
A W bottom forms when the first swing low closes below the lower band and the second swing low stays inside the bands. The second low may even be lower than the first. As long as it no longer reaches the band, selling pressure has weakened relative to volatility. That detail is invisible without the bands. For a double top it works the other way round: first high above the band, second high inside, even if it is higher.
How to apply it:
- Chart type: look for the pattern on a line chart of closes; it filters out the noise of the wicks.
- Confirmation: after the second low, wait for a close above the middle band. With very narrow bands, use the upper band as the trigger instead.
- Execution: switch back to bars or candles to time the entry precisely.
With experience you will see that the exact shape is secondary. What counts is the loss of downside momentum, and it can also show in triple bottoms or untidy formations. The bands make it measurable.
Strategy 4: the Gimmee Bar of Joe Ross
The Gimmee Bar comes from Joe Ross, one of the pioneers of short-term chart pattern trading. I represented Joe Ross in Germany for over 17 years and translated and published his ten books, so I know this setup first-hand. It is one of the few approaches built specifically for sideways markets.
A Gimmee Bar is a reversal bar in a sideways phase: it touches the upper or lower band and closes against the previous direction. The trade targets the opposite side of the range, with a stop beyond the signal bar.
The rules for the long version:
- Market: the market moves sideways, and prices are falling inside the range.
- Touch: price reaches the lower Bollinger Band.
- Signal bar: a bar closes above its open. That is the Gimmee Bar.
- Entry: buy one tick above the high of the Gimmee Bar.
Joe Ross named three exceptions where you leave a Gimmee Bar alone:
- Close to the average: the bar touches or nearly touches the moving average in the middle of the bands. There is no room left.
- Oversized: the bar is much larger than the bars before it. Such bars often announce a breakout, not a reversal.
- Gap: the next bar opens with a gap outside the range of the Gimmee Bar. The situation has changed.
The trade aims at the other side of the range. The target is the opposite side of the range, the stop sits just beyond the extreme of the signal bar. Every range ends at some point, and the Gimmee Bar is built for ranges, so check before each signal whether the sideways phase is still intact.
Strategy 5: the breakout with a volume filter
The simplest Bollinger strategy is the direct breakout trade: long on a close above the upper band, short on a close below the lower band. In this raw form it produces many false signals, especially in sideways markets. A volume filter is meant to sort out weak breakouts; whether it does is something to test.
The rules:
- Signal: a bar closes outside the upper or lower band. Touches do not count.
- Volume filter: the breakout bar has at least 1.2 times the average volume of the previous 20 bars (an illustrative rule; the German original names no averaging period).
- Direction filter: trade preferably in the direction of the higher trend, checked on the next higher time frame.
The idea behind the volume filter is simple: a real breakout needs new participants who build positions. If volume does not rise, the breakout may lack substance; that is a hypothesis, not a result of my test. How to read volume in more depth is shown in the guide to volume analysis, and the general rules for breakouts in the breakout trading guide.
My test: what the bands showed on the S&P 500
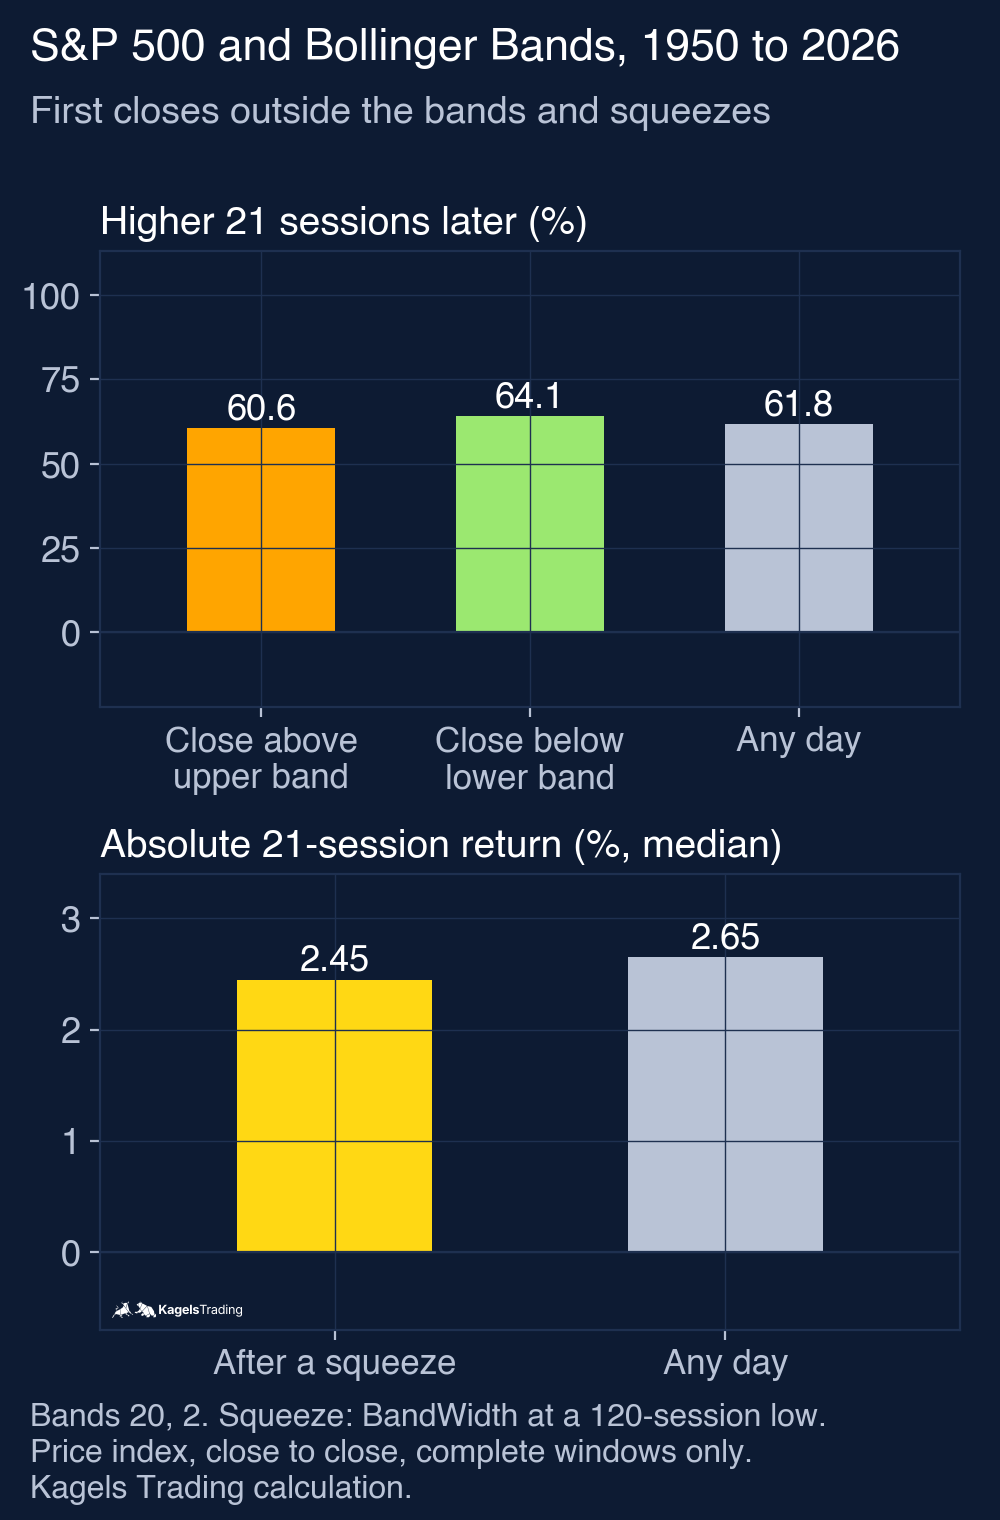
I wrote the rules down before I calculated anything. Data: daily closes of the S&P 500 price index from January 1950 to October 15, 2026, Bollinger Bands 20, 2 with the population standard deviation. A signal above is the first close above the upper band after a close at or below it; below, the first close under the lower band after a close at or above it. I measured the price change 5 and 21 sessions later and compared it with all days (the base rate). Only complete windows count. The 10th percentile is the lower value of the sorted list, without interpolation.
 Click to enlarge
| Window after the signal | First close above upper band (580) | First close below lower band (552) | Any day |
|---|---|---|---|
| 5 sessions, share higher | 57.6% (334 of 580) | 52.7% (291 of 552) | 56.8% (10,965 of 19,295) |
| 5 sessions, median change | +0.23% | +0.18% | +0.30% |
| 21 sessions, share higher | 60.6% (351 of 579) | 64.1% (354 of 552) | 61.8% (11,918 of 19,279) |
| 21 sessions, median change | +1.00% | +1.47% | +1.12% |
| 21 sessions, 10th percentile | −4.17% | −4.77% | −4.37% |
Neither band worked as a reliable reversal signal. After the first close above the upper band, the index behaved almost like on any day. After the first close below the lower band it was weaker over five sessions (52.7% higher) and a little stronger over 21 sessions (64.1%), with a slightly worse tail. The windows overlap, both in the base rate and among signals that follow each other closely. These are descriptions of one index, not proof of an edge.
The squeeze result does not support the common rule of thumb for this index and horizon. A squeeze day is the first day of each run in which the BandWidth sits at its lowest value of the last 120 sessions. The 187 squeeze days had a median absolute close-to-close return of 2.45% over the next 21 sessions, against 2.65% for any day (19,159 complete windows, which start after the extra 120-session lookback). Realised volatility, the population standard deviation of the 21 daily returns annualised with the square root of 252, had a median of 10.8% against 11.3%. At the squeeze, the BandWidth stood in the median at 2.7%, about half of its usual 5.1%. After the squeeze of August 28, 2026, the index was 0.5% lower 21 sessions later.
Advantages and disadvantages of Bollinger Bands
Like every indicator, Bollinger Bands have strengths and blind spots. Know both before you risk real money with them, and test any rule first.
What speaks for Bollinger Bands
- Self-adjusting: the bands adapt to volatility and work on any market and time frame.
- Right on the price chart: the indicator sits on the chart, not below it, so your attention stays on price.
- Versatile: one tool covers trends, ranges and reversals, as the five strategies show.
- Easy to understand: an average plus a standard deviation is a logic any beginner can follow.
What speaks against Bollinger Bands
- Lagging: the bands are calculated from past prices. They describe, they do not forecast.
- False signals in trends: treating band touches as reversals loses in trending markets.
- No timing tool: in my S&P 500 test, squeezes were not followed by larger 21-session moves, and the bands never show the direction.
- Not tradable alone: without confirmation from price action, volume or a second tool, every signal is half the information.
Combining Bollinger Bands with other indicators
The main purpose of Bollinger Bands is volatility; the middle band adds some trend context, but no momentum reading. Other tools fill those gaps. Three combinations are common:
- RSI: confirms stretched readings at the bands. My RSI test shows why “overbought” alone is a weak argument.
- MACD: as a trend filter it keeps you from trading against the dominant direction, as in strategy 2.
- Keltner Channel: the closest relative of the bands, but it uses the average true range instead of the standard deviation. When the Bollinger Bands move inside the Keltner Channel, that is a stricter squeeze definition.
A volume spike at a support or resistance zone makes any of these combinations stronger. That is my experience from practice, not a result of the test above.
My conclusion: an honest tool, not a signal generator
I have known Bollinger Bands since the 1980s and had them on my charts for a long time. Today I trade without indicators, based only on price and market structure. Still, the bands are one of the few indicators I recommend to beginners without hesitation, because they invent nothing: they make visible how much the market is swinging.
That is also their limit. The bands give context, not buy and sell buttons. My S&P 500 test showed that neither a close outside a band nor a squeeze told you much about the next weeks on its own. Every strategy here needs confirmation from price action or volume, a stop loss and the discipline not to fight a trend. If you want to go deeper, John Bollinger’s book Bollinger on Bollinger Bands is the best source from the inventor himself.
This article is market analysis, not investment advice. Past results of an index study do not show future returns.
Frequently asked questions about Bollinger Bands
What are Bollinger Bands?
Bollinger Bands are a technical indicator developed by John Bollinger in the 1980s. They consist of a 20-period moving average and an upper and lower band two standard deviations away. The bands widen when volatility is high and contract in calm phases.
How are Bollinger Bands calculated?
The middle band is a 20-period simple moving average of the closes. For the upper band you add two standard deviations of the same 20 closes, for the lower band you subtract them. Every common charting platform calculates this automatically.
How do you read Bollinger Bands?
The market phase decides. In sideways markets the bands act like edges where prices turn. In trends, prices walk along the band without turning. A band touch alone is therefore never a complete trading signal.
What is a Bollinger Squeeze?
A squeeze is a phase in which the bands are unusually narrow because volatility has fallen to a multi-month low. Traders often expect a strong breakout afterwards. On the S&P 500 since 1950, the next 21 sessions after a squeeze were not more volatile than average in my test.
What does a close above the upper Bollinger Band mean?
It depends on the context. After a squeeze it can be a bullish breakout; in a mature uptrend it shows strength. On the S&P 500, the first close above the upper band was followed by about the same results as any day.
What is the best setting for Bollinger Bands?
The default 20, 2 is a good starting point, as set by John Bollinger and in platforms like TradingView. John Bollinger’s rules suggest 10 periods with 1.9 standard deviations for shorter horizons and 50 periods with 2.1 for longer ones. More important than fine-tuning is to keep the setting you choose.
What is the best Bollinger Bands strategy?
There is no best strategy for every market phase. The Gimmee Bar is built for sideways markets, the W bottom filter for reversals, the squeeze and the volume breakout for breakouts. Choose the strategy that fits the current phase and test it before you rely on it.
This English edition is based on our German edition on kagels-trading.de and has been adapted for international readers.
More Technical Indicators guides
- Judge a golden cross
Golden Cross: Definition and S&P 500 Test Results
How the 50-day and 200-day averages cross, and what 38 signals in the S&P 500 since 1950 did against the base rate and buy and hold.
- Use moving averages
Moving Averages: SMA, EMA and a 76-Year 200-Day Test
SMA, EMA and WMA formulas with a worked example, common periods, and what the 200-day line showed on the S&P 500 since 1950.
- Read the RSI
RSI Indicator: Formula, Settings and a 75-Year Test
The RSI formula, overbought and oversold, and what RSI signals did on the S&P 500 since 1951 against the base rate.
- Set stops with the ATR
ATR Indicator: Average True Range for Stops and Size
True range and Wilder smoothing, stop distance and position size, and how ATR stops behaved on SPY from 1994 to 2026 against a fixed stop.
- Trade Donchian breakouts
Donchian Channel: Breakout Rules and a 20-Year ETF Test
Channel rules, the current-bar pitfall, the Turtle systems, and what 499 breakout trades in SPY, GLD and TLT from 2006 to 2026 showed.
- Read the MACD
MACD Indicator: Histogram, Divergence and a 31-Year Test
Formula, histogram, crossovers and divergences, with a 31-year test on the S&P 500 and the DAX against the base rate.
- Use VWAP
VWAP Indicator: Formula, Anchored VWAP and TradingView Setup
The VWAP formula, trend day versus range day, Anchored VWAP and the right settings in TradingView.