
TradingView Backtesting: Test a Strategy Without Real Money


Contents
- TradingView backtesting in 30 seconds
- What is backtesting?
- Bar Replay or strategy report: two ways to test a strategy
- How much does backtesting on TradingView cost?
- Which strategy is suitable for a backtest?
- Limit the test period and make trading hours visible
- Backtesting with Bar Replay: step by step
- Testing automatically with the strategy report
- Documenting and evaluating the results
- The four most common mistakes in backtesting
- How to improve your strategy after the test
- Conclusion: backtesting turns a guess into a number
- Frequently asked questions about backtesting on TradingView
- About the author
A strategy that worked in hindsight is not yet a strategy that makes you money. A backtest helps you assess how a strategy would have performed under defined historical conditions. It cannot establish that the strategy will make money in live trading. You replay the market candle by candle, make your decisions without knowing the outcome, and end up with figures instead of gut feeling.
TradingView offers two separate tools for this, and they are often mixed up: manual replay with Bar Replay, and the automatic strategy report for Pine Script strategies, which TradingView called the Strategy Tester until July 2026. This article shows both ways, names the real costs and explains the mistakes that make a backtest worthless.
TradingView backtesting in 30 seconds
- Two methods, one goal: Bar Replay tests by hand and without any coding. The strategy report runs Pine Script strategies automatically.
- Getting started is free: on the free Basic plan, Bar Replay works on daily charts and higher, and Pine Script strategies can be evaluated with the basic metrics.
- Intraday replay costs money: minute replay starts with Essential at $12.95 a month, billed annually. Its allowance is six months on the 1-minute chart and 30 months on the 5-minute chart, subject to data availability. Automatic intraday backtests also work on Basic.
- Deep Backtesting from Premium: Premium at $59.95 a month, billed annually, and higher plans add Deep Backtesting, with up to two million bars and one million trades.
- Sample size matters: aim for 100 trades per market and time frame as a practical starting point, not a statistical cutoff. Larger samples still need checks across market conditions and unseen data. Include realistic trading costs.
What is backtesting?
Backtesting means testing a trading strategy on historical price data, where every rule is applied as if the rest of the price history were still unknown. It is the step between a trading idea and real money.
Steps, metrics and the typical mistakes are explained in our backtesting guide. It also contains a backtest with a worked S&P 500 example over 32 years, including out-of-sample and walk-forward tests. This article is about doing it in TradingView: replaying the market candle by candle, deciding without knowing the outcome and ending up with figures instead of gut feeling.
A backtest is different from a forward test. The backtest checks the statistics of the past; a simulation such as paper trading on TradingView checks your decisions in real time. Some trading journals also include a market simulator for forward practice.
Bar Replay or strategy report: two ways to test a strategy
TradingView has two backtesting tools, and they answer different questions. Bar Replay rewinds the chart and lets you mark every trade by hand. The strategy report runs a strategy written in Pine Script automatically over the loaded chart range and delivers a finished report. If you confuse the two, you look for the results in the wrong place.
The most important difference is not the technology but what the result tells you. A manual test shows how you decide in a real situation, including hesitation and broken rules. An automatic test shows what your rules would have produced without you. Both figures are valuable, and they almost always differ.
| Question | Bar Replay | Strategy report |
|---|---|---|
| Process | manual, per candle | automatic |
| Code | no | Pine Script; ready-made strategies need no coding |
| Speed | slow | seconds |
| Result | your own journal | report on the chart |
| Strength | discretionary setups | fixed rules |
| Free | yes, daily and up | yes, basic metrics |
For discretionary approaches, there is no way around the manual test. A setup that lives on chart patterns and timing cannot be fully put into rules. Automatic backtests are most useful for approaches with clear entries and exits. Rule-based mean reversion strategies suit them well, because their rules are fully expressed in numbers.
How much does backtesting on TradingView cost?
The most common misunderstanding is that backtesting on TradingView requires a paid plan. That is not quite true. On the free Basic plan, Bar Replay runs on daily charts and higher over the full history, Pine Script strategies can be added, and the strategy report shows the basic metrics. That can be enough to get started with swing or position trading strategies.
For day traders, the cost depends on the method. Replay on minute charts starts with Essential, while automatic intraday tests also work on Basic within its data and reporting limits. Seconds-based replay and Deep Backtesting are available on Premium and higher plans. The prices below are from the TradingView pricing page for annual billing, the replay history from TradingView’s help page on Bar Replay data, as of 24 September 2026.
| Plan | Per month | Replay history (1-minute chart) |
|---|---|---|
| Basic | $0 | daily chart and up only |
| Essential | $12.95 | 6 months |
| Plus | $29.95 | 1 year |
| Premium | $59.95 | all available time-based history, including seconds, with futures exceptions |
| Ultimate | $199.95 | as Premium, plus 7 days of ticks |
Annual billing. On higher minute charts the replay goes further back: the months multiply by the minutes, so Essential reaches 30 months and Plus 5 years on the 5-minute chart, subject to data availability. Continuous futures and futures using settlement prices have separate replay limits. On Premium and higher plans, these include one year on the 1-minute chart and 30 days on second-based charts. Tick replay requires a supported symbol.
Two functions decide the step up to Premium. Deep Backtesting runs a strategy over up to two million bars and one million trades, instead of only over the loaded chart range. On top of that comes more precise execution inside the candle, which TradingView now controls with the Bar detalization menu (until July 2026 the Bar Magnifier checkbox). For swing traders on the daily chart, both are optional. For intraday strategies, these features can extend the test period and improve simulated fills. They do not guarantee a reliable result.
Exporting the trades also depends on the plan. From Essential, you can export trades as CSV and the strategy report as XLSX; on the free plan you cannot. If you keep your evaluation in your own spreadsheet or a trading journal anyway, this saves you retyping. A full overview of all plans is in our TradingView review.
Which strategy is suitable for a backtest?
Before the first test you need a strategy with clear rules. Without precise entry criteria, exit rules and rules for risk management, you are not testing anything, you are just looking at charts.
What role does the time frame play?
The time frame you choose determines how often and what kind of signals you get. Short time frames between one and fifteen minutes suit scalping, medium ones between thirty minutes and four hours suit swing trades. Position traders work on the daily and weekly charts. Which time frame suits you depends less on the strategy than on when you are actually at your computer.
The time frame also decides what your test costs. If you test on the daily chart, you need no subscription. For Bar Replay on a 5-minute chart, you need at least Essential. Its replay allowance is 30 months on that interval and six months on a 1-minute chart, subject to data availability. Automatic intraday tests also work on Basic. That is a practical argument when choosing a time frame, and it hardly appears in any guide.
Which market should you test?
The same strategy delivers very different results in different markets. Stocks, forex, crypto and futures differ in volatility, trading hours and cost structure. The more a market moves, the more signals, but also the more false signals.
A quick pre-test saves hours. Before you collect 200 trades in a market, go through the charts quickly and see whether your setup appears there regularly at all. If you have found three signals after twenty screen widths, the combination of market and time frame is unsuitable for your strategy. This pre-selection is not a backtest; it only prevents a pointless one.
Limit the test period and make trading hours visible
A setup is of no use to you if it forms at three in the morning. If you test markets that trade around the clock, such as forex or crypto, you get signals without restriction at times when nobody is at the screen. The backtest then looks better than your trading will ever be.
The first step is therefore an honest definition of your trading hours. Enter when you actually sit in front of the chart, not when you would like to. Everything outside this window is not traded in the test, even if the signal looks perfect.
Marking trading hours on the chart
A session indicator makes the time window visible on the chart. A widely used one is the Sessions indicator by LuxAlgo, which you add through the indicator search. It colors the Asian, London and New York sessions and also allows a freely defined time window.
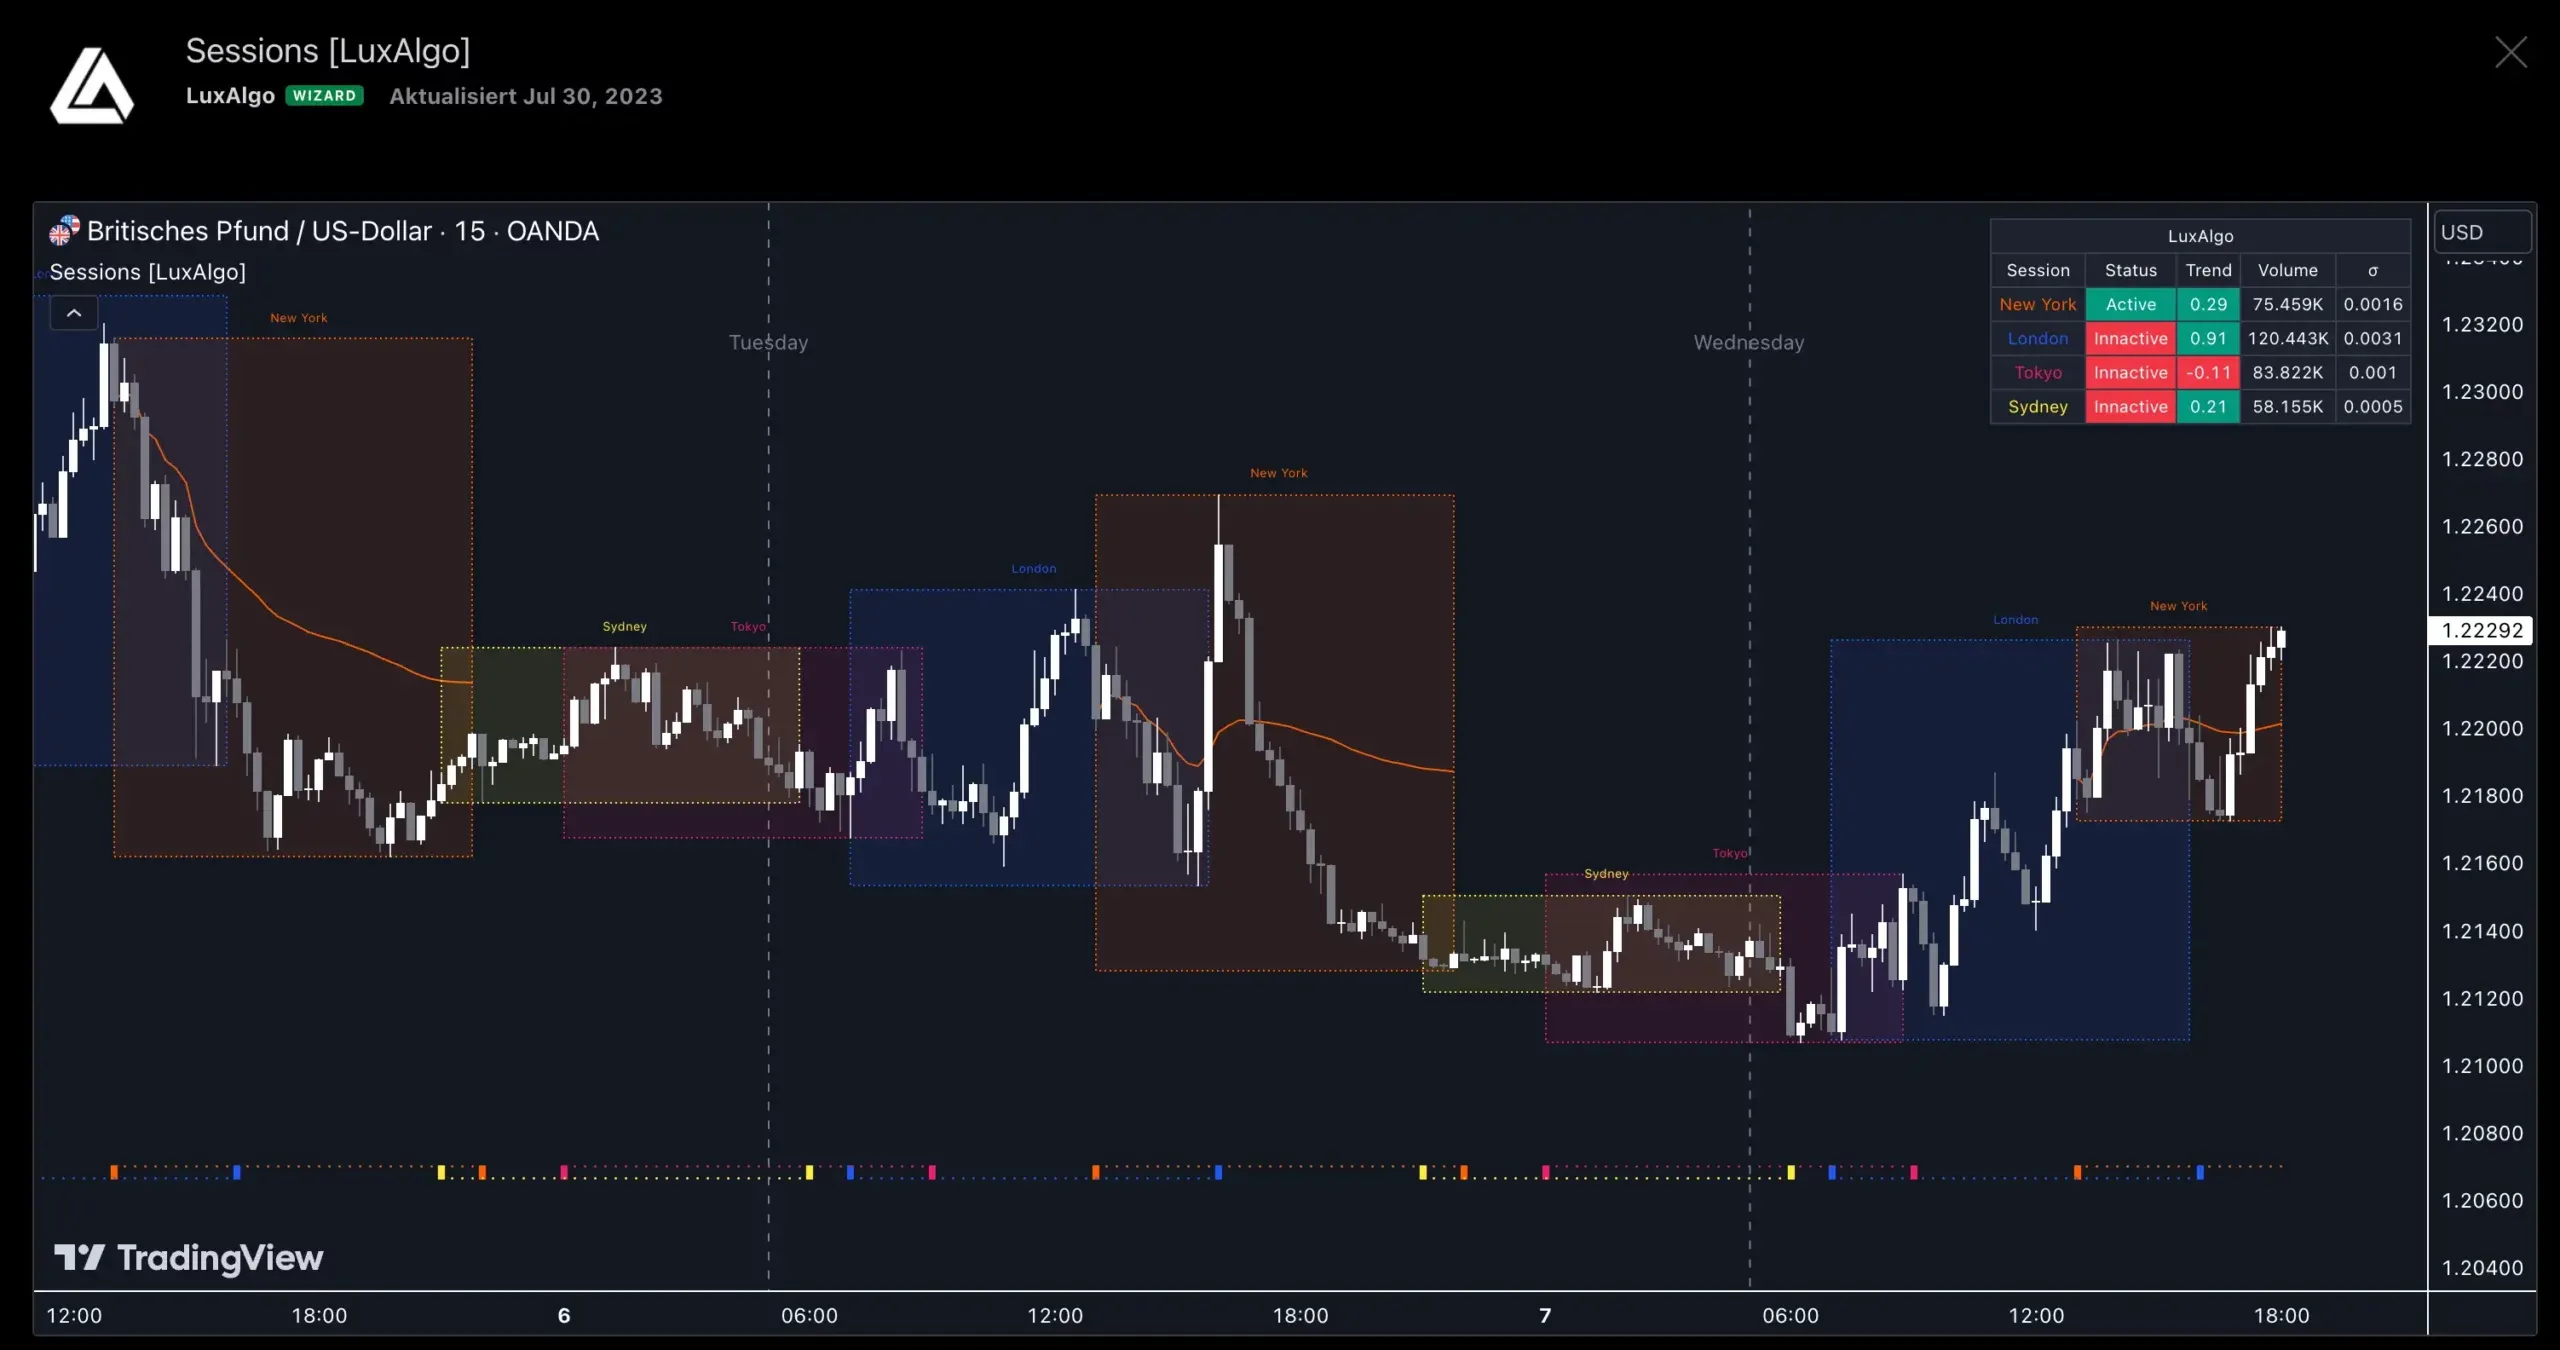 The Sessions indicator colors New York, London, Tokyo and Sydney and shows status, trend and volume for each session. The indicator was last updated in July 2023 (“Aktualisiert” = updated).
The colored areas prevent the most common self-deception in a backtest. Without them, you overlook signals outside your own hours or quietly take them. With them, every trade can be assigned at once, and a later evaluation by time of day becomes possible at all.
Beyond a certain amount of data, every charting platform reaches its limits. If you need longer histories, other software can help: ProRealTime, in its premium version, goes back several years on the 1-minute chart of the DAX future. A test across several years and several markets can hardly be done cleanly by hand. If you want to calculate a whole portfolio rather than a single symbol, you need specialized software such as Wealth-Lab or AmiBroker.
Backtesting with Bar Replay: step by step
Bar Replay is the way without any coding. You cut the chart at any point, play it forward candle by candle and record every trade with the position tool. The example below uses our in-house Swing Catcher indicator as the signal source; the stop goes beyond the most recent swing high or low, and the planned target is twice the initial risk (2R).
Preparing the chart
Before the replay starts, everything you will need later belongs on the chart. That means your indicators, the session indicator with your time window, and the right time frame. Adding something later falsifies the test, because your decision is then based on something different from the earlier ones.
Starting Bar Replay
The Bar Replay button sits in the top toolbar, labeled Replay. After clicking it, you choose the candle from which to test. Everything to the right of it disappears. Depending on the time frame, you can cut off weeks or months this way and play them again.
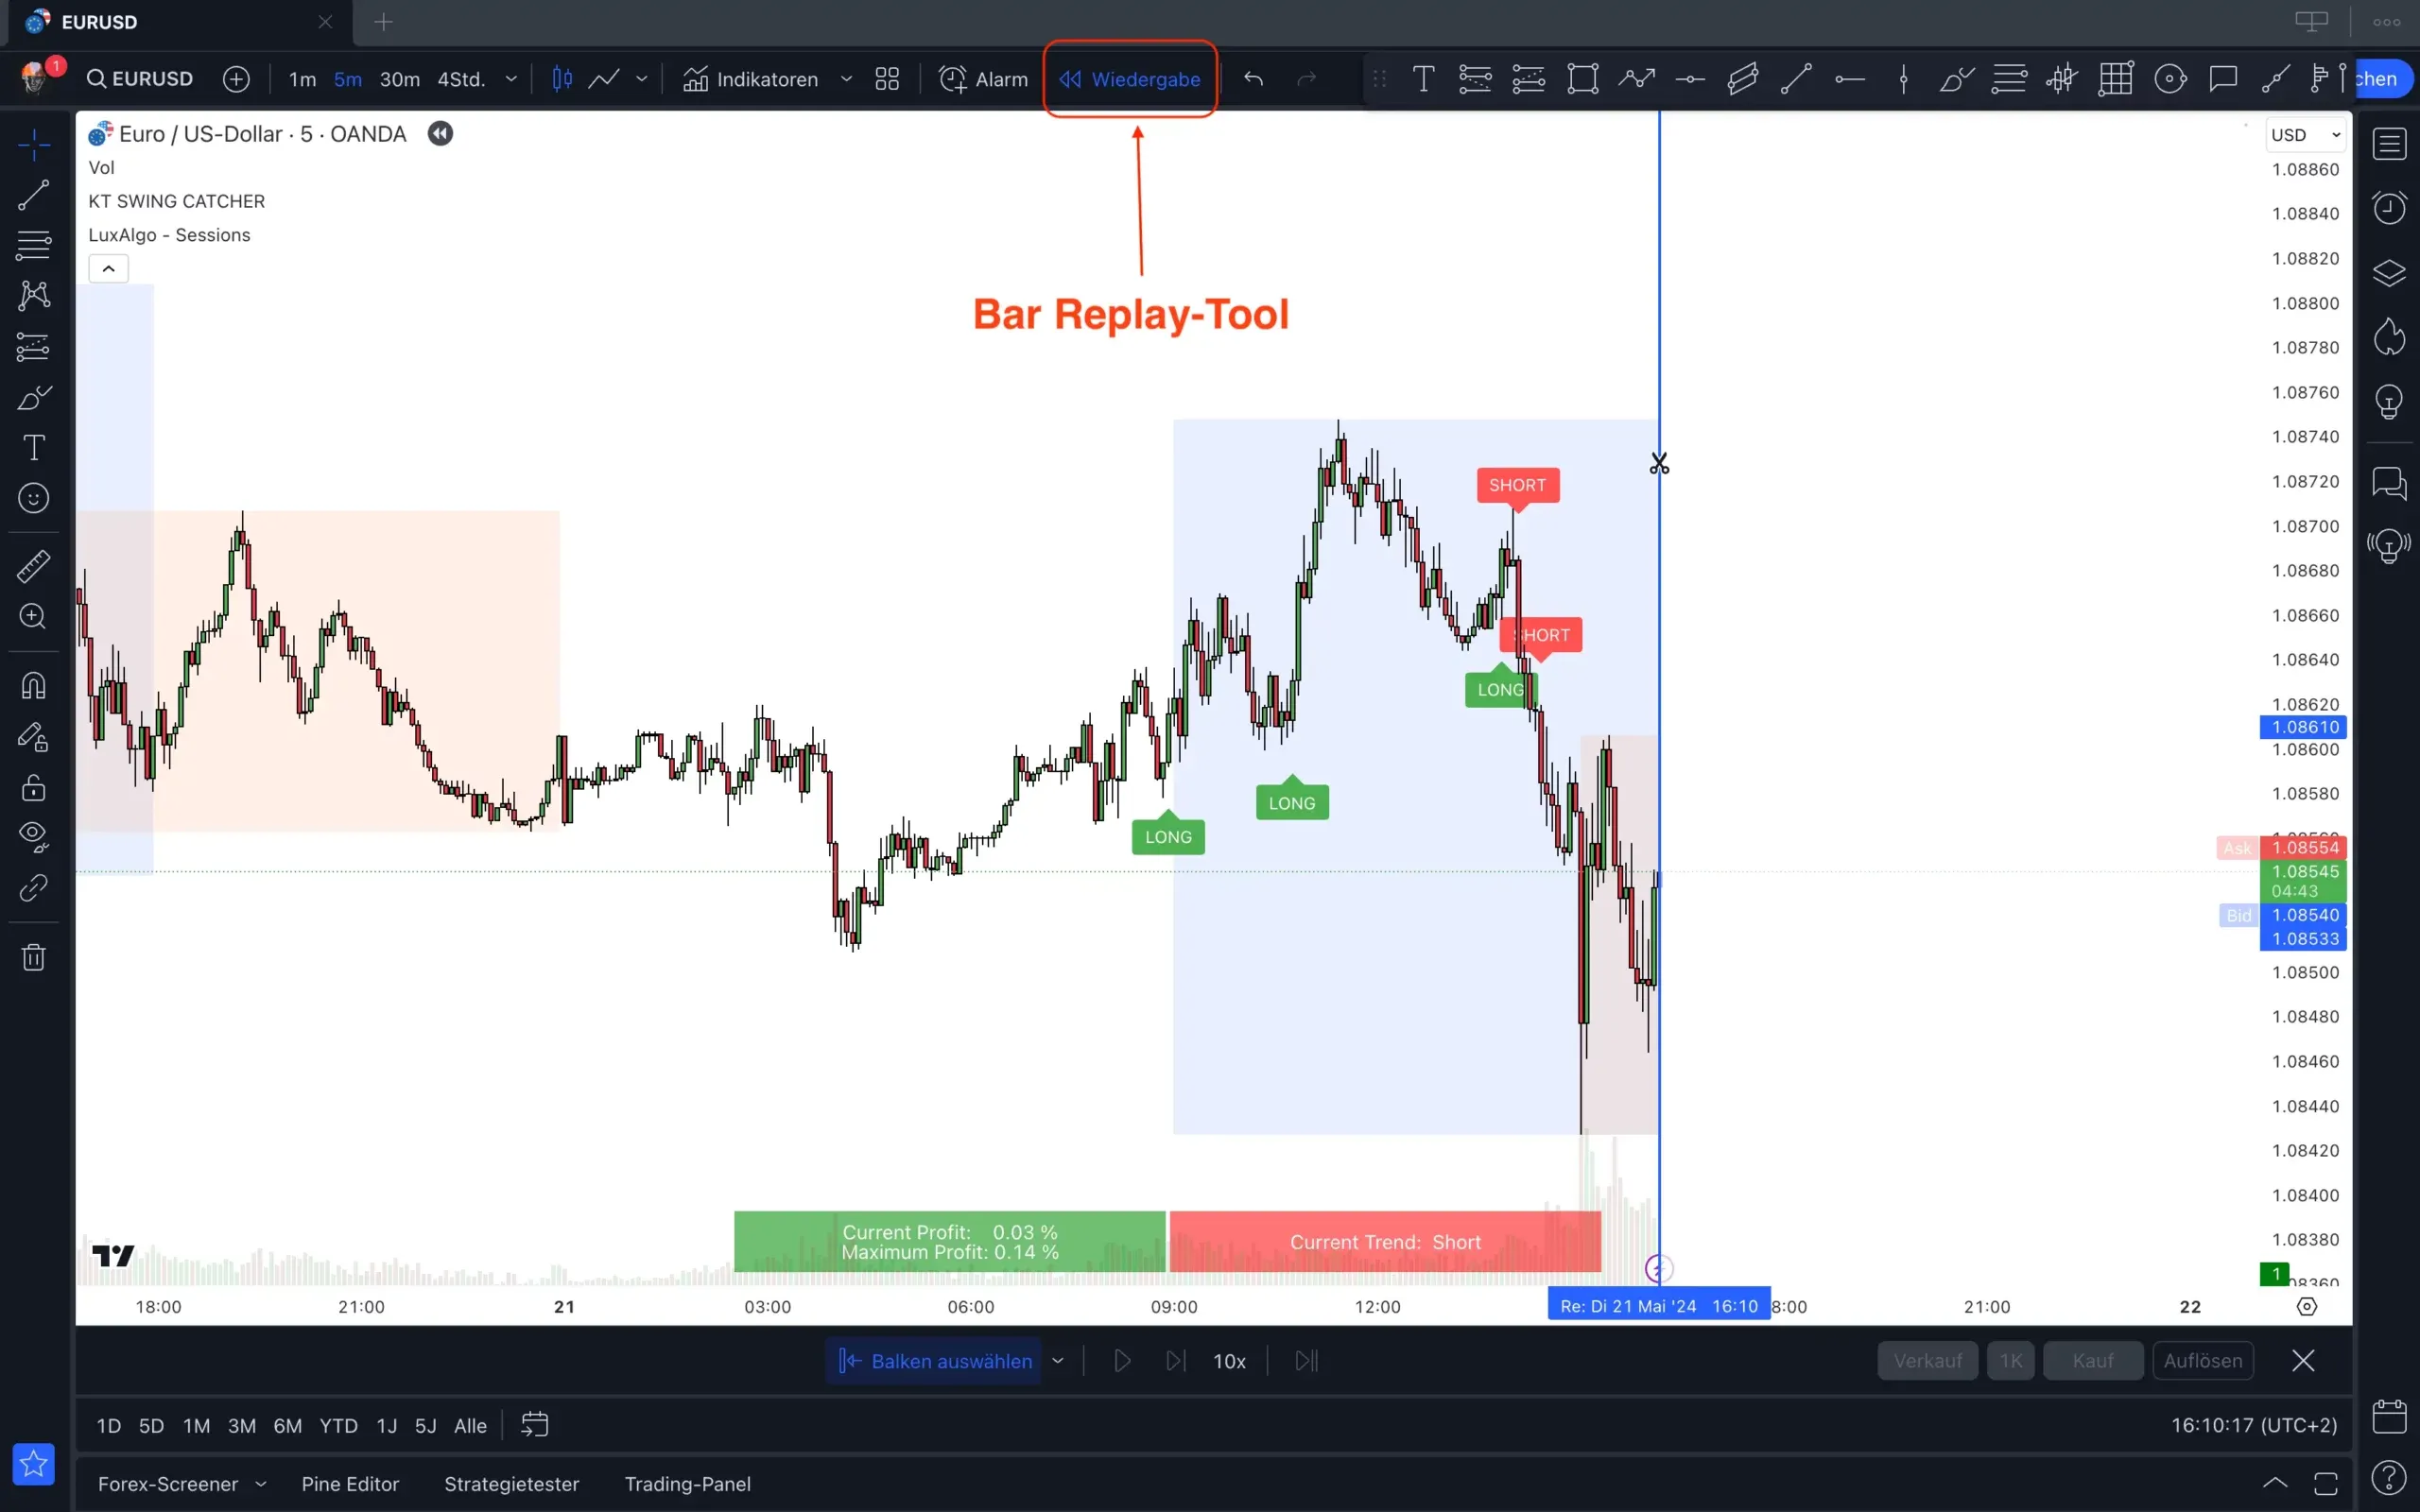 Bar Replay starts with the Replay button (“Wiedergabe” in the German interface). To the right of the blue line the chart is cut off; on the left, the candles already played, with the signals drawn in. EUR/USD, 5-minute chart, 21 May 2024.
The control bar at the bottom sets speed and starting point. You can step from candle to candle by hand or let it play automatically, at speeds from one update every ten seconds up to ten updates per second. For a reliable test, the manual single step is the better choice, because you then decide consciously at every candle.
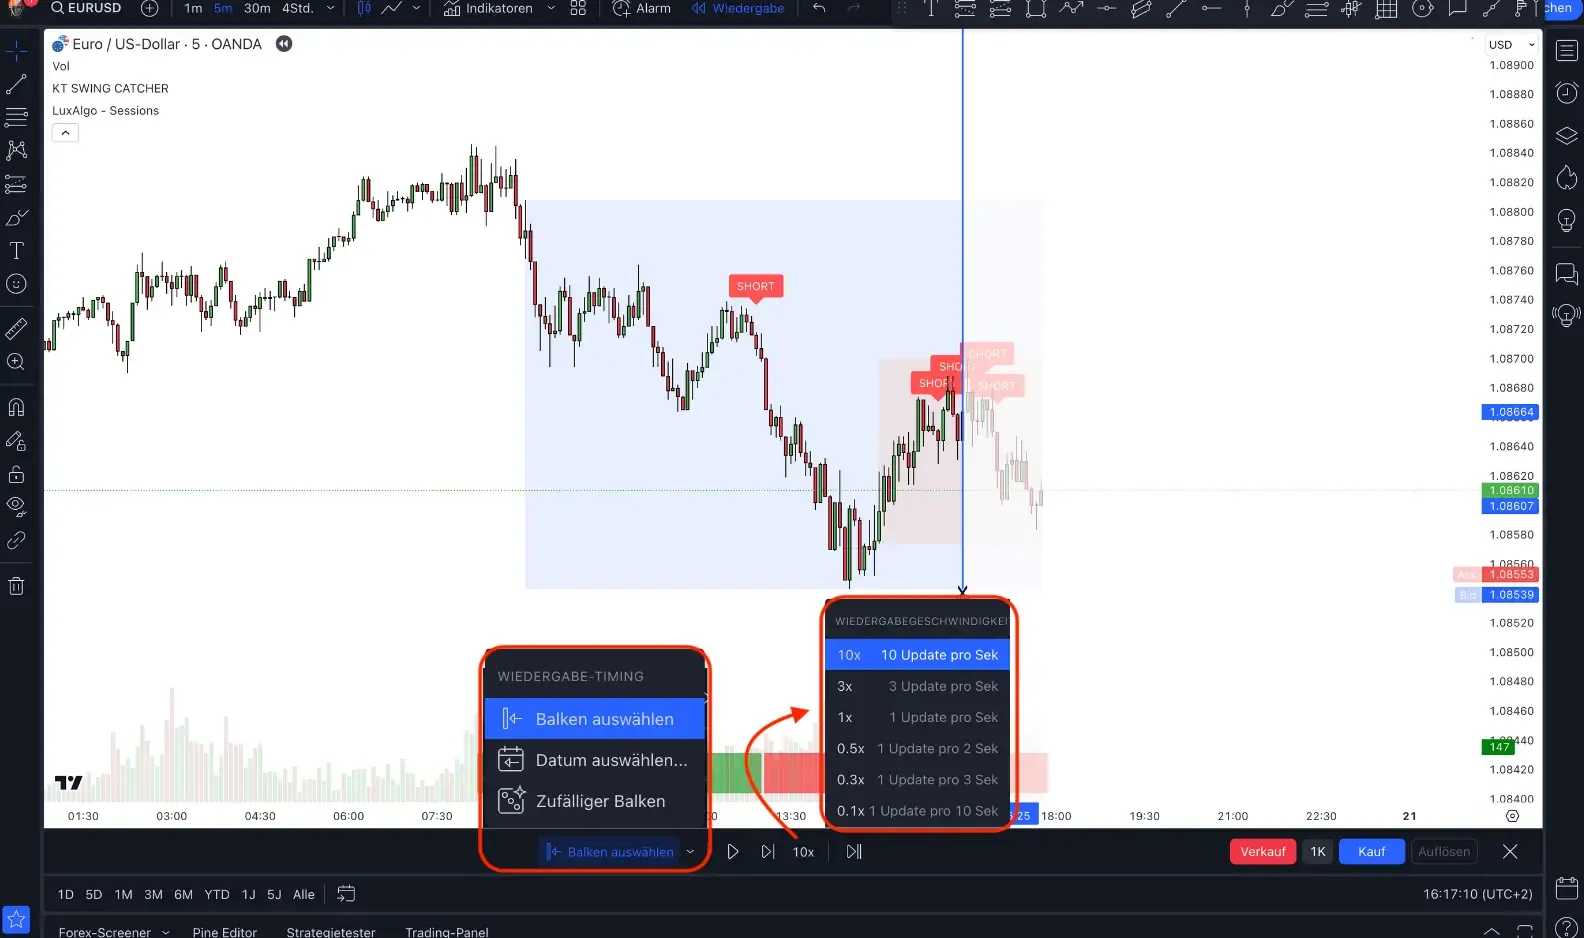 The replay timing menu offers a bar, a date or a random bar as the starting point; next to it is the replay speed from 0.1x to 10x. German labels: Wiedergabe-Timing = replay timing, Balken auswählen = select bar, Datum auswählen = select date, Zufälliger Balken = random bar, Wiedergabegeschwindigkeit = replay speed.
Recording and collecting trades
Every signal within your trading hours is recorded with the position tool. You find it in the left toolbar under the forecasting and measuring tools, as a long and a short version. Entry, stop and target are set according to your rules, not adjusted afterwards.
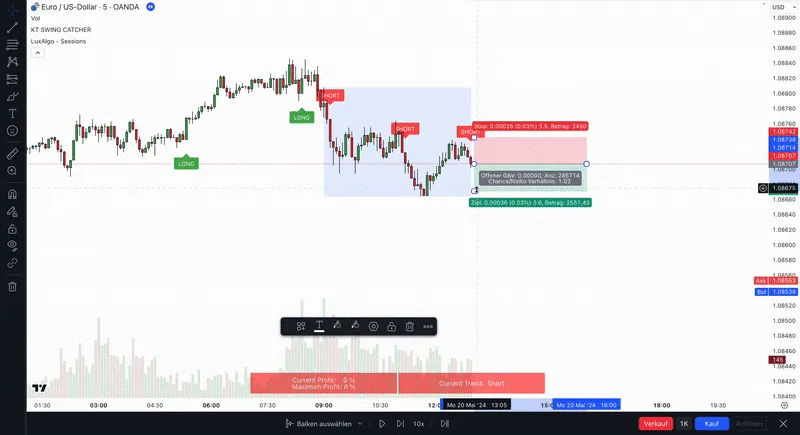 An example trade in Bar Replay: the short position is drawn directly on the chart with entry, stop and target. The illustrated position has a target of about 1.03R, rather than the 2R target described above. German labels: Stop, Ziel = target, Chance/Risiko Verhältnis = reward-to-risk ratio. EUR/USD, 5-minute chart, 20 May 2024.
The number of trades affects how much confidence you can place in the results. Aim for at least 100 trades per market and time frame as a practical starting point, not a statistical cutoff. Smaller samples have greater uncertainty, and even larger samples need checks across market conditions and unseen data. On short time frames, 250 to 500 trades can be a practical working target, rather than a universal minimum.
To keep the chart tidy, the object tree helps. It lists all drawn positions one below the other and lets you group them in folders. That keeps the chart clear and lets you call up individual test series again later. TradingView itself explains how the object tree works.
Testing automatically with the strategy report
The automatic method runs Pine Script strategies (how the language works). You can use a ready-made strategy without writing code. A strategy is declared with strategy() and can place simulated orders using functions such as strategy.entry() and strategy.exit(). An ordinary indicator cannot place these orders. Coding skills are needed to create or modify your own strategy logic.
The process has four steps. You open the chart in the market and time frame you want, add a ready-made or your own strategy under Indicators and Strategies, open the strategy report in the panel at the bottom, and read the results there. The current documentation shows two main tabs, Metrics and Trades. Until July 2026 this panel was called the Strategy Tester, and older versions use different tab names. You change the settings of the strategy, such as starting capital, position size, stop and target, with the gear icon next to the strategy name.
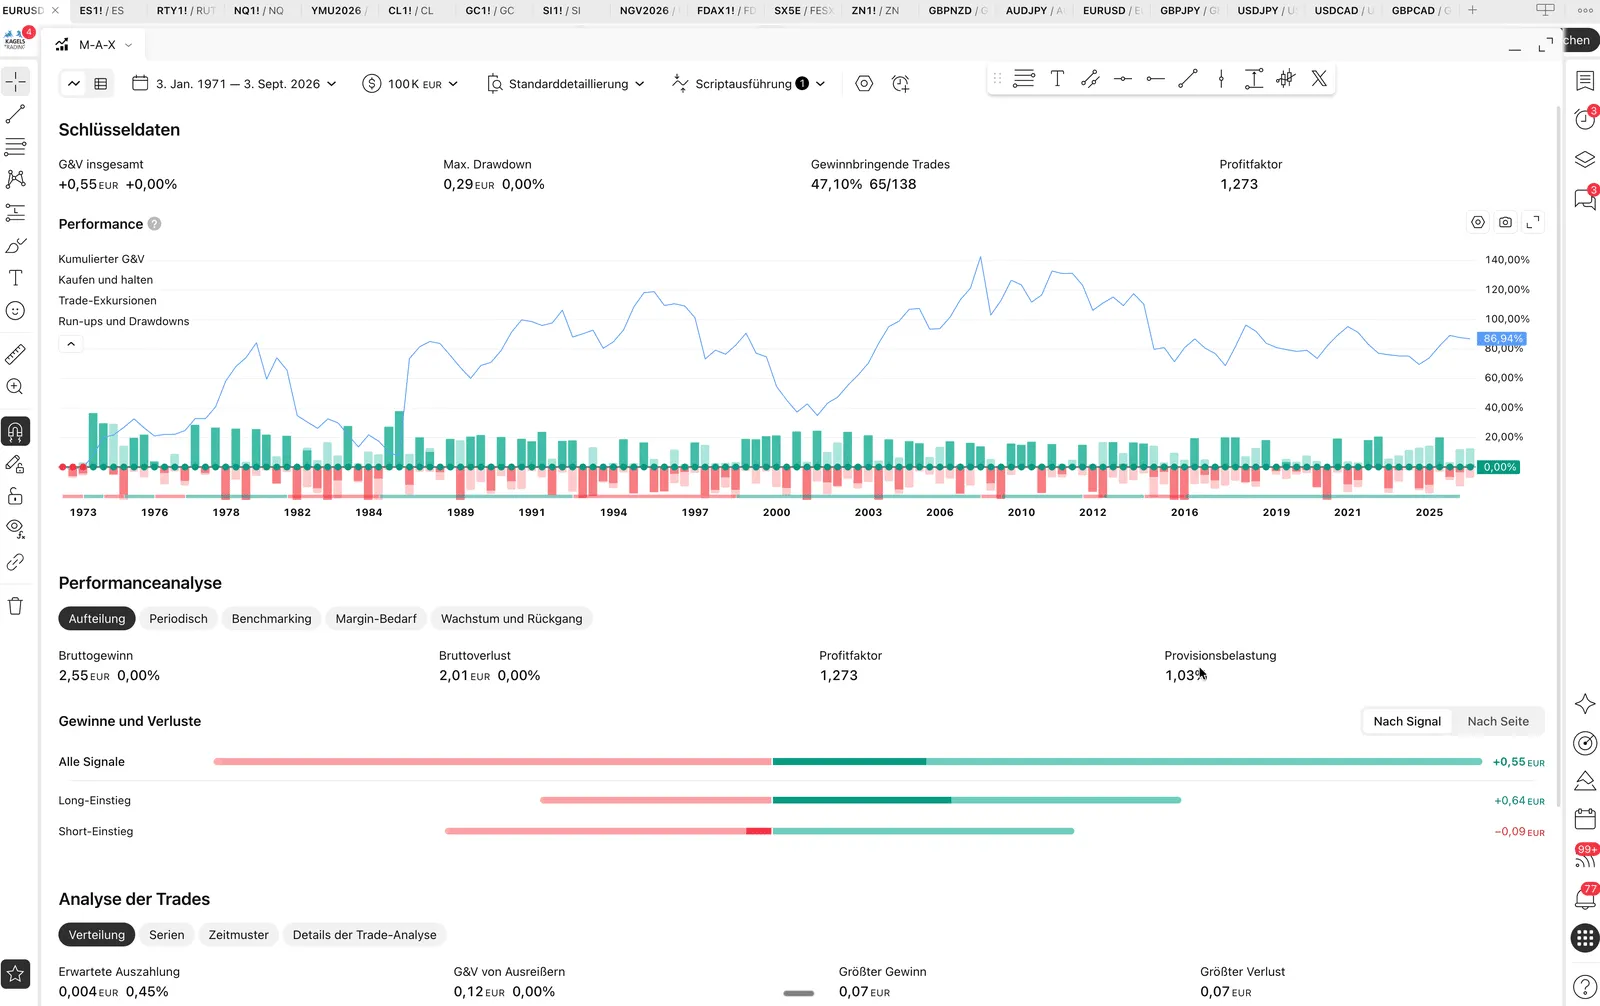 The older Strategy Tester interface, now the strategy report, on EUR/USD from our TradingView review: profit factor 1.273 with a 47.1 percent win rate from 138 trades, plus the equity curve and the split between long and short entries.
By default, the report calculates over the loaded chart range. On intraday charts, this ranges from about 5,000 bars on Basic to 40,000 on Ultimate, according to TradingView’s help page on historical bars. Daily and higher timeframes display all available history. Deep Backtesting, available on Premium and higher plans, can test beyond the loaded intraday range, up to two million bars and one million trades. A short test period may not cover enough trades or market conditions for a robust assessment.
The automatic test has one systematic advantage and one systematic weakness. It applies the coded rules consistently, but the test can still suffer from lookahead bias, selection bias and overfitting. It ignores everything that cannot be put into rules, and it only calculates with the costs you give it. If you program the test yourself, for example in Python, you keep full control over the data and the execution assumptions. Once a strategy has passed the test, the next step is often to automate it.
Documenting and evaluating the results
A backtest without documentation is lost time. The positions drawn on the chart are not a result but raw material. Only when every trade is recorded with date, direction, result and market condition can you derive anything. A spreadsheet is enough; journals such as Edgewonk, TradeZella or Tradervue are more convenient.
- Win rate: the share of winning trades. 60 winners out of 100 is 60 percent. Win rate alone is not enough. You also need to consider the size of both wins and losses.
- Result in R: profit and loss measured against the risk taken. If you risk $100 and win $200, you have made 2R. This makes trades comparable across different position sizes.
- Maximum drawdown: the largest fall from an account high to the following low. If the account falls from $10,000 to $8,000, that is $2,000 or 20 percent.
- Profit factor: gross profits divided by gross losses. With $15,000 of profit and $10,000 of losses, that gives 1.5. A value above 1 means that total winning-trade profits exceed total losing-trade losses on the cost basis used. Include realistic trading costs before judging the result.
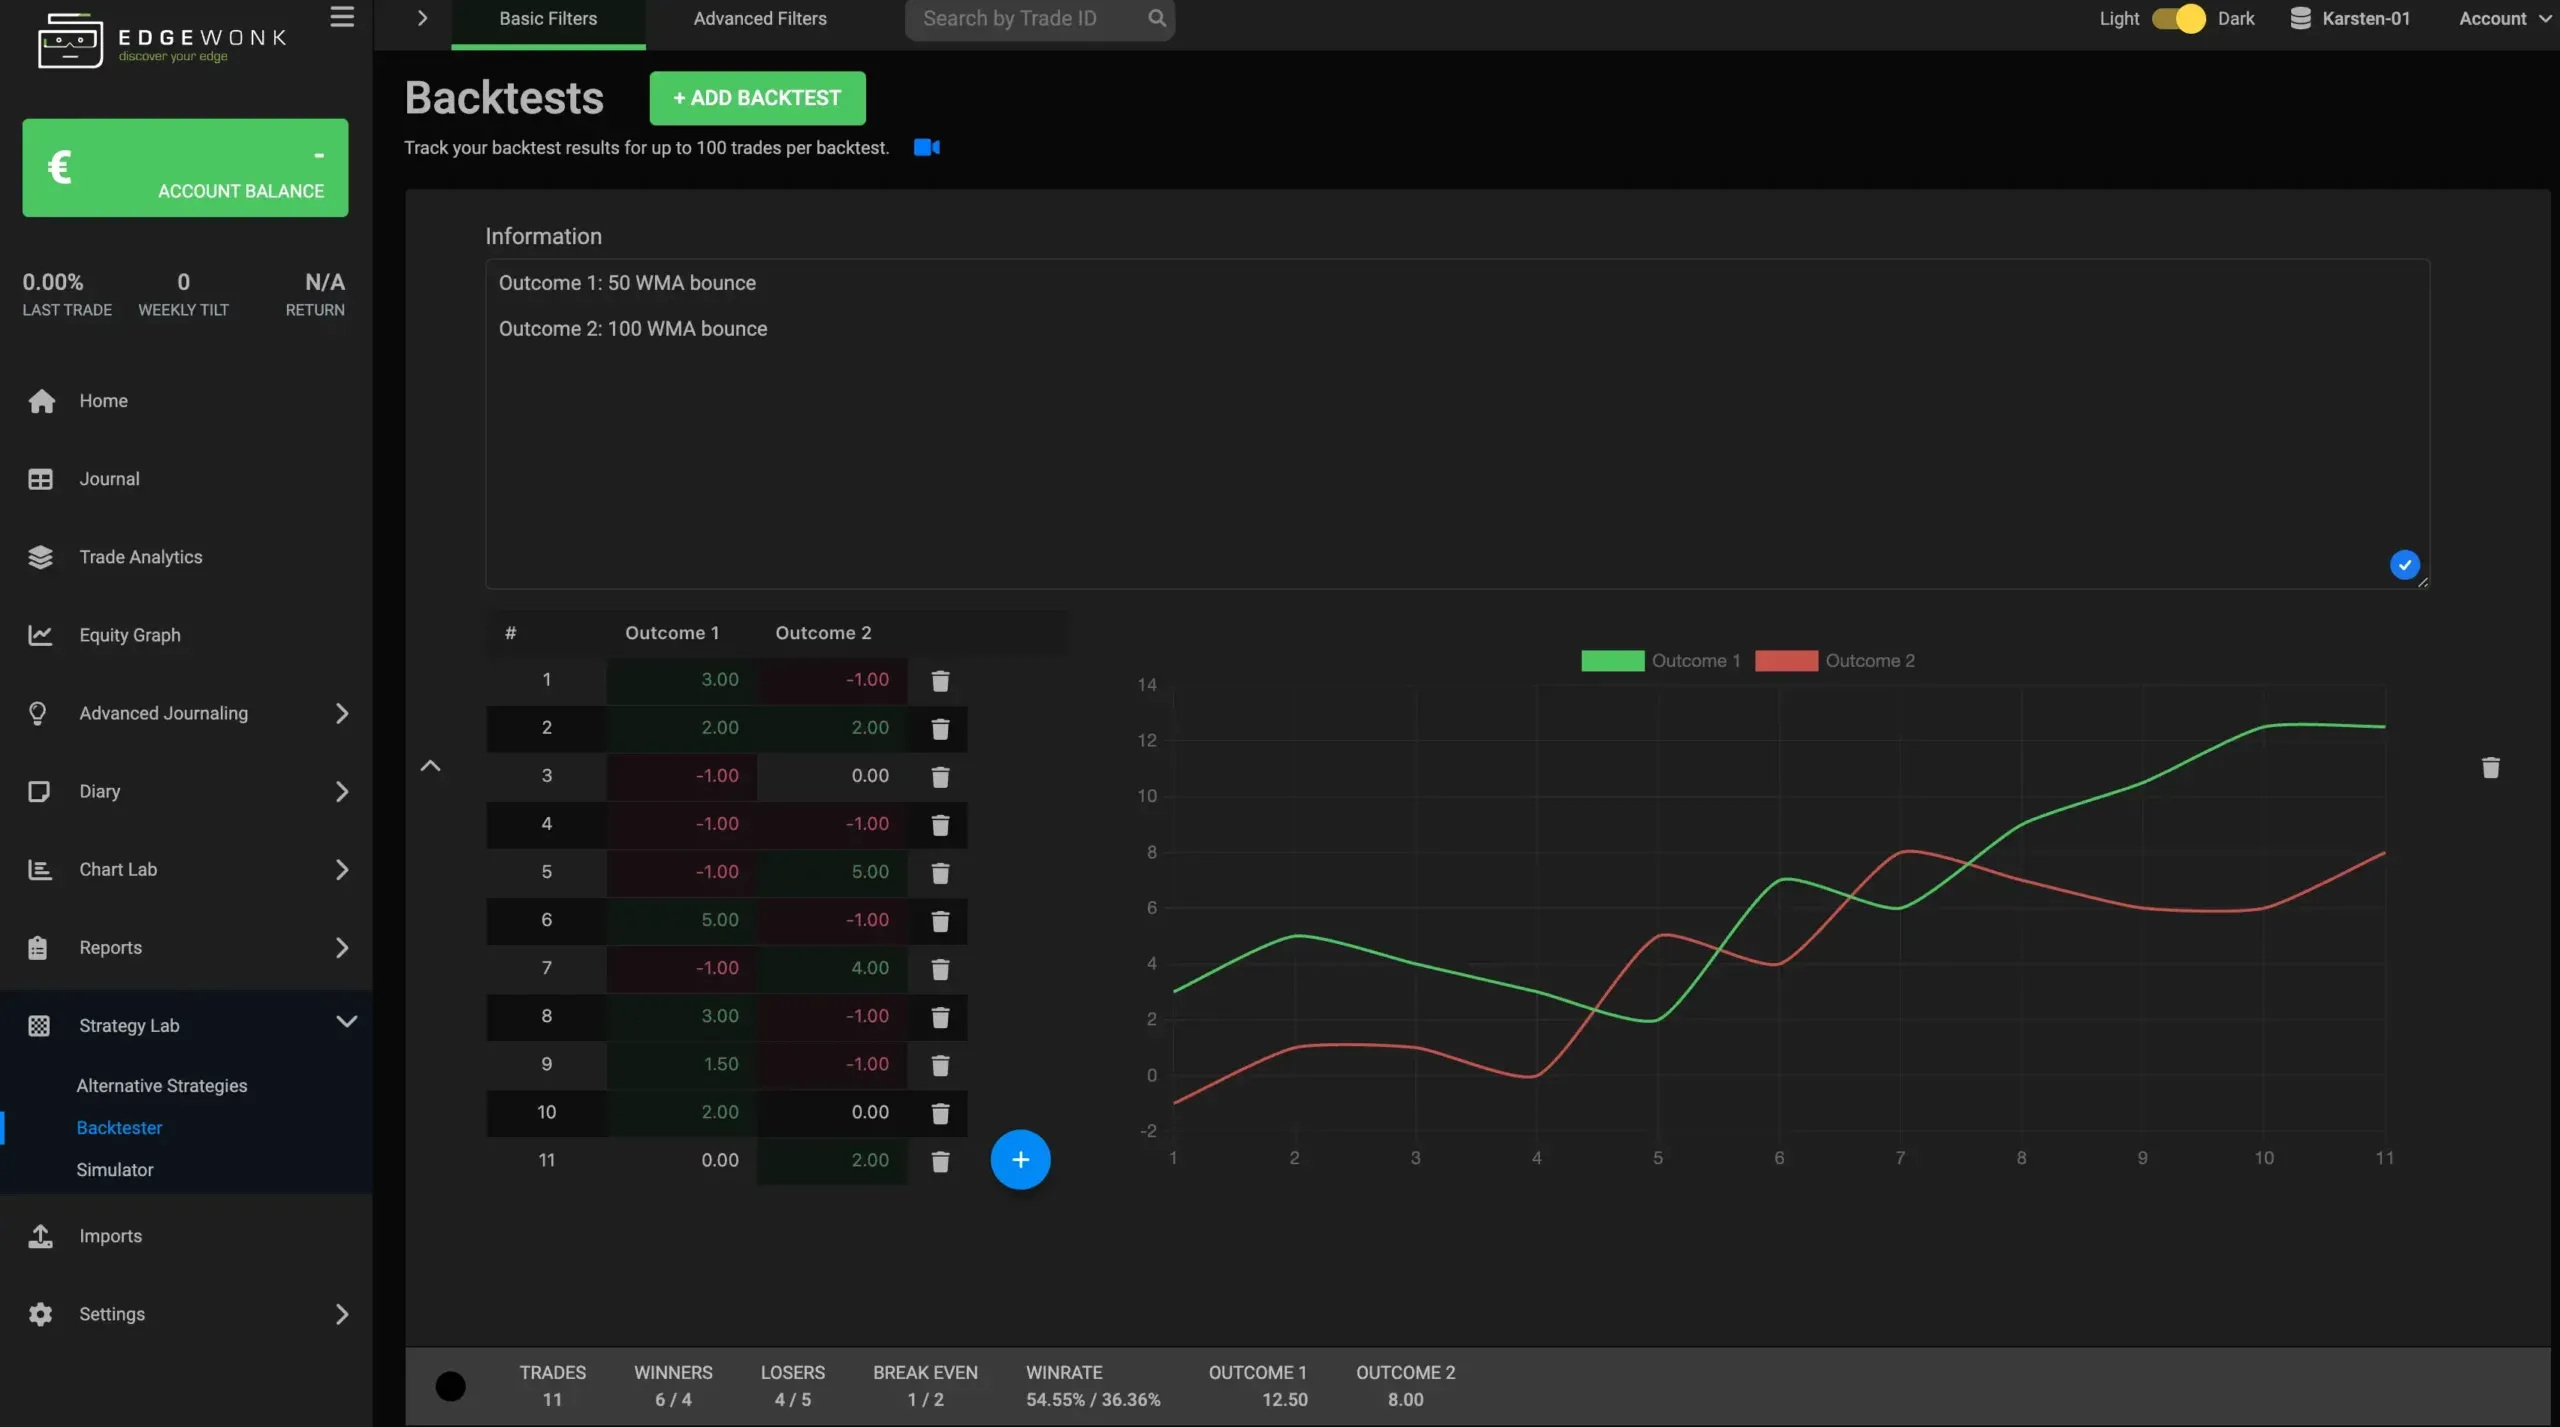 The Edgewonk backtester puts two variants side by side, here the bounce at the 50 and at the 100 WMA. Up to 100 trades can be recorded per backtest.
A comparison of two variants tells you more than a single figure. To compare two entry rules, test both on the same dataset. That is exactly what the backtest functions of the journals are built for. Providers of ready-made systems also advertise with backtests, so always ask how such figures were produced.
The four most common mistakes in backtesting
Four mistakes come up again and again when testing in TradingView. The full version, with a worked example and the robustness checks, is in our backtesting guide.
- Trading costs are missing: spread, commission and slippage do not appear automatically in Bar Replay, and in the strategy report only if you enter them. Build them in before you judge a win rate.
- The sample is too small: a short test gives an unstable estimate. Even a strategy with a 50 percent win rate can have long losing streaks.
- The rules are changed during the test: if you move the stop in Bar Replay after a loss, you are testing your feelings. Every change belongs in a new run.
- The strategy is tailored to the past: if you turn the parameters in the strategy report until the curve looks nice, you create overfitting. The counter-check is an out-of-sample test on data you did not use to build the strategy.
Advantages of backtesting with TradingView
- Free start: Bar Replay works on daily charts on the free plan too, so a test costs nothing at first.
- No coding needed: the manual way works with mouse and position tool, entirely without code.
- Both methods in one interface: manual test and strategy report sit on the same chart, so there is no switching tools.
- Realistic decision situation: the hidden right edge of the chart forces you to decide without knowing the outcome.
- Same chart setup as live: indicators, time window and layout are the same as in live trading.
Disadvantages of backtesting with TradingView
- Intraday replay costs money: minute replay starts with Essential, with six months on the 1-minute chart. Automatic intraday backtests also work on Basic within its limits.
- A lot of time: 250 to 500 manual trades are hours to days of work per market and time frame.
- Costs are not included automatically: you have to add spread, commission and slippage yourself.
- No portfolio evaluation: you always test a single symbol, not a whole portfolio.
- Deep Backtesting starts at Premium: testing beyond the loaded intraday chart range requires Premium or higher. Premium costs $59.95 a month, billed annually. Daily charts already display all available history.
How to improve your strategy after the test
The evaluation is only the beginning; it gets interesting when you sort the trades. Do not look at them as one total, but split by time of day, day of the week, direction and market phase. Often the whole loss comes from a single group, and the result turns once that group is removed.
- Time window: at which times and on which days does the setup work? Trade mainly then.
- Direction: are long or short trades more successful? A clear difference points to a market phase, not to a property of the strategy.
- Reward-to-risk ratio: move target and stop as a test and check how win rate and result change together.
- Time frame: the same rule can run much more steadily one level higher, because fewer false signals appear.
Grading the setups by quality usually brings more than any change of parameters. Grade every setup from A to F when you record it, and then evaluate the grades separately. In many cases it turns out that the weak setups cost the whole result. Fewer trades of higher quality are then the more effective lever.
Every change needs a new run. An optimization that was only checked on the old data set is a hypothesis. Only a fresh period shows whether the improvement holds, which is the idea behind the out-of-sample and walk-forward tests in our guide to algo trading. If you want to automate this cycle permanently, specialized tools such as the strategy testing in TrendSpider or the Forex Tester software can help.
Conclusion: backtesting turns a guess into a number
Backtesting is for traders what training is for athletes. It turns a guess into a number and a number into confidence. If you have seen a setup hundreds of times, you recognize it faster in the live market and do not doubt your own strategy after three losses.
TradingView covers both ways, and the choice depends on your trading style. Discretionary approaches belong in Bar Replay, fixed rules in the strategy report. If you work on the daily chart, you get by without a subscription. For intraday Bar Replay, you need at least Essential. Basic also supports automatic strategy backtests on intraday charts, with limited history and basic report metrics. Deep Backtesting requires Premium or higher.
The most important advice is not about the tool but about the attitude. Really play the data candle by candle and only then decide. Drawing setups in afterwards feels good and is worthless. And include the trading costs from the start, or you are testing a strategy that does not exist.
Backtesting remains an ongoing process. Every new insight is a reason to sharpen the rules and test again. A consistent process of testing and review helps you distinguish a normal losing period from a strategy that needs to be reassessed.
Frequently asked questions about backtesting on TradingView
Is backtesting on TradingView free?
Partly, depending on the chart interval. On the free Basic plan, Bar Replay runs on daily charts and higher over the full history, and Pine Script strategies can be evaluated with the basic metrics. Replay on minute charts starts with Essential at $12.95 a month, billed annually, and there it reaches six months back on the 1-minute chart.
Which plan do I need for intraday backtests?
For manual replay on minute charts, you need Essential or higher. Automatic strategy backtests also work on Basic, within its data and reporting limits. With annual billing, Essential costs $12.95 a month and provides six months of 1-minute replay history; Plus at $29.95 provides one year. Premium at $59.95 adds seconds-based replay and access to all available time-based history, subject to the futures exceptions explained above. The current plans are on the TradingView pricing page.
What is the difference between Bar Replay and the strategy report?
Bar Replay plays the chart candle by candle, and you draw every trade by hand. The strategy report (formerly the Strategy Tester) runs a strategy written in Pine Script automatically and delivers a finished report. The automatic method can use a ready-made strategy without any coding.
Can I backtest without coding?
Yes. Bar Replay works entirely without code. You mark the starting point, play the candles forward and record the trades with the position tool. You can also run a ready-made Pine Script strategy without writing code. Coding skills are needed to create or modify your own strategy logic.
How many trades does a meaningful backtest need?
Aim for 100 trades per market and time frame as a practical starting point, not a statistical cutoff. On short time frames, 250 to 500 trades can be a working target. The sample needed depends on the strategy and its results. Smaller samples have greater uncertainty, and even larger samples need checks across market conditions and unseen data.
Which metrics matter?
Four metrics matter most: win rate, result in R, maximum drawdown and profit factor. The profit factor is the ratio of gross profits to gross losses. It is important that spread, commission and slippage have been deducted first.
How far does TradingView’s Deep Backtesting reach?
It calculates over the full available history of a symbol instead of only the loaded chart range, limited to two million bars and one million trades. The function is available on Premium and higher plans, and it uses the same strategy report.
This article was written by Bjarne Claussen, who trades systematically in crude oil and the S&P 500 and builds his strategies in backtesting pipelines in Python. This is educational content, not investment advice.
This article is translated from the German edition on kagels-trading.de.
More TradingView guides
- Choose a plan
TradingView Review 2026: Plans, Pricing and Is It Worth It?
Prices of all plans in US dollars, real-time data costs, Black Friday and whether it is worth it.
- Save on a plan
TradingView Black Friday 2026: Dates, Deals and Best Plan
Expected 2026 timing, verified past deals and what to check before buying a plan.
- Practice without risk
TradingView Paper Trading: Setup, Limits and Tips (2026)
Set up the free paper trading account, place your first orders and learn where the simulation falls short.
- Compare platforms
TradingView Alternatives 2026: 7 Platforms Tested
Seven platforms compared, with a decision aid for when switching makes sense.
- Connect a broker
Best Brokers for TradingView 2026: A Guide for US Traders
Which US brokers work with TradingView and what to check before you connect one.
- Write an indicator
Pine Script in TradingView: Basics, Editor and Version 6
Pine Script basics, the editor and version 6, with code you can copy.
- Use the AI Copilot
TradingView AI Copilot Review: 7 Tests, Price and Limits
Seven real tasks for the paid AI add-on: what it costs, what it got right and where you must check it.
- Filter stocks with the screener
TradingView Stock Screener: How to Use It and What It Costs
How the stock screener works, what the free plan can do, the Pine Screener and three tested popular screens.