
Opening Range Breakout: Rules, Charts and Common Mistakes


Contents
- Opening range breakout in 30 seconds
- Opening range: what the high and low tell you
- Five, fifteen or thirty minutes: compare the windows
- Trading the breakout: one worked rule set
- A breakout that followed through: SPY on 2026-10-20
- A failed breakout: SPY on 2026-10-21
- Does the strategy work? Different evidence answers different questions
- Markets and sessions: define which open you mean
- Common mistakes: changing the rules after the move
- Frequently asked questions about opening range breakouts
- About the author
An opening range breakout is a plan with fixed times. You mark the high and low of the first few minutes after the market opens, wait for that window to close, and treat the first move beyond that range as your direction signal. The rule is clear and keeps the plan small.
The catch is just as clear. Many breakouts fail, costs eat into small moves, and the method is only as good as the example rule set actually followed. This guide shows what the opening range is, how 5, 15 and 30-minute windows differ in timing and geometry, and one SPY example with entry, stop and modeled exit. Our profile of Toby Crabel covers the practitioner who popularized short-term opening patterns. This article follows our editorial policy and is for education, not investment advice.
Opening range breakout in 30 seconds
- A completed window. The opening range is the highest high and lowest low of a fixed window after the regular open, for example 9:30 to 9:45 a.m. Eastern Time. Nothing counts until that window has fully closed.
- An explicit trigger. The first fully closed signal bar whose close is strictly beyond a boundary fixes the direction. The entry is the next bar’s open and must itself open strictly on the breakout side.
- A planned stop and target. The stop sits at the opposite range boundary. The target is two times the distance from entry to stop. One trade per day; the first invalid signal ends the day.
- These are model exits. Stop, target and the scheduled-close exit are plan levels, not fills. Chart examples cannot prove a win rate; execution costs eat small moves.
Opening range: what the high and low tell you
The opening range is the price corridor built by the first bars after the open. The range high and low quickly become reference prices that many traders watch. ORB is the common short form for an opening range breakout: a move that trades beyond that corridor once the window is complete.
Different schools read the first move differently. Smart Money Concepts readers call it a liquidity sweep: resting orders above the range high get hit, then price turns down. That is one possible reading and not required to trade this method. FVG, ICT and institutional stop-hunt readings are optional interpretation, not proven cause.
The historical distinction matters here. Toby Crabel’s 1990 book used the opening price plus a stretch value derived from recent daily ranges, not a fixed time window. The modern 5, 15 or 30-minute windows are a simpler cousin, and Crabel’s own fund record is not evidence for this version.
Five, fifteen or thirty minutes: compare the windows
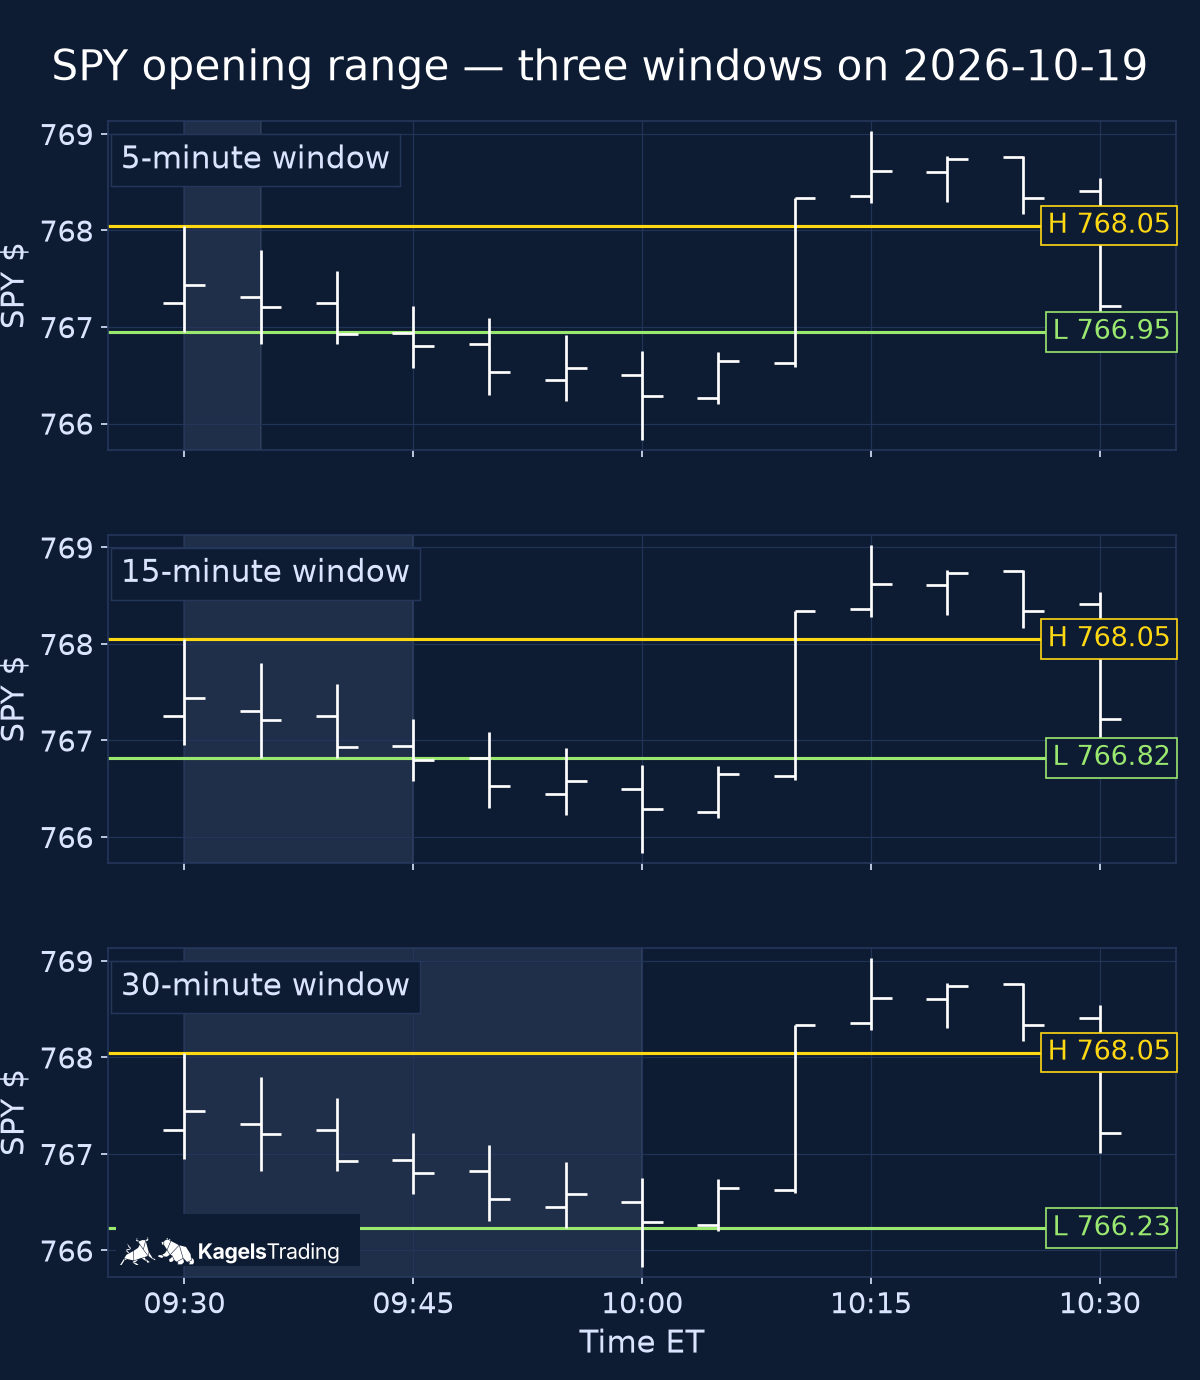 Click to enlarge
Source: Kagels Trading, own measurement on IBKR delayed data.
| Window | Range high (USD) | Range low (USD) |
|---|---|---|
| 5 minutes | 768.05 | 766.95 |
| 15 minutes | 768.05 | 766.82 |
| 30 minutes | 768.05 | 766.23 |
The window is the first decision, not the entry. It fixes when the range is complete and when a signal can first appear. The US cash session opens at 9:30 a.m. ET, as published by the NYSE Arca hours and calendars page; the overnight context sits in our guide to trading sessions.
The differences across windows are timing and geometry, not performance. A longer window is built from more bars, so its range cannot be narrower than the same morning’s shorter window. A longer window also pushes the earliest possible signal later, because the first signal candidate opens after the window closes. Which window suits a particular trader is an empirical question that chart illustrations cannot answer.
Trading the breakout: one worked rule set
One rule set runs through every chart below. This is a teaching baseline, not a tuned strategy and not a claim about profitability. The rules below are a fixed illustrative set used to produce the two example trades.
- Instrument and data: SPY, US regular session, time zone America/New_York.
- Opening range: 15 minutes, 09:30 to 09:45 ET. Range high and low use the full high and low of each bar inside the window.
- Signal bar: 5-minute bars. The first candidate is the 09:45 to 09:50 bar; a long signal needs a close strictly above the range high, a short signal strictly below the range low.
- Entry: at the open of the next 5-minute bar, so no earlier than 09:50 ET. That entry open must itself be strictly on the breakout side; a boundary-equal open, an open back inside the range or a gap through the stop is a skip. The first invalid signal ends the day; no re-arm.
- Stop and target: stop at the opposite range boundary. The risk per share is D = E − S for a long and D = S − E for a short. The 2R target is E + 2D for a long and E − 2D for a short.
- One trade per day. Entries only when the entry bar’s open is strictly before 12:00 noon ET; latest eligible signal bar is 11:50 to 11:55. Any open position is modeled exited at the open of the 15:55 ET bar; the printed 16:00 session close is auction-driven and is not used as a modeled exit.
- Finest-available resolution: 1-minute bars where present, 5-minute bars otherwise. If one resolution bar touches both the stop and the target, the day is marked ambiguous and is not used for the example charts.
This design has deliberate limits. The stop can be wide on a wide range, which forces a smaller position size. Execution costs come off every trade and matter most on small moves. The entry price is a model entry: the price actually received would include slippage and spread.
A breakout that followed through: SPY on 2026-10-20
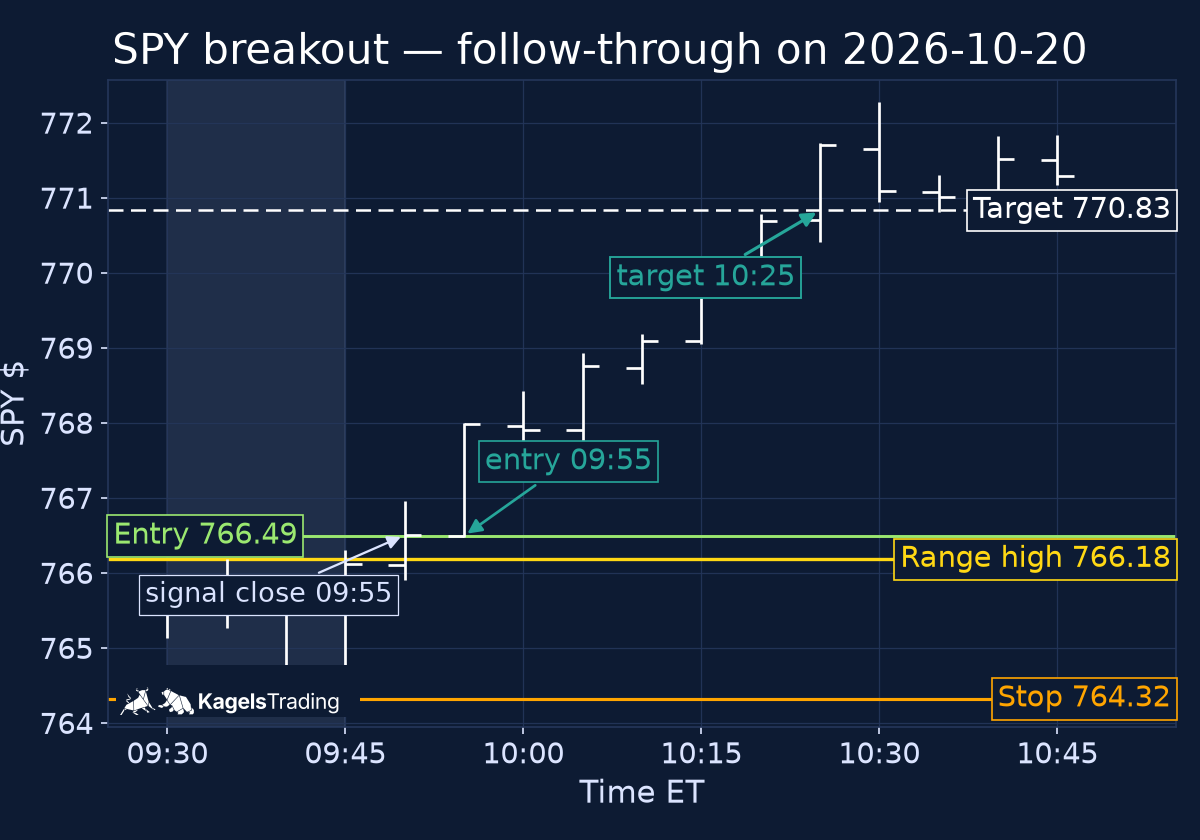 Click to enlarge
Source: Kagels Trading, own measurement on IBKR delayed data.
The rules produced a long trade on 2026-10-20 that reached the 2R target. The signal bar closed strictly above the range high and the next bar’s open became the model entry on the breakout side. The 10:25 to 10:30 bar reached the 2R target before any other exit. The numbers below set out range, entry, stop and target in one place.
| Field | Value |
|---|---|
| Range high / low (USD) | 766.18 / 764.32 |
| Signal bar (close 09:55) | 766.50 |
| Model entry (open 09:55) | 766.49 |
| Stop | 764.32 |
| Risk per share D | 2.17 |
| 2R target | 770.83 |
| Outcome | target reached during the 10:25–10:30 bar |
Position sizing starts with the planned loss before costs. With a US$500 gross risk budget and a US$2.17 stop distance, rounding down gives 230 shares. The planned loss at the stop is US$499.10 before costs; gaps and slippage can make the actual loss larger.
Costs and buying power can reduce that share count. If US$500 is the total budget, first reserve an allowance for expected commissions, spread and slippage, then size the remaining risk. At the model entry, 230 shares have a notional value of US$176,292.70. Reaching the target would produce US$998.20 gross, before costs. This arithmetic does not establish that an account has the buying power to take the position.
A failed breakout: SPY on 2026-10-21
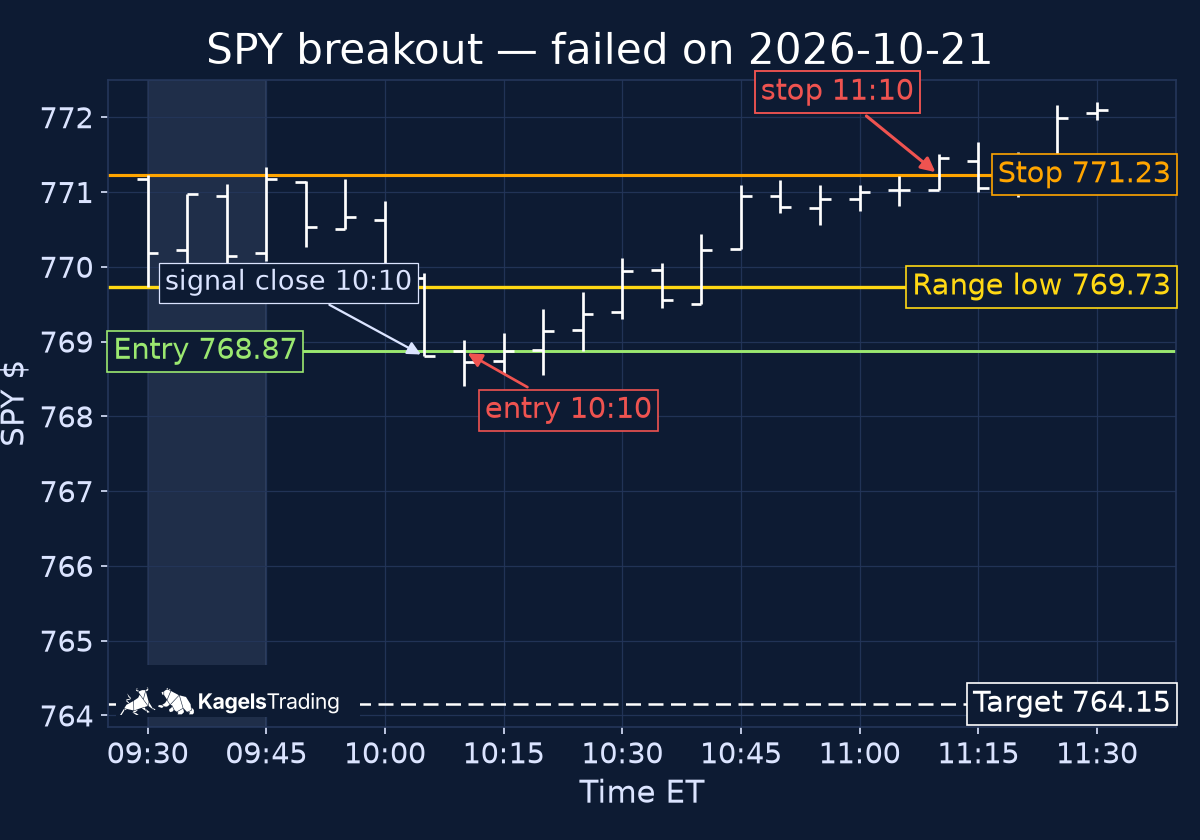 Click to enlarge
Source: Kagels Trading, own measurement on IBKR delayed data.
The same rules on 2026-10-21 produced a short trade that stopped out. The signal bar closed strictly below the range low, the next bar’s open became the entry on the breakout side, and the stop sat at the opposite range boundary. The 11:10 to 11:15 bar then crossed the stop level. The numbers below set out range, entry, stop and target in one place.
| Field | Value |
|---|---|
| Range high / low (USD) | 771.23 / 769.73 |
| Signal bar (close 10:10) | 768.80 |
| Model entry (open 10:10) | 768.87 |
| Stop | 771.23 |
| Risk per share D | 2.36 |
| 2R target | 764.15 |
| Outcome | stop crossed during the 11:10–11:15 bar |
A stop level is a plan, not a fill guarantee. On fast moves and around news, the price that actually fills a stop can be worse than the level on the chart. The rules treat a bar that opens beyond the stop as a loss recorded at that bar’s open, which honestly allows a loss greater than 1R; in these two examples no gap-through occurred, so both exits were recorded at their drawn levels.
Does the strategy work? Different evidence answers different questions
Different evidence answers different questions. The two charts above are illustrations of the rules on real bars. Two selected days, one win and one loss, can co-exist on the same rule set, and five sessions are a demonstration, not a study.
A published study shows what its own design shows. Our guide to breakout trading summarizes a QQQ paper by Carlo Zarattini and Andrew Aziz, Concretum version dated September 22, 2025: Can Day Trading Really Be Profitable? (PDF). Table 1 takes direction from the first 5-minute candle (long if that candle closed above its open, short if below, doji skipped), enters at the open of the second 5-minute candle, places the stop at the first candle’s extreme, exits at a 10R target or the session close, and reports results net of commissions at $0.0005 per share with no slippage. That design is different from the rules above; its result cannot be imported as a result for these rules.
Own research needs the whole box opened. This article does not add a backtest. We examined the five available sessions from October 19 to 23, 2026 and selected the first eligible target-reaching trade and the first eligible stopped trade in chronological order. Any later test would freeze the full specification and keep the data and the trade list for audit.
Live trading records real fills. A journal of actual trades captures the spread, slippage and discipline costs that a backtest can hide; our guide to the trading journal shows one way to record each trade. Live logs are not automatically unbiased or representative, but they do include costs that studies and charts do not.
Markets and sessions: define which open you mean
SPY and the US cash session are easy to anchor; other markets need care. The ES and NQ index futures already trade through the Globex session before the US stock open, so a 9:30 a.m. ET anchor on an index future is a cash-session anchor, not the futures open. The exact contract windows sit in futures market hours.
Forex has no single opening bell. Brokers and data providers use slightly different session windows, and spot volume is usually a tick count rather than exchange turnover. If a time-based opening range is used in forex, pick one center and one time zone and write them down.
Daylight saving shifts the clock, not the chart. For a few weeks each year the US and Europe are not aligned, and a fixed local time can move by an hour relative to another center. The ET anchor used in this article moves automatically with ET.
Common mistakes: changing the rules after the move
These mistakes change the intended rules. Each item below is written to be read before, not after, a losing day.
- Trading before the window closes. A touch of the range high at 09:38 is not a signal under a 15-minute rule, no matter how convincing the bar looks.
- Hindsight entries. Marking the entry at the signal close instead of the next bar’s open turns a plan into a chart story.
- Confusing the window with the bar size. A 15-minute range can be read on 1-minute, 2-minute or 5-minute bars. Mixing sizes changes the signal.
- Cherry-picking winners. Posting one followed-through day and skipping the losses is not evidence of a method.
- Ignoring costs. On a small SPY move, the spread and commission can be a meaningful share of the 2R.
- Moving the stop. If the stop sits at the opposite boundary on entry, it stays there. A moved stop is a different trade.
- Treating optional filters as proven. FVG, liquidity, higher-time-frame bias and round-number levels can be useful lenses; they are not add-on edges until each one is tested on top of the base rule.
Frequently asked questions about opening range breakouts
What does ORB mean?
ORB is short for opening range breakout. The opening range is the highest high and lowest low of a fixed window after the market opens; the breakout is a move beyond that range once the window has fully closed.
Is five or fifteen minutes better?
Neither is universally better. A 5-minute window completes the range earliest, so its earliest close-confirmed signal is 09:40. A 15-minute window completes later and its high-low range cannot be narrower on the same morning. The eventual entry-to-stop distance depends on the entry price too. Which one suits a trader depends on the market, the costs and the time they can watch the screen, and only a stated test on their own data decides it.
Must price close outside the range?
It depends on the rule you lock in. The example above requires a fully closed 5-minute bar whose close is strictly beyond the range. A rule set can also use an intraday touch of the level, which is mechanically different: it triggers on the first tick through the level rather than on a bar close. Pick one and write it down before the trade.
Does every breakout work?
No, and the method is built around that fact. The stop and the one-trade-per-day rule exist for exactly that case. A breakout can also close back inside the range and then run later, which is why the rule set here closes a trade on the stop and does not re-enter the same day.
Can I use ORB on futures?
Yes, but name the open you mean. The ES and NQ futures run almost around the clock, so a 9:30 a.m. ET anchor on an index future is a cash-session anchor, not the futures open. See the Markets and sessions section above for the direct link to our futures hours guide.
Is this the same as Crabel’s method?
No, and the difference matters. The modern 5, 15 or 30-minute time-window ORB is a simpler cousin of Toby Crabel’s stretch-based approach. Crabel’s long-run fund record cannot be used as evidence for the time-window version.
This US edition is based on our German edition on kagels-trading.de and has been adapted for US readers.
More Market Hours guides
- Check futures hours
Futures Market Hours: CME Trading Times for ES, Oil and Gold
Weekly and daily hours of ES, crude oil, gold, Treasuries, grains and bitcoin futures in ET, CT and London time.
- Time your trades
Trading Sessions: Asian, London and New York Hours in ET
The Asian, London and New York sessions in ET, London and India time, their overlap, RTH and ETH, and how to set up your chart.
- Plan around expiry
Triple Witching 2026 and 2027: Dates and What Happens
Triple witching dates for 2026 and 2027, settlement times, and what 25 years of SPY data show about volume and the week after.
- Trade before the open
Pre-Market and After-Hours Trading: Hours, Risks, Brokers
Pre-market, after-hours and overnight hours at the exchanges and at Schwab and Interactive Brokers, the risks, and what SPY data show about the overnight move.
- Check exchange hours
Stock Exchange Hours Worldwide: Opening Times in ET
Opening and closing times of the major exchanges in the Americas, Europe and Asia-Pacific, in local and New York time, with lunch breaks.