
Profit Factor in Trading: Formula, Calculator, Good Values


Contents
- Profit factor in 30 seconds
- What is the profit factor in trading?
- How to calculate the profit factor: formula and example
- What is a good profit factor?
- Profit factor, payoff ratio and expectancy: keep them apart
- What my own journal says about the profit factor
- Where the profit factor is strong and where it misleads
- Where to find the profit factor
- Conclusion: a good filter, but no proof
- Frequently asked questions about the profit factor
- About the author
A trader shows you a profit factor of 3.4, and the one question that matters is: over how many trades? With twelve closed positions, chance can easily dominate the number. With three hundred, it starts to mean something. That is the core of this guide.
The profit factor is one of the most quoted trading metrics, and one of the most often miscalculated. Some explainers use a formula that measures something else, the payoff ratio. If you use it, you compare systems that cannot be compared. I show you the correct formula and the numbers from two real records: my own journal with 61 trades and a signal system with more than 350 trades. This article follows our editorial policy.
Profit factor in 30 seconds
- Formula: profit factor = sum of all winning trades divided by the sum of all losing trades. Sums, not averages.
- The line at 1.0: above it, the system makes money; below it, it loses. A value of 2.0 means $2 of profit for every $1 of loss.
- Two real values: my journal shows 2.22 over 61 trades. Our former swing signal service showed 1.37 over 356 trades. Here, the smaller sample shows the higher value.
- The main trap: a profit factor without the number of trades and the period is not a metric, it is a claim.
- What it cannot do: it says nothing about the drawdown or the order of the losses. A system with a profit factor of 1.5 can lose half the account along the way.
What is the profit factor in trading?
The profit factor is the ratio of the sum of all winning trades to the sum of all losing trades of a trading system.
The metric answers a single question: how many dollars of profit stand against each dollar of loss? A profit factor of 1.5 means the system made $1.50 for every dollar it lost. Below 1.0, the ratio flips and the system loses money. You will also see it written as gross profit to gross loss ratio.
It appears in every backtest report. That is the summary a platform produces after testing a trading strategy, for example in backtesting software or a broker’s strategy tester. The MetaTrader 5 report and TradingView both list it as a standard figure.
Its appeal is that it has no unit. The currency cancels out. You can hold a forex system with $10 positions against a stock system with $10,000 positions. That convenience is also what makes it easy to misread, as the next sections show.
How to calculate the profit factor: formula and example
You need two numbers from your journal: gross profit and gross loss. Gross profit is the sum of all trades that closed in profit. Gross loss is the sum of all trades that closed at a loss, counted as a positive amount. A trading journal or journal software such as TraderSync adds up both sums automatically from imported trades.
Profit factor = gross profit ÷ gross loss.
A round example: you close 40 trades in a quarter. The winners make $12,000 together and the losers cost $7,500. Your profit factor is 12,000 ÷ 7,500 = 1.6: $1.60 earned for every dollar lost, with $4,500 net.
What goes into the sums matters as much as the formula. Include commissions, spreads and, for positions held overnight, financing costs. Otherwise you measure a system that does not exist. With short holding times the difference is large: if you trade often, the costs alone push your profit factor down noticeably.
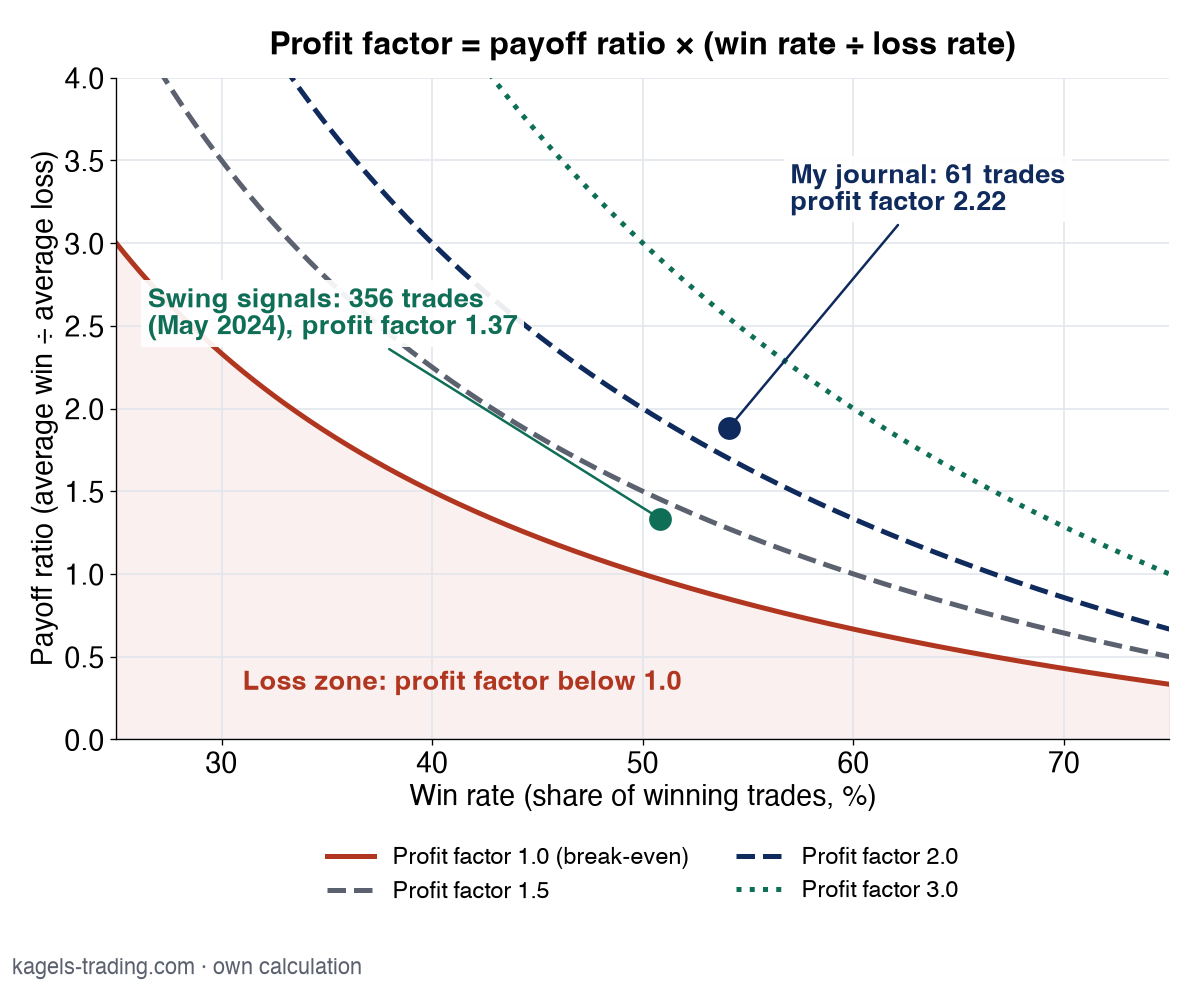
A second way to calculate it gives the same result and explains more. It splits the profit factor into its two drivers: profit factor = payoff ratio × (win rate ÷ loss rate). The payoff ratio is the average win divided by the average loss.
So there is no single road to a good profit factor. You can get there with a high win rate, with large winners, or with a mix of both. The chart shows which combinations give which value.
 Click to enlarge
Source: Kagels Trading, own calculation.
Read an example off the chart: at a 40% win rate, you need a payoff ratio of 3.0 for a profit factor of 2.0. At 60%, a payoff ratio of 1.33 is enough. That is the arithmetic reason why trend followers with low win rates can survive.
Profit factor calculator: plug in your own numbers
Enter the values from your journal. Besides the profit factor, the calculator shows the win rate, the payoff ratio and the expectancy per trade, so you can see at a glance which metric you are looking at. The preset values are the 61 trades from my journal.
Profit factor
2.22
Above 1.0: 2.22 units of gain for every unit of loss.
| Gross profit (sum of winners) | 59.73 |
|---|---|
| Gross loss (sum of losers) | 26.88 |
| Win rate | 54.1% |
| Payoff ratio (average win ÷ average loss) | 1.89 |
| Expectancy per trade | 0.54 |
Only 61 trades: below about 100 trades, chance can have a large effect on the profit factor. Treat it as a first estimate.
Enter both amounts in the same unit: both in dollars, both in percent or both in R (multiples of your risk per trade). Enter losses as a positive number. Use a dot as the decimal point (1.81) and commas only to group thousands (1,250). Use values after commissions, spreads and financing costs. Preset: the 61 trades from my journal. Not investment advice. Nothing you enter is stored or sent.
Two things stand out quickly when you try it. The profit factor moves a lot if you change only the win rate by two or three trades and leave the averages alone. That is exactly the part the common wrong formula leaves out. On the other hand, nothing changes if you double all amounts: the profit factor knows neither account size nor time.
What is a good profit factor?
There is no fixed standard, and anyone who sells you one ignores holding time and trading frequency. A scalping system with a hundred trades a week shows different values than a position trading approach with twelve trades a year. The ranges below come from my own practice with client systems and my own evaluations. They are not an industry standard.
| Profit factor | My assessment |
|---|---|
| below 1.0 | The system loses money. Costs and losses exceed the gains. |
| exactly 1.0 | Break-even: gains and losses cancel out after costs. |
| above 1.0 up to 1.2 | Positive on paper, fragile in practice. Higher costs or a bad phase tip it over. |
| above 1.2 up to 1.6 | Solid and realistic. In my experience, most systems that run for years sit around 1.3 to 1.6. |
| above 1.6 up to 2.5 | Very good, if proven over several hundred trades and several market phases. |
| above 2.5 up to 3.0 | Rare over long periods. Check the sample, the costs and the largest single trade. |
| above 3.0 | Needs an explanation. Usually a sample that is too small, an over-fitted backtest or one outlier. |
I mean the last row seriously. I have not yet seen a trading system that held a profit factor above 3.0 over years and more than a thousand trades. Such values almost always come from short windows, and they shrink as the sample grows.
The number alone never carries a decision. State a profit factor always with three things: the number of trades, the period and the maximum drawdown. If one of them is missing, the number is marketing.
Profit factor, payoff ratio and expectancy: keep them apart
This is where the most common mistake sits. Some explainers define the profit factor as average win divided by average loss. That is the payoff ratio, a different metric. The difference is not academic: that formula ignores how many winners and losers there were, so the win rate drops out.
Check it with a real case. A swing trading signal service we used to run at Kagels Trading, with CFD signals for European clients (CFDs are not available to US retail traders), reported these figures in May 2024, after 356 closed trades since September 19, 2022. They come from the service’s own report of its signals, not from an audited account:
| Figure (report, May 2024) | Value |
|---|---|
| Closed trades | 356 |
| Win rate | 50.84% |
| Average win per position | 32% |
| Average loss per position | 24% |
| Average result per position | 4.40% |
| Profit factor | 1.37 |
| Maximum drawdown at 2% / 1% risk per trade | 11.22% / 5.61% |
The wrong formula gives 32 ÷ 24 = 1.33, the report shows 1.37. The correct calculation from the same averages gives 1.333 × (50.84 ÷ 49.16) = about 1.38. The small gap to 1.37 may come from the rounded averages in the report; the individual trades behind it are not available to check that.
The gap comes from the win rate. Because there were slightly more winners than losers, the winning side weighs more than a plain comparison of averages shows. With a 35% win rate, the error runs the other way and gets much larger: the payoff ratio is then far above the profit factor. The wrong formula systematically overrates weak systems with low win rates.
| Metric | Formula | Answers |
|---|---|---|
| Profit factor | sum of wins ÷ sum of losses | How much profit stands against each dollar of loss? |
| Payoff ratio | average win ÷ average loss | How large is a winner compared with a loser? |
| Expectancy | win rate × average win − loss rate × average loss | What does one trade bring on average? |
The three numbers complement each other. The expectancy tells you what a trade brings on average. The profit factor tells you how the realized gains compare with the realized losses. Only together do they give a picture, and the maximum drawdown belongs next to them as the third figure. If you size your risk from these numbers, the Kelly criterion shows where the mathematical limit lies.
What my own journal says about the profit factor
For my trading math, I published 61 closed trades from four weeks, net after fees. The figures: 54.1% win rate, an average win of 1.81R and an average loss of 0.96R. R stands for the amount risked per trade, so the numbers do not depend on account size. The full evaluation is on the German site (trading math, in German).
That gives a profit factor of 2.22. Calculated from the sums: 33 winners at 1.81R against 28 losers at 0.96R, so 59.73R against 26.88R. By the table above, that would be a very good value.
My expectancy did not hold at its early level. After the first 29 trades, my expectancy was +0.73R per trade; over all 61 trades it was only +0.54R. That is a clear drop. A common reason is regression to the mean: an early run often contains some luck that fades as more trades come in. Whether that is the cause here, 61 trades cannot show.
That is why I do not treat 2.22 as a reliable statement about my system. 61 trades are too few to separate skill from chance. The signal service shows the contrast: over 356 trades its report gave 1.37, a value in the range where long-running systems usually sit. Two records do not prove a rule, but a larger sample is the better basis for judging a system.
 Click to enlarge
Source: Kagels Trading.
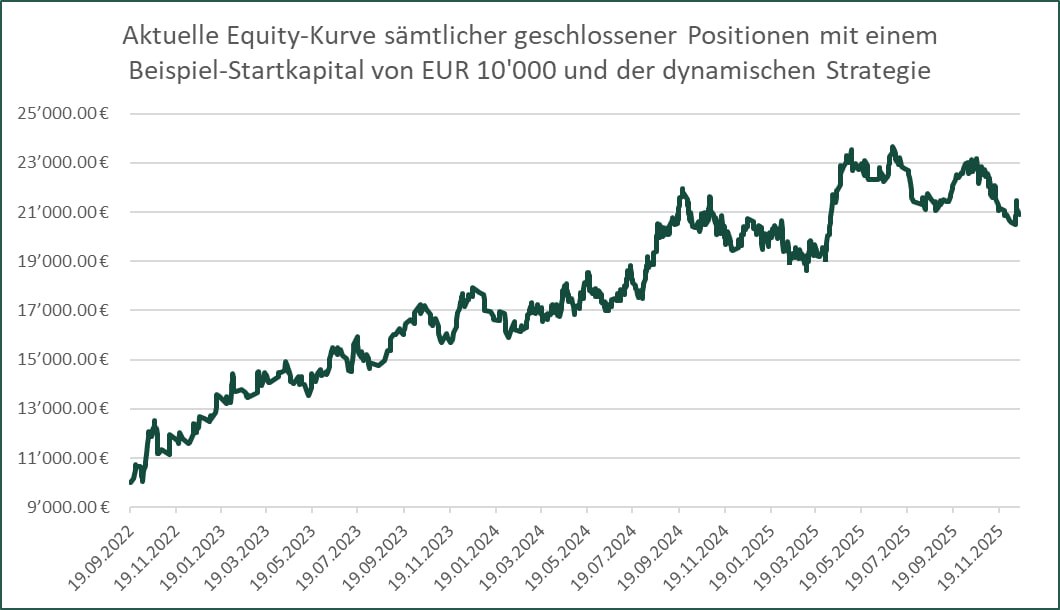
The curve shows what the metric does not tell you. Between September 2024 and April 2025, the model account moved sideways to lower, although the curve ends well above its start. The profit factor knows no order. Whether your losses come evenly spread or bunched into eight months does not change the number. It changes everything for your account, as the prop firm drawdown test shows with real trades.
Without a clean journal, you cannot do this calculation at all. You need the realized amount after costs for every trade. Estimates from memory always favor the winners; that is a known effect, and it reliably pushes the profit factor upward.
Where the profit factor is strong and where it misleads
The metric has its place, but a narrow one: it is good for filtering systems out, not for choosing one. The overview shows its strengths and its weaknesses.
Strengths of the profit factor
- No currency: the number cancels dollars, euros and account size. Two very different systems become comparable.
- Instantly readable: the line at 1.0 needs no explanation. Below it, a system is out without further analysis.
- In every report: backtest software lists it as standard. You do not need to calculate anything if you have the raw data.
- Reacts to both levers: it improves with a higher win rate and with larger winners. That shows you where to work.
Weaknesses of the profit factor
- Blind to drawdown: it says nothing about the order of results. A system with a profit factor of 1.5 can lose half the account along the way.
- Sensitive to outliers: one very large winner lifts the value a lot. Without that one trade, the system often drops below 1.0.
- Weak with a small sample: below about 100 trades, chance can have a large effect on the number. That is exactly where the highest values are advertised.
- Easy to dress up: if you let losers run and average down, you push losses into the future. The profit factor looks good until the position is closed.
- Ignores time: a profit factor of 1.8 over ten years and one over ten weeks are the same number, but not the same result.
The fourth weakness is the most dangerous, because it looks like skill. Martingale approaches, strategies that increase the position after a loss, produce excellent profit factors over long stretches. Then they collapse in a single trade. Sound risk management is therefore not an add-on to the metric but its precondition.
You see the time problem in backtests all the time. If you tune a strategy on historical data until the profit factor looks right, in the end you only measure the past. This over-fitting is one of the most expensive mistakes in trading, because it creates a feeling of safety where there is none.
Where to find the profit factor
You rarely have to calculate the number yourself. Every serious backtest environment shows it, and the large platforms define it the same way. That matters, because it lets you put reports from different platforms side by side.
- MetaTrader 5: the Strategy Tester report defines the profit factor as the ratio of gross profit to gross loss. Gross profit is the sum of all profitable trades, gross loss the sum of all losing trades (MetaTrader 5 documentation).
- TradingView: the Strategy Tester divides the absolute value of all winning trades by the absolute value of all losing trades and counts realized results only; open positions are left out (TradingView help). How to set up such a test is shown in the guide to TradingView backtesting.
- Journal software and code: online journal services that read your broker account show the profit factor next to win rate and expectancy. Python backtesting frameworks and platforms such as QuantConnect report it as well.
One detail is worth a look in the settings. Whether commissions and swaps are included in the report depends on how you set up the test. A backtest without costs gives a profit factor your live account will never reach.
When you compare other people’s systems, a second question comes up. Is there proof, or is the number only on a sales page? A report from a connected account with a full trade history is something different from a rounded number in a graphic.
Conclusion: a good filter, but no proof
The profit factor is the fastest way to sort out a system. If it is below 1.0, you can stop reading. If it is above 3.0, you need an explanation. In between, the real work begins.
My advice after more than four decades in the markets: use it as an entry filter and never decide with it alone. For every number you are shown, ask for the number of trades, the period and the maximum drawdown. Whoever cannot give you these three usually does not have them.
For your own trading, the number is above all a measure of change. Recalculate it every quarter and watch where it moves. A hypothetical example: a profit factor that falls from 2.2 to 1.3 over several quarters tells you more about your system than any single value. It shows that the early figure overstated what the system delivers over more trades.
Trading involves risk; this article explains a metric and is not investment advice. Past results of a system, including the records shown here, do not guarantee future results.
Frequently asked questions about the profit factor
What is the profit factor in trading?
The profit factor is the sum of all winning trades divided by the sum of all losing trades. It shows how much profit a system made for every dollar of loss. Values above 1.0 stand for a profitable system, values below for a losing one.
How do you calculate the profit factor?
Add up all wins and divide by the sum of all losses, both after costs. With $12,000 in wins and $7,500 in losses, the profit factor is 1.6. Alternatively, calculate payoff ratio × (win rate ÷ loss rate); the result is the same.
What is a good profit factor?
There is no official standard; in my experience, systems that run for years mostly sit between 1.3 and 1.6. Values above 1.6 up to about 2.5 are very good if they are proven over several hundred trades. Above 3.0 is a warning sign of a sample that is too small or an over-fitted backtest. Exactly 1.0 is break-even.
What is the difference between profit factor and payoff ratio?
The payoff ratio compares averages, the profit factor compares sums. The payoff ratio sets the average win against the average loss and ignores the win rate. If you mix them up, you overrate systems with a low win rate.
How many trades does a reliable profit factor need?
There is no exact number, but below about 100 trades chance can have a large effect. Several hundred trades across different market phases make the figure more robust, though never certain. In my own journal, the expectancy fell from +0.73R after 29 trades to +0.54R after 61 trades.
What are the downsides of the profit factor?
It ignores the order of results and the maximum drawdown. A single large winner can lift it a lot. Strategies that add to losing positions look especially good as long as those positions stay open.
How can I improve my profit factor?
There are two levers: a higher win rate or larger winners relative to your losses. In practice, the second usually works better, through a consistent stop-loss order and planned take-profit orders. Lower trading costs count directly too, and correct position sizing keeps the losses in proportion.
Which software calculates the profit factor?
The strategy testers in MetaTrader, TradingView and NinjaTrader show it automatically. So do journal tools and Python backtesting frameworks. Check the cost settings: without commissions and swaps, the backtest value comes out too high.
This US edition is based on our German edition on kagels-trading.de and has been adapted for US readers.
More Risk Management guides
- Manage your trading risk
Risk Management in Trading: Rules, Math, Psychology
The 1% rule, stops, risk/reward, daily loss limits, leverage caps and the psychology of losing streaks, with the math behind each rule.
- Understand a stock market crash
Stock Market Crash: Causes, Patterns and Lessons
What caused 1929, 1987, 2000, 2008 and 2020, how deep the S&P 500 fell, how long recovery took, and the lessons for your own risk.
- Calculate your position size
Position Sizing in Trading: Formula, Calculator, Examples
The formula, a free calculator, the 1% rule explained correctly, and examples for stocks, forex and futures.
- Read your account equity
Account Equity vs Balance: Margin and Free Margin Explained
Equity against balance, margin, free margin and margin level, with a worked example and the close-out rules for cash, US margin and CFD accounts.
- Size your risk per trade
Kelly Criterion for Traders: Formula, Calculator, Risks
The Kelly formula for traders with a calculator, and a simulation of why full Kelly is far too much.
- Keep a trading journal
Trading Journal: How to Record and Review Your Trades
What to write before and after each trade, a completed example with a win and a loss, a weekly review and a template to copy.
- Choose a journal
Best Trading Journal Software 2026: 6 Tools Compared
Six journals compared on price, free plans, refunds, automatic broker sync, costs and export, with a decision guide.
- Check TradeZella
TradeZella Review 2026: Pricing, Features and Limitations
The three plans since July 2026, what Essential leaves out, the no-refund terms, imports, export and what users report.
- Check TraderSync
TraderSync Review 2026: Pricing, Broker Sync and Limits
Plans and dated prices, broker imports and autosync, Market Replay, Cypher and the no-refund policy.
- Check Tradervue
Tradervue Review 2026: Imports, Reports and Costs
Silver or Gold, why net P&L needs Gold, few automatic imports, US-only stocks, the no-refund sign-up terms and how to cancel.
- Check Edgewonk
Edgewonk Review 2026: Features, Costs and Limitations
One feature set billed monthly or yearly, the refund period, MetaTrader auto sync, the psychology tools and our own test journal.
- Check TradesViz
TradesViz Review 2026: Pricing, Broker Sync, Terms
The free stock plan, Pro and Platinum prices checked November 10, 2026, which US brokers sync automatically, the no-refund terms and user reviews.